Free with trial 3D rendering of a business infographic chart showing a progressive decline over four periods. Red color on the 3D bar graph chart with an arrow on it. Decrease statistics illustrations 3D render of a business data in decline. 3D rendering of a business infographic chart showing a progressive decline over four periods. Red color on the 3D bar graph chart with an arrow on it.
Free with trial Golden bar chart with downward arrow and dollar coin. Symbolizes economic decline, financial loss, market crash, recession, currency depreciation, business challenges. Decrease statistics illustrations Economic downturn represented by golden bar chart and dollar. Golden bar chart with downward arrow and dollar coin. Symbolizes economic decline, financial loss, market crash, recession, currency depreciation, business challenges
Free with trial A simple black and red bar chart displays data with varying heights on a white background. Decrease statistics illustrations Simple Bar Chart with One Red Bar on White Background graph data. A simple black and red bar chart displays data with varying heights on a white background
Free with trial Line Graph Chart Line And Solid Icon Set. Data Analysis, Trend Visualization, And Business Growth Symbol Collection. Statistical Representation And Performance Tracking. Isolated Vector Illustration. Decrease statistics vectors Line Graph Chart Line And Solid Icon Set. Data Analysis, Trend Visualization, And Business Growth Symbol Collection
Free with trial A circular golden coin with a black glossy face. On the black surface, a golden bar graph shows a downward trend, with the bars decreasing in height from left to right. A golden arrow points downwards, emphasizing the decline. The coin is isolated on a white background. Decrease statistics illustrations Golden Coin with Black Background Featuring a Falling Bar Graph and Downward Arrow falling graph. A circular golden coin with a black glossy face. On the black surface, a golden bar graph shows a downward trend, with the bars decreasing in height from left to right. A golden arrow points downwards, emphasizing the decline. The coin is isolated on a white background
Free with trial A clean line drawing showcases a magnifying glass focusing on a hand holding a declining bar graph with a downward. Decrease statistics illustrations Declining Market Analysis Magnifying Glass on Loss Trend. A clean line drawing showcases a magnifying glass focusing on a hand holding a declining bar graph with a downward.
Free with trial A dynamic digital illustration of a financial chart on a dark, high-tech background. The image features two contrasting lines: a vibrant green line trending upwards with an arrow, symbolizing growth, profit, and success, and a blue line moving downwards with an arrow, representing decline, loss, and risk. Glowing data points and a network grid enhance the futuristic feel. This versatile graphic is perfect for concepts related to stock market analysis, business performance, investment volatility, economic forecasting, big data, and financial technology (fintech). Decrease statistics illustrations Futuristic Financial Graph with Growth and Decline Arrows. A dynamic digital illustration of a financial chart on a dark, high-tech background. The image features two contrasting lines: a vibrant green line trending upwards with an arrow, symbolizing growth, profit, and success, and a blue line moving downwards with an arrow, representing decline, loss, and risk. Glowing data points and a network grid enhance the futuristic feel. This versatile graphic is perfect for concepts related to stock market analysis, business performance, investment volatility, economic forecasting, big data, and financial technology (fintech).
Free with trial Sales performance, data analysis, business strategy, financial downturn, decision making, marketing insights. Arrow pointing down with sale text, charts check mark. Sales performance and data. Decrease statistics vectors Sales Analytics and Performance Metrics with Downward Trends and Checkmark. Sales performance, data analysis, business strategy, financial downturn, decision making, marketing insights. Arrow pointing down with sale text, charts check mark. Sales performance and data
Free with trial A 3D illustration of a financial chart showing a dramatic downward trend. A large red arrow points sharply down over a series of declining blue bar graphs, symbolizing a stock market crash, economic recession, or business failure. The background features complex data and grids, representing financial analysis and market data. This image is perfect for concepts related to economic crisis, investment loss, financial risk, bankruptcy, and negative business reports. Decrease statistics illustrations Stock Market Crash Financial Graph. A 3D illustration of a financial chart showing a dramatic downward trend. A large red arrow points sharply down over a series of declining blue bar graphs, symbolizing a stock market crash, economic recession, or business failure. The background features complex data and grids, representing financial analysis and market data. This image is perfect for concepts related to economic crisis, investment loss, financial risk, bankruptcy, and negative business reports.
Free with trial Minimal glassmorphism arrows pointing up and down representing direction, navigation, or data flow, 3d rendering. Decrease statistics vectors Minimal glassmorphism arrows pointing up and down representing direction, navigation, or data flow, 3d rendering
Free with trial A minimalist 3D render featuring the number '5%' in a metallic gold finish, prominently displayed on a textured gold surface. To the right, a soft, gradient background transitions from a warm beige to a lighter cream, with a subtle vertical light strip adding depth. This image is ideal for representing discounts, interest rates, financial offers, or percentage-based promotions in marketing and business contexts. Decrease statistics illustrations Golden 5% Discount or Interest Rate with Soft Background. A minimalist 3D render featuring the number '5%' in a metallic gold finish, prominently displayed on a textured gold surface. To the right, a soft, gradient background transitions from a warm beige to a lighter cream, with a subtle vertical light strip adding depth. This image is ideal for representing discounts, interest rates, financial offers, or percentage-based promotions in marketing and business contexts.
Free with trial A financial report document lies flat on a white surface, displaying the text "FINANCIAL REPORT". Rising from the document are several translucent 3D bars in shades of purple, blue, and green, arranged in ascending order. To the right of the bars is a colorful 3D pie chart with segments in yellow, red, orange, and blue. Decrease statistics illustrations Financial Report with 3D Bar Graph and Pie Chart on White Background document paper. A financial report document lies flat on a white surface, displaying the text "FINANCIAL REPORT". Rising from the document are several translucent 3D bars in shades of purple, blue, and green, arranged in ascending order. To the right of the bars is a colorful 3D pie chart with segments in yellow, red, orange, and blue
Free with trial A black and white line drawing depicts a magnifying glass focusing on a gear, a descending bar graph, and a. Decrease statistics illustrations Decline Analysis Magnifying Glass, Gear, and Downward Graph. A black and white line drawing depicts a magnifying glass focusing on a gear, a descending bar graph, and a.
Free with trial A digital representation of a blue line graph showing a significant downward trend with fluctuations against a dark grid. Decrease statistics illustrations Abstract blue line graph depicting a sharp decline and volatile trend on a black grid background. A digital representation of a blue line graph showing a significant downward trend with fluctuations against a dark grid
Free with trial A 3D cartoon illustration depicts a stylized hand with a black suit cuff pointing a finger downwards towards a red bar graph. The graph shows a clear downward trend with bars decreasing in height from left to right, colored green, yellow, orange, and red. A red arrow reinforces the concept of decline. The image is set against a white background. Decrease statistics illustrations 3D Cartoon Hand Pointing Down at a Declining Bar Graph on White Background business. A 3D cartoon illustration depicts a stylized hand with a black suit cuff pointing a finger downwards towards a red bar graph. The graph shows a clear downward trend with bars decreasing in height from left to right, colored green, yellow, orange, and red. A red arrow reinforces the concept of decline. The image is set against a white background
Free with trial A green arrow graph displaying a sharp decline, indicating a downward trend. Decrease statistics vectors Green arrow decline graph showing downward trend. A green arrow graph displaying a sharp decline, indicating a downward trend.
Free with trial Decreasing graph line icon. Neumorphic, Flat shadow, 3d buttons. Column chart sign. Crisis diagram symbol. Line decreasing graph icon. Social media icons. Vector. Decrease statistics vectors Decreasing graph line icon. Crisis chart sign. Neumorphic buttons. Vector. Decreasing graph line icon. Neumorphic, Flat shadow, 3d buttons. Column chart sign. Crisis diagram symbol. Line decreasing graph icon. Social media icons. Vector
Free with trial Decreasing graph line icon. Neumorphic, Flat shadow, 3d buttons. Column chart sign. Market analytics symbol. Line decreasing graph icon. Social media icons. Vector. Decrease statistics vectors Decreasing graph line icon. Column chart sign. Neumorphic buttons. Vector. Decreasing graph line icon. Neumorphic, Flat shadow, 3d buttons. Column chart sign. Market analytics symbol. Line decreasing graph icon. Social media icons. Vector
Free with trial A stark red arrow graph descends sharply, symbolizing a significant downturn or loss, set against a minimalist blue backdrop. Decrease statistics illustrations Red arrow graph shows steep decline against blue background. A stark red arrow graph descends sharply, symbolizing a significant downturn or loss, set against a minimalist blue backdrop
Free with trial Declining bar chart. Wheat spikelets concept. Agricultural crisis symbol. Vector harvest illustration. EPS 10. Decrease statistics vectors Declining bar chart. Wheat spikelets concept. Agricultural crisis symbol. Vector harvest illustration.
Free with trial This image showcases a dynamic stock market graph, generated by AI, depicting a sharp downward trend in red. The vibrant red line against the black background creates a dramatic visual representation of market volatility. The image is perfect for illustrating concepts of risk, investment, and fina. Decrease statistics illustrations Red Market Dip. This image showcases a dynamic stock market graph, generated by AI, depicting a sharp downward trend in red. The vibrant red line against the black background creates a dramatic visual representation of market volatility. The image is perfect for illustrating concepts of risk, investment, and fina
Free with trial A collection of eight thin-line related to finance and business. The depict a stack of coins with a dollar sign, a document with a dollar sign, an upward trending graph over city buildings, and a bar chart with a plus sign. The bottom row coins and currency symbols, a calculator with a dollar sign, a document with a calculator and charts, and a person. Decrease statistics illustrations Financial set with charts and calculator finance business. A collection of eight thin-line related to finance and business. The depict a stack of coins with a dollar sign, a document with a dollar sign, an upward trending graph over city buildings, and a bar chart with a plus sign. The bottom row coins and currency symbols, a calculator with a dollar sign, a document with a calculator and charts, and a person
Free with trial Black icon of a jagged downward trend line within a circle on a white background. Clear details and vibrant co. Decrease statistics illustrations Circular Icon With Downward Jagged Trend Line graph chart. Black icon of a jagged downward trend line within a circle on a white background. Clear details and vibrant co
Free with trial Visualization flat style streaming sales graph illustration trend revenue, chperformance metrics, dashboard report visualization flat style streaming sales graph. Decrease statistics illustrations Visualization flat style streaming sales graph
Free with trial An empty corporate conference room featuring a large wooden table, office chairs, and a whiteboard displaying a hand-drawn graph indicating a downward trend in performance. Decrease statistics illustrations Modern Office Conference Room Showing Financial Loss Chart. An empty corporate conference room featuring a large wooden table, office chairs, and a whiteboard displaying a hand-drawn graph indicating a downward trend in performance
Free with trial A downward trending bar graph with a question mark is examined under a magnifying glass, symbolizing uncertainty and. Decrease statistics illustrations Decreasing Chart Under Magnifying Glass with Question Mark. A downward trending bar graph with a question mark is examined under a magnifying glass, symbolizing uncertainty and.
Free with trial Modern black and white vector icons depicting financial trends like rising, falling, and stable graphs, dollar signs, and investment arrows for business presentations and reports. Decrease statistics vectors Financial trend icons vector illustration showing profit loss growth and investment flat design. Modern black and white vector icons depicting financial trends like rising, falling, and stable graphs, dollar signs, and investment arrows for business presentations and reports.
Free with trial A 3D cartoon illustration depicts a stylized hand in a black suit jacket and white shirt cuff pointing its index finger downwards towards a red bar graph. The bar graph features several vertical bars of varying heights and colors, including green, yellow, orange, and red, arranged in a descending order from left to right, visually representing a decline. The entire graphic is presented on a clean. Decrease statistics illustrations 3D Cartoon Hand Pointing Down at Declining Bar Graph on White Background image photo. A 3D cartoon illustration depicts a stylized hand in a black suit jacket and white shirt cuff pointing its index finger downwards towards a red bar graph. The bar graph features several vertical bars of varying heights and colors, including green, yellow, orange, and red, arranged in a descending order from left to right, visually representing a decline. The entire graphic is presented on a clean
Free with trial A 3D icon depicts a financial graph. The icon features a rounded purple square with a lighter purple top edge. Inside, a yellow line chart with circular data points shows an upward trend, overlaid on a series of yellow vertical bars representing a bar chart. The overall design is clean and modern, symbolizing data analysis, business growth, and financial performance. Decrease statistics illustrations 3D icon representing a financial graph with bars and a line chart on a purple background. A 3D icon depicts a financial graph. The icon features a rounded purple square with a lighter purple top edge. Inside, a yellow line chart with circular data points shows an upward trend, overlaid on a series of yellow vertical bars representing a bar chart. The overall design is clean and modern, symbolizing data analysis, business growth, and financial performance
Free with trial A simple and bold icon illustration of a bar graph. This can be used to represent data, statistics, growth, or trends. The icon is designed in a clean and minimalist style, making it versatile for various applications. Decrease statistics vectors Simple Bold Bar Graph Sign Shape Icon for Data Presentation. A simple and bold icon illustration of a bar graph. This can be used to represent data, statistics, growth, or trends. The icon is designed in a clean and minimalist style, making it versatile for various applications.
Free with trial Data analytics dashboard illustrating a mix of line graphs, bar charts, and data summaries, representing business growth, financial trends, and statistical insights for market analysis. Decrease statistics vectors Data analytics dashboard showing business growth and decline. Data analytics dashboard illustrating a mix of line graphs, bar charts, and data summaries, representing business growth, financial trends, and statistical insights for market analysis
Free with trial GDP decline with red arrow. Economic decline or recession, concept. 3d rendering isolated on white background. Decrease statistics illustrations GDP decline with red arrow. Economic decline or recession, concept. 3d rendering
Free with trial A glowing neon red bar chart shows a significant downward trend, symbolizing financial loss or negative growth on a black backdrop. Decrease statistics illustrations Neon red bar chart illustrating a steep decline in financial performance against a dark background. A glowing neon red bar chart shows a significant downward trend, symbolizing financial loss or negative growth on a black backdrop
Free with trial 3D chart illustration showing a red arrow and decreasing blue bars on a light background, representing loss, decline or negative trend. Decrease statistics illustrations . 3D chart illustration showing a red arrow and decreasing blue bars on a light background, representing loss, decline or negative trend
Free with trial Two simple arrows on a white background. The red arrow points diagonally downward to the left, while the green arrow points diagonally upward to the right. Both arrows have a clean design with bold lines and sharp arrowheads, indicating contrast or opposing directions. Decrease statistics vectors Up and Down Growth Arrows - Stock Market Trend Vector Symbols. Two simple arrows on a white background. The red arrow points diagonally downward to the left, while the green arrow points diagonally upward to the right. Both arrows have a clean design with bold lines and sharp arrowheads, indicating contrast or opposing directions.
Free with trial A bold, red arrow with a zig-zag pattern points downwards, symbolizing a decline or negative trend. The arrow is rendered in a 3D style with subtle shading, giving it depth. It is isolated on a transparent background, making it versatile for various design applications. This graphic is ideal for representing financial losses, market downturns, declining performance, or any concept associated with a downward trajectory. Decrease statistics illustrations Red Downward Trend Arrow. A bold, red arrow with a zig-zag pattern points downwards, symbolizing a decline or negative trend. The arrow is rendered in a 3D style with subtle shading, giving it depth. It is isolated on a transparent background, making it versatile for various design applications. This graphic is ideal for representing financial losses, market downturns, declining performance, or any concept associated with a downward trajectory.
Free with trial A red and yellow financial chart depicts a steep downward trend. Red candlestick bars form the base, with yellow lines showing price fluctuations. A large yellow arrow clearly indicates a sharp decline, suggesting a significant market drop. Decrease statistics illustrations Red and Yellow Stock Market Chart with Steep Downward Trend. A red and yellow financial chart depicts a steep downward trend. Red candlestick bars form the base, with yellow lines showing price fluctuations. A large yellow arrow clearly indicates a sharp decline, suggesting a significant market drop
Free with trial Orange bar chart showing progressive data decline paired with a sad face icon suggesting disappointment. Ideal for business loss, failure, negative feedback, underperformance, worry, challenges. Decrease statistics vectors Bar Chart with Declining Data and Sad Face Icon Representing Negative Trends. Orange bar chart showing progressive data decline paired with a sad face icon suggesting disappointment. Ideal for business loss, failure, negative feedback, underperformance, worry, challenges
Free with trial Economic decline, financial loss, market trends, business analysis, payment reminder, schedule planning. Downward trend graph with sad face icon. Economic decline and financial loss. Decrease statistics vectors Economic Decline and Financial Trends with Calendar Reminder and Graph Symbols. Economic decline, financial loss, market trends, business analysis, payment reminder, schedule planning. Downward trend graph with sad face icon. Economic decline and financial loss
Free with trial A vibrant red arrow pointing directly downward, casting a subtle shadow on a clean white background, symbolizing direction, decline, or importance. Decrease statistics illustrations Red Arrow Pointing Downward with Shadow on White Background. A vibrant red arrow pointing directly downward, casting a subtle shadow on a clean white background, symbolizing direction, decline, or importance
Free with trial The word 'TRENDS' is displayed prominently in blue, overlaid by a sharp, downward-pointing red arrow, visually communicating a negative trend or decline in data or performance. Decrease statistics illustrations Word trends with a downward red arrow. The word 'TRENDS' is displayed prominently in blue, overlaid by a sharp, downward-pointing red arrow, visually communicating a negative trend or decline in data or performance
Free with trial A 3D render of a golden bar chart with bars decreasing in height from left to right, indicating a downward trend. The bars are metallic and shiny, casting subtle shadows on the white background. This visual represents financial decline, economic downturn, or negative performance. Decrease statistics illustrations Golden Bar Chart Showing Downward Trend on White Background graph decline. A 3D render of a golden bar chart with bars decreasing in height from left to right, indicating a downward trend. The bars are metallic and shiny, casting subtle shadows on the white background. This visual represents financial decline, economic downturn, or negative performance
Free with trial Black and white graph with dollar signs and decreasing trend line on white background. Decrease statistics vectors Black map pin icon with white circle in center. Black and white graph with dollar signs and decreasing trend line on white background
Free with trial A straightforward and clear vector graphic of a bar chart illustrating a negative trend. The solid black bars steadily decrease in height from left to right. A thick diagonal arrow points downward, connecting the top of the first bar to the end of the chart, visually emphasizing the decline. This minimalist design is perfect for representing losses, financial downturns, or decreasing statistics. Decrease statistics illustrations Declining Bar Chart Icon, AI Generated. A straightforward and clear vector graphic of a bar chart illustrating a negative trend. The solid black bars steadily decrease in height from left to right. A thick diagonal arrow points downward, connecting the top of the first bar to the end of the chart, visually emphasizing the decline. This minimalist design is perfect for representing losses, financial downturns, or decreasing statistics.
Free with trial Outline vector graphic depicting a decline in business performance. Decrease statistics illustrations Declining Performance Gear, Man, Graph, Arrow. Business Downturn. Outline vector graphic depicting a decline in business performance.
Free with trial A large, three-dimensional white percentage symbol is prominently displayed. The symbol is rendered with smooth, rounded edges and casts a soft shadow on the light gray surface it rests upon. The image is clean and minimalist, suitable for financial or commercial themes. Decrease statistics illustrations A large, three-dimensional white percentage symbol casting a shadow on a light gray surface. A large, three-dimensional white percentage symbol is prominently displayed. The symbol is rendered with smooth, rounded edges and casts a soft shadow on the light gray surface it rests upon. The image is clean and minimalist, suitable for financial or commercial themes
Free with trial A 3D rendered cartoon hand with a black cuff and white shirt sleeve points its index finger downwards towards a red bar chart. The chart displays a clear downward trend with bars of decreasing height in green, yellow, orange, and red, set on a dark gray base against a white background. Decrease statistics illustrations 3D Cartoon Hand Pointing Down at Declining Bar Chart on White Background graph decline. A 3D rendered cartoon hand with a black cuff and white shirt sleeve points its index finger downwards towards a red bar chart. The chart displays a clear downward trend with bars of decreasing height in green, yellow, orange, and red, set on a dark gray base against a white background
Free with trial A 3D rendered graphic depicts a simplified bar chart with pastel colored bars in pink, yellow, and blue. A line graph with white lines and orange and yellow nodes crosses diagonally above the bars. The elements are set against a light blue background with a light tan border, all isolated on a white background. Decrease statistics vectors 3 D cartoon bar chart with line graph on blue background data. A 3D rendered graphic depicts a simplified bar chart with pastel colored bars in pink, yellow, and blue. A line graph with white lines and orange and yellow nodes crosses diagonally above the bars. The elements are set against a light blue background with a light tan border, all isolated on a white background
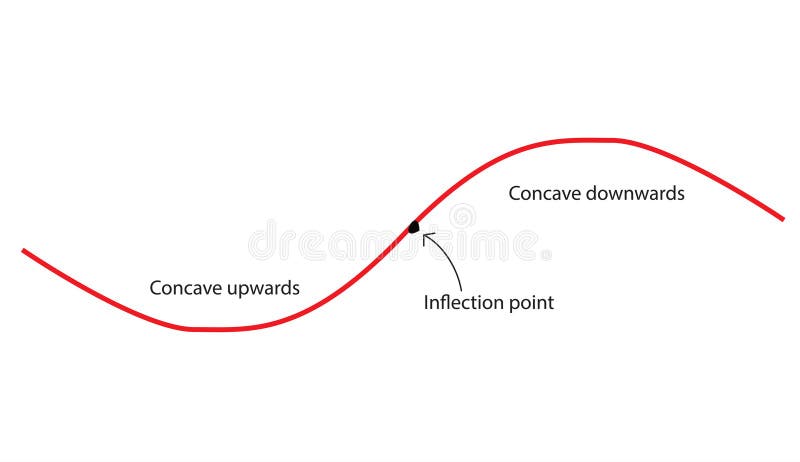
Free with trial Concavity of curve. Inflection point, concave down and concave up. Second derivative tangent lines of function. Decrease statistics vectors Concavity of curve
Free with trial This comprehensive vector illustration features a set of 18 flat icons depicting various financial trends, market indicators, and warning signals. The collection includes rising and falling line graphs, bar charts, currency symbols (dollar and euro) indicating fluctuations, and alert symbols like sirens and exclamation marks. Ideal for illustrating concepts of economic growth, decline, market volatility, financial crisis, investment risks, and business performance. Perfect for presentations, reports, websites, and applications related to finance, economics, and stock markets. Decrease statistics vectors Financial Trends, Market Indicators and Crisis Alert Icons Set. This comprehensive vector illustration features a set of 18 flat icons depicting various financial trends, market indicators, and warning signals. The collection includes rising and falling line graphs, bar charts, currency symbols (dollar and euro) indicating fluctuations, and alert symbols like sirens and exclamation marks. Ideal for illustrating concepts of economic growth, decline, market volatility, financial crisis, investment risks, and business performance. Perfect for presentations, reports, websites, and applications related to finance, economics, and stock markets.
Free with trial Close-up of neatly stacked coins, arranged in an ascending and descending pattern, symbolizing financial growth, savings, and investment progress. The blurred background features a dynamic financial market chart with glowing lines, representing stock market trends, economic data, or cryptocurrency fluctuations. This image effectively illustrates concepts of wealth management, business success, risk, and the fluctuating nature of the global economy. It's ideal for financial articles, presentations, and advertisements related to banking, investment, budgeting, and economic analysis. Decrease statistics illustrations Financial Growth Concept with Stacks of Coins and Stock Market Chart. Close-up of neatly stacked coins, arranged in an ascending and descending pattern, symbolizing financial growth, savings, and investment progress. The blurred background features a dynamic financial market chart with glowing lines, representing stock market trends, economic data, or cryptocurrency fluctuations. This image effectively illustrates concepts of wealth management, business success, risk, and the fluctuating nature of the global economy. It's ideal for financial articles, presentations, and advertisements related to banking, investment, budgeting, and economic analysis.
Free with trial A glossy, three-dimensional red percentage symbol stands prominently against a clean white background. The symbol casts a soft, subtle shadow, giving it a sense of depth and presence. Its smooth, reflective surface suggests a modern and impactful representation of financial concepts. Decrease statistics illustrations 3D Red Percentage Symbol Isolated on a White Background with Subtle Shadow image photo. A glossy, three-dimensional red percentage symbol stands prominently against a clean white background. The symbol casts a soft, subtle shadow, giving it a sense of depth and presence. Its smooth, reflective surface suggests a modern and impactful representation of financial concepts
Free with trial The chart shows falling oil prices with an oil rig visible in the background. Data highlights market changes. Decrease statistics illustrations Oil price trends show decline near oil extraction site in industry setting Generative AI. The chart shows falling oil prices with an oil rig visible in the background. Data highlights market changes
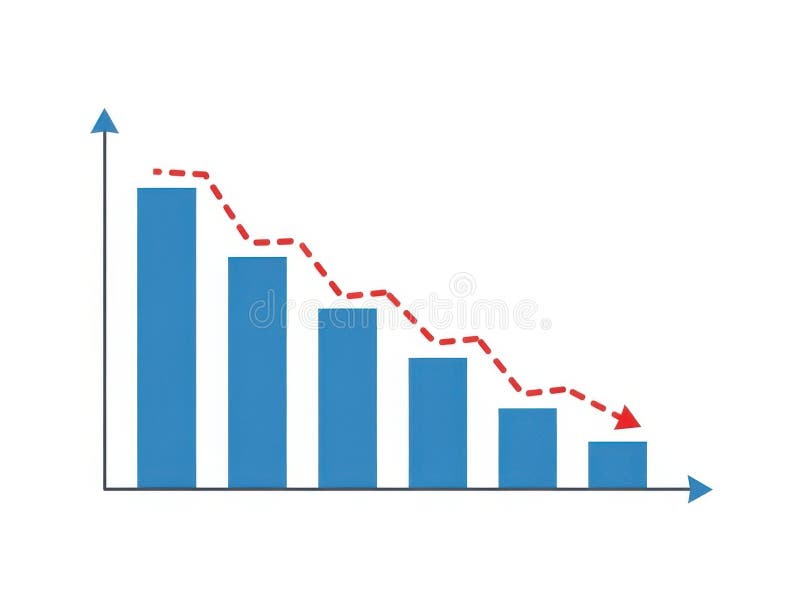
Free with trial This image features a bar chart with a decreasing trend isolated on a white background. The chart displays blue bars that progressively decrease in height from left to right, with a red dashed line indicating the downward trend. The horizontal axis represents different categories, while the vertical axis shows the corresponding values. The image is clear and SEO-friendly, highlighting data. Decrease statistics illustrations Bar chart with decreasing trend isolated on white background. This image features a bar chart with a decreasing trend isolated on a white background. The chart displays blue bars that progressively decrease in height from left to right, with a red dashed line indicating the downward trend. The horizontal axis represents different categories, while the vertical axis shows the corresponding values. The image is clear and SEO-friendly, highlighting data
Free with trial 3D yellow arrow graph descending sharply on a teal blue background, representing financial loss or negative trend. Decrease statistics illustrations 3D yellow arrow graph descending sharply on a teal blue background, representing financial loss or negative trend
Free with trial This set of four flat design icons visually represents key concepts related to climate change and sustainable energy. It includes a thermometer with a rising graph indicating global warming, a stylized Earth with continents and oceans, a young plant sprout symbolizing growth and nature, and a wind turbine representing renewable energy. These icons are ideal for illustrating environmental issues, conservation efforts, and the transition to clean power sources in presentations, articles, and educational materials. Decrease statistics illustrations Climate Change and Green Energy Icons. This set of four flat design icons visually represents key concepts related to climate change and sustainable energy. It includes a thermometer with a rising graph indicating global warming, a stylized Earth with continents and oceans, a young plant sprout symbolizing growth and nature, and a wind turbine representing renewable energy. These icons are ideal for illustrating environmental issues, conservation efforts, and the transition to clean power sources in presentations, articles, and educational materials.
Free with trial A 3D golden bar chart is arranged in a descending sequence, illustrating a downward trend. The bars are polished and reflective, casting subtle shadows on the pure white background. This visual represents a decline in data or financial performance. Decrease statistics illustrations Golden Bar Chart Showing Downward Trend on White Background graph metallic. A 3D golden bar chart is arranged in a descending sequence, illustrating a downward trend. The bars are polished and reflective, casting subtle shadows on the pure white background. This visual represents a decline in data or financial performance
Free with trial A magnifying glass focuses on a downward trend graph and briefcase, symbolizing economic downturn analysis and market. Decrease statistics illustrations Economic Downturn Analysis Magnifying Glass on Market Decline. A magnifying glass focuses on a downward trend graph and briefcase, symbolizing economic downturn analysis and market.
Free with trial This image illustrates a bar graph showing an upward trend in financial growth, accompanied by a line graph depicting market fluctuations over time. Decrease statistics illustrations Graphical representation of financial growth and fluctuation. This image illustrates a bar graph showing an upward trend in financial growth, accompanied by a line graph depicting market fluctuations over time
Free with trial This image depicts a combination of line and bar graphs showing comparative data analysis over a period of time. Decrease statistics illustrations Comparative data analysis over time with line and bar graphs. This image depicts a combination of line and bar graphs showing comparative data analysis over a period of time
Free with trial A 3D rendered blue metallic symbol representing 20 percent is displayed prominently against a dark, reflective surface. The lighting creates highlights and shadows, emphasizing the glossy texture of the number and the percentage sign. The background is dark and out of focus, drawing all attention to the central graphic. Decrease statistics illustrations 3D Blue 20 Percent Symbol With Reflective Surface And Dark Background twenty percent percentage. A 3D rendered blue metallic symbol representing 20 percent is displayed prominently against a dark, reflective surface. The lighting creates highlights and shadows, emphasizing the glossy texture of the number and the percentage sign. The background is dark and out of focus, drawing all attention to the central graphic
Free with trial A horizontal layout of multiple data visualizations illustrates key trends in HIV treatment and diagnosis, featuring line and bar graphs with upward and downward trajectories indicating changes in patient numbers, diagnosis percentages, and global infection rates, where a blue line graph shows increasing patient counts, a second bar chart reflects diagnosed case percentages, a third displays. Decrease statistics illustrations HIV treatment progress dashboard with statistical graphs showing patient growth, diagnosis rates, and global trends. A horizontal layout of multiple data visualizations illustrates key trends in HIV treatment and diagnosis, featuring line and bar graphs with upward and downward trajectories indicating changes in patient numbers, diagnosis percentages, and global infection rates, where a blue line graph shows increasing patient counts, a second bar chart reflects diagnosed case percentages, a third displays
Free with trial Orange bar chart with downward arrow vector illustration. Financial loss, economic recession, market crash, business failure, negative growth, data analysis. Declining graph with falling trend. Decrease statistics vectors Decreasing bar chart with downward arrow showing financial loss and economic recession vector illustration. Orange bar chart with downward arrow vector. Orange bar chart with downward arrow vector illustration. Financial loss, economic recession, market crash, business failure, negative growth, data analysis. Declining graph with falling trend
Free with trial This image shows a simple line graph with increasing and decreasing trends, ideal for visualizing data analysis and presenting key findings. The graph uses a clean, minimalist design to highlight the data points and overall trend. Perfect for presentations and reports. Decrease statistics illustrations Analyze Your Data. This image shows a simple line graph with increasing and decreasing trends, ideal for visualizing data analysis and presenting key findings. The graph uses a clean, minimalist design to highlight the data points and overall trend. Perfect for presentations and reports.
Free with trial Two blue bar graphs are depicted against a white background. The left graph bars increasing in height with an upward curving arrow, indicating growth. The right graph bars decreasing in height. Decrease statistics vectors Blue bar graphs showing upward and downward trends with arrows. Two blue bar graphs are depicted against a white background. The left graph bars increasing in height with an upward curving arrow, indicating growth. The right graph bars decreasing in height
Free with trial An abstract representation of a stock market decline is illustrated through a sharply descending red line graph against a dark, grid-like background. The red hues emphasize the severity of the drop, suggesting financial loss. Numerical data points faintly accompany the visual. This image was generat. Decrease statistics illustrations Red Stock Decline. An abstract representation of a stock market decline is illustrated through a sharply descending red line graph against a dark, grid-like background. The red hues emphasize the severity of the drop, suggesting financial loss. Numerical data points faintly accompany the visual. This image was generat
Free with trial A circular icon containing a stylized representation of financial data. The icon features a series of black vertical bars of varying heights, suggesting a bar chart. Overlaid on the bars are two thin lines, one black and one grey, depicting line graphs with peaks and troughs, indicating fluctuating trends. The overall design is minimalist and symbolic, suitable for representing business analytics. Decrease statistics illustrations Circular Graph Icon with Bar and Line Charts Representing Financial Data and Trends business. A circular icon containing a stylized representation of financial data. The icon features a series of black vertical bars of varying heights, suggesting a bar chart. Overlaid on the bars are two thin lines, one black and one grey, depicting line graphs with peaks and troughs, indicating fluctuating trends. The overall design is minimalist and symbolic, suitable for representing business analytics
Free with trial A vibrant, hand-drawn doodle illustration centered around a large percentage sign. This creative sketch features various financial and business icons, including bar graphs, pie charts, stacks of coins, dollar signs, and arrows indicating growth and decline. The colorful, cartoonish style makes it perfect for illustrating concepts like interest rates, economic trends, business analytics, and financial reports. Ideal for use in presentations, infographics, websites, and educational materials, this vector art is isolated on a white background for versatile application. Decrease statistics illustrations Finance and Economy Doodle Illustration. A vibrant, hand-drawn doodle illustration centered around a large percentage sign. This creative sketch features various financial and business icons, including bar graphs, pie charts, stacks of coins, dollar signs, and arrows indicating growth and decline. The colorful, cartoonish style makes it perfect for illustrating concepts like interest rates, economic trends, business analytics, and financial reports. Ideal for use in presentations, infographics, websites, and educational materials, this vector art is isolated on a white background for versatile application.
Free with trial Circular maze with a descending bar chart icon, symbolizing the challenge of navigating business data and analytics amid declines, obstacles, and the search for strategic solutions and recovery. Decrease statistics illustrations Navigating complex data decline challenges and finding solutions. Circular maze with a descending bar chart icon, symbolizing the challenge of navigating business data and analytics amid declines, obstacles, and the search for strategic solutions and recovery
Free with trial A striking digital illustration features a bold red and white bullseye target with a prominent red percentage symbol at its precise center, set against a stark black background and surrounded by a constellation of smaller white and red percentage signs that radiate outward, creating a modern and minimalist visual metaphor for goals, accuracy, metrics, business growth, and data-driven success. Decrease statistics illustrations A digital illustration of a red and white target with a percentage sign in the center, surrounded by smaller percentage symbols on. A striking digital illustration features a bold red and white bullseye target with a prominent red percentage symbol at its precise center, set against a stark black background and surrounded by a constellation of smaller white and red percentage signs that radiate outward, creating a modern and minimalist visual metaphor for goals, accuracy, metrics, business growth, and data-driven success
Free with trial A blue holographic graph showing a downward trend with bars and a line chart is projected over a dark conference table and chairs. Decrease statistics illustrations Holographic graph displaying insurance reimbursement delays over a conference table chart. A blue holographic graph showing a downward trend with bars and a line chart is projected over a dark conference table and chairs
Free with trial This image presents a detailed analysis of business performance metrics, including market share, quarterly sales, and key performance indicators (KPIs. Decrease statistics illustrations Comprehensive business performance metrics and growth analysis. This image presents a detailed analysis of business performance metrics, including market share, quarterly sales, and key performance indicators (KPIs
Free with trial A red line graph showing a significant downward trend, indicating a decline or loss, set against a subtle white background with small, scattered grid points. Decrease statistics illustrations Red downward trend line on a white background with grid points. A red line graph showing a significant downward trend, indicating a decline or loss, set against a subtle white background with small, scattered grid points
Free with trial A prominent 3D metallic US dollar sign stands against a dynamic digital background featuring various financial charts and graphs. The background displays a fluctuating line graph and a colorful bar chart, symbolizing market trends, economic data, and investment performance. This image powerfully conveys concepts of finance, global economy, currency strength, stock market analysis, and wealth management in a modern, digital context. Ideal for illustrating reports, presentations, or articles related to business, banking, and financial growth. Decrease statistics illustrations US Dollar Symbol with Digital Financial Charts and Market Data. A prominent 3D metallic US dollar sign stands against a dynamic digital background featuring various financial charts and graphs. The background displays a fluctuating line graph and a colorful bar chart, symbolizing market trends, economic data, and investment performance. This image powerfully conveys concepts of finance, global economy, currency strength, stock market analysis, and wealth management in a modern, digital context. Ideal for illustrating reports, presentations, or articles related to business, banking, and financial growth.
Free with trial A 3D render of a percentage symbol made of transparent glass with two clear water droplets positioned as the two circles of the symbol. The symbol is set against a clean white background with subtle lighting. Decrease statistics illustrations Transparent Glass Percentage Symbol With Water Droplets On White Background sign discount. A 3D render of a percentage symbol made of transparent glass with two clear water droplets positioned as the two circles of the symbol. The symbol is set against a clean white background with subtle lighting