Free with trial Green up and red down 3d arrow graph showing rising, descending trend, business result, profit or loss symbol symbol. Business arrow, goals concept. 3d world money symbols. Financial growth vector isolated. Decrease statistics vectors Green up and red down 3d arrow graph showing rising, descending trend, business result, profit. world money symbols. Green up and red down 3d arrow graph showing rising, descending trend, business result, profit or loss symbol symbol. Business arrow, goals concept. 3d world money symbols. Financial growth vector isolated
Free with trial Ai-Generated. Professional chart stock image featuring set of black and white minimalist chart and graph line icons. Decrease statistics vectors Set of black and white minimalist chart and graph line icons
Free with trial A conceptual illustration of market analysis featuring a bar chart, magnifying glass, upward and downward arrows, and business icons on white. Decrease statistics illustrations Market Analysis Concept with Bar Chart Magnifying Glass and Upward Arrow graph. A conceptual illustration of market analysis featuring a bar chart, magnifying glass, upward and downward arrows, and business icons on white
Free with trial Green up and red down 3d arrow graph showing rising, descending trend, business result, profit or loss symbol symbol. Business arrow, goals concept. 3d world money symbols. Financial growth vector isolated. Decrease statistics vectors Green up and red down 3d arrow graph showing rising, descending trend, business result, profit. world money symbols. Green up and red down 3d arrow graph showing rising, descending trend, business result, profit or loss symbol symbol. Business arrow, goals concept. 3d world money symbols. Financial growth vector isolated
Free with trial Green up and red down 3d arrow graph showing rising, descending trend, business result, profit or loss symbol symbol. Business arrow, goals concept. 3d world money symbols. Financial growth vector isolated. Decrease statistics vectors Green up and red down 3d arrow graph showing rising, descending trend, business result, profit. world money symbols. Green up and red down 3d arrow graph showing rising, descending trend, business result, profit or loss symbol symbol. Business arrow, goals concept. 3d world money symbols. Financial growth vector isolated
Free with trial Green up and red down 3d arrow graph showing rising, descending trend, business result, profit or loss symbol symbol. Business arrow, goals concept. 3d world money symbols. Financial growth vector isolated. Decrease statistics vectors Green up and red down 3d arrow graph showing rising, descending trend, business result, profit. world money symbols. Green up and red down 3d arrow graph showing rising, descending trend, business result, profit or loss symbol symbol. Business arrow, goals concept. 3d world money symbols. Financial growth vector isolated
Free with trial A collage of nine distinct charts and graphs, primarily displaying financial data, growth trends, and economic indicators. The visuals feature line graphs, area charts, and bar charts with various colored lines and shaded areas representing different metrics over time. Accompanying text and labels suggest analysis of business performance, economic growth, and financial markets. This collection is ideal for presentations, reports, and articles related to finance, economics, and business analytics. Decrease statistics illustrations Collection of Financial and Business Growth Charts. A collage of nine distinct charts and graphs, primarily displaying financial data, growth trends, and economic indicators. The visuals feature line graphs, area charts, and bar charts with various colored lines and shaded areas representing different metrics over time. Accompanying text and labels suggest analysis of business performance, economic growth, and financial markets. This collection is ideal for presentations, reports, and articles related to finance, economics, and business analytics.
Free with trial Downward arrow, swirling line with blue concentric circles, and percentage symbol suggest falling rates. Ideal for finance, economy, interest, discount, marketing statistics cost management. Flat. Decrease statistics vectors Declining Percentage Rate Represented by Downward Arrow and Percentage Symbol. Downward arrow, swirling line with blue concentric circles, and percentage symbol suggest falling rates. Ideal for finance, economy, interest, discount, marketing statistics cost management. Flat
Free with trial This image showcases colorful 3D charts and graphs, representing financial data, generated by AI. It includes bar graphs, pie charts, and other visual representations of financial performance, displayed on a tablet and printed reports. The image suggests growth and positive financial trends. Decrease statistics illustrations AI-Generated Financial Charts. This image showcases colorful 3D charts and graphs, representing financial data, generated by AI. It includes bar graphs, pie charts, and other visual representations of financial performance, displayed on a tablet and printed reports. The image suggests growth and positive financial trends.
Free with trial Illustration of a business activities. Decrease statistics vectors Illustration of a business activities
Free with trial Illustration of a business activities. Decrease statistics vectors Illustration of a business activities
Free with trial A visual representation of declining performance, with red bars and a descending line graph on a white background. Decrease statistics illustrations Red bar chart showing downward trend and line graph. A visual representation of declining performance, with red bars and a descending line graph on a white background.
Free with trial A black jagged arrow pointing diagonally downward on a white background. Clear details and vibrant colors enha. Decrease statistics illustrations Black Jagged Arrow Pointing Downward On White Background direction symbol. A black jagged arrow pointing diagonally downward on a white background. Clear details and vibrant colors enha
Free with trial A black curve graph depicts a revenue slowdown on a white background. Clear details and vibrant colors enhance. Decrease statistics illustrations Black curve graph showing revenue slowdown on white background chart line. A black curve graph depicts a revenue slowdown on a white background. Clear details and vibrant colors enhance
Free with trial Three black bars with downward arrows indicating decline on white background Clear details and vibrant colors. Decrease statistics illustrations Three black bars with downward arrows on white background bar chart graph. Three black bars with downward arrows indicating decline on white background Clear details and vibrant colors
Free with trial Three wooden blocks arranged in a step-like formation on a wooden surface, with an upward-pointing arrow on the middle block and a downward-pointing arrow on the top block, representing concepts of growth, decline, and change in business or finance. Decrease statistics illustrations Wooden blocks with up and down arrows symbolizing business growth and decline. Three wooden blocks arranged in a step-like formation on a wooden surface, with an upward-pointing arrow on the middle block and a downward-pointing arrow on the top block, representing concepts of growth, decline, and change in business or finance
Free with trial Three stacks of coins, each topped with a wooden block featuring a downward-pointing arrow, illustrating a concept of financial loss, economic downturn, or decreasing value against a blue background. Decrease statistics illustrations Decreasing stacks of coins with down arrows symbolizing financial decline. Three stacks of coins, each topped with a wooden block featuring a downward-pointing arrow, illustrating a concept of financial loss, economic downturn, or decreasing value against a blue background
Free with trial Falling Vector arrow. Downward curve set. Motion flow symbol. Dynamic line illustration. Manual vector only. No autotrace used. EPS 10. Decrease statistics vectors Falling Vector arrow. Downward curve set. Motion flow symbol. Dynamic line illustration. Manual vector only. No autotrace used.
Free with trial A robotic hand extends toward dynamic financial graphs and data in a cosmic setting. This image symbolizes the intersection of technology and finance, showcasing innovation. Scalp. Decrease statistics illustrations Futuristic robotic hand reaching towards digital financial graphs and data visualizations in a cosmic background with. A robotic hand extends toward dynamic financial graphs and data in a cosmic setting. This image symbolizes the intersection of technology and finance, showcasing innovation. Scalp
Free with trial Sad face near decreasing graph alongside warning triangle and green leaves conveying climate, environment, conservation, eco-crisis, risk, sustainability, and awareness. Simple flat metaphor. Decrease statistics illustrations Environmental crisis concept with decrease graph, warning triangle, sad face, and green leaves. Sad face near decreasing graph alongside warning triangle and green leaves conveying climate, environment, conservation, eco-crisis, risk, sustainability, and awareness. Simple flat metaphor
Free with trial Economic crisis and fall down stock market concept with digital downward yellow and red financial graph on dark background with dots. 3D rendering. Decrease statistics illustrations Economic crisis and fall down stock market concept
Free with trial This image presents a compelling visual representation of a global economic downturn. A prominent, three-dimensional white arrow dramatically plunges downward, superimposed on a world map rendered in dark, somber tones. The map serves as a backdrop to several red bar graphs, illustrating a decline in various economic indicators across different regions of the globe. The overall color scheme reinforces a sense of crisis and uncertainty. The arrow's sharp descent visually emphasizes the severity of the economic drop. Numerical data and graphical representations are included, further supporting the downward economic trend. Decrease statistics illustrations Global Economic Downturn Visualized with 3D Arrow and Charts. This image presents a compelling visual representation of a global economic downturn. A prominent, three-dimensional white arrow dramatically plunges downward, superimposed on a world map rendered in dark, somber tones. The map serves as a backdrop to several red bar graphs, illustrating a decline in various economic indicators across different regions of the globe. The overall color scheme reinforces a sense of crisis and uncertainty. The arrow's sharp descent visually emphasizes the severity of the economic drop. Numerical data and graphical representations are included, further supporting the downward economic trend.
Free with trial A bold, three-dimensional rendering of the number '10' followed by a percent sign, all in a vibrant, glossy orange. The digits are rounded and have a smooth, reflective surface, casting subtle shadows on a clean white background. This graphic is ideal for representing discounts, sales, percentages, financial concepts, and marketing promotions. Decrease statistics illustrations Shiny Orange 10 Percent Discount Symbol. A bold, three-dimensional rendering of the number '10' followed by a percent sign, all in a vibrant, glossy orange. The digits are rounded and have a smooth, reflective surface, casting subtle shadows on a clean white background. This graphic is ideal for representing discounts, sales, percentages, financial concepts, and marketing promotions.
Free with trial Growth chart line icon. Neumorphic, Flat shadow, 3d buttons. Column graph sign. Market analytics symbol. Line growth chart icon. Social media icons. Vector. Decrease statistics vectors Growth chart line icon. Column graph sign. Neumorphic buttons. Vector. Growth chart line icon. Neumorphic, Flat shadow, 3d buttons. Column graph sign. Market analytics symbol. Line growth chart icon. Social media icons. Vector
Free with trial A 3D blue bar chart and a dark blue line graph illustrate a significant downward trend, indicating a decline in data over time. Decrease statistics illustrations Blue bar chart and line graph showing downward trend. A 3D blue bar chart and a dark blue line graph illustrate a significant downward trend, indicating a decline in data over time.
Free with trial A conceptual image featuring a series of ascending wooden blocks, with a green upward arrow on a lower block and a red downward arrow on a higher block, symbolizing the fluctuating nature of business, market trends, and financial performance. The image conveys concepts of success, failure, progress, and setback in a clear and concise manner. Decrease statistics illustrations Wooden Blocks with Up and Down Arrows Representing Business Growth and Decline. A conceptual image featuring a series of ascending wooden blocks, with a green upward arrow on a lower block and a red downward arrow on a higher block, symbolizing the fluctuating nature of business, market trends, and financial performance. The image conveys concepts of success, failure, progress, and setback in a clear and concise manner
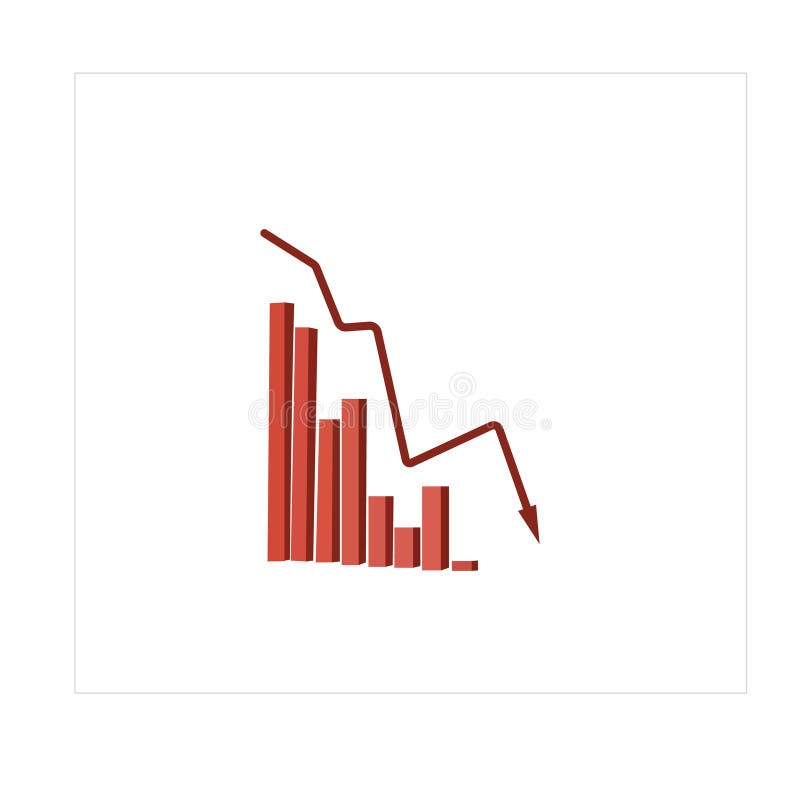
Free with trial A visual representation of a business or financial metric showing a significant decline, depicted by a series of blue bars and a descending red arrow. Decrease statistics illustrations Bar chart with red arrow indicating a downward trend. A visual representation of a business or financial metric showing a significant decline, depicted by a series of blue bars and a descending red arrow
Free with trial Business Meeting on Real Estate Market Analysis with Charts, Graphs, and Digital House Icon Showing Trends in Property Value Changes Sigmoid. Decrease statistics illustrations Professionals discuss real estate market trends using data and analytics. A digital house icon symbolizes value changes. Business Meeting on Real Estate Market Analysis with Charts, Graphs, and Digital House Icon Showing Trends in Property Value Changes Sigmoid
Free with trial Smiling blue face beside a decreasing bar graph, signifying satisfaction, feedback, or performance trends. Ideal for analytics, feedback, emotions, surveys, performance data presentation simple. Decrease statistics vectors Positive Feedback Represented by Happy Face and Declining Bar Graph. Smiling blue face beside a decreasing bar graph, signifying satisfaction, feedback, or performance trends. Ideal for analytics, feedback, emotions, surveys, performance data presentation simple
Free with trial Graph with a red heart at the start and downward trend line, symbolizing breakup, relationship decline, and emotional loss over time. Decrease statistics vectors Graph with a red heart at the start and downward trend line, symbolizing breakup, relationship decline, and emotional loss over
Free with trial A multi-colored line graph compares pharmaceutical or medical dosage levels across different countries from the year 2000 onward, featuring seven distinct colored lines in orange, yellow, green, red, blue, purple, and pink that represent various dose types arranged in wave-like patterns with the orange line positioned highest on the left side indicating elevated doses while the green line shows. Decrease statistics illustrations Comparative dose graph showing multiple countries and years with colored lines representing different pharmaceutical or medical. A multi-colored line graph compares pharmaceutical or medical dosage levels across different countries from the year 2000 onward, featuring seven distinct colored lines in orange, yellow, green, red, blue, purple, and pink that represent various dose types arranged in wave-like patterns with the orange line positioned highest on the left side indicating elevated doses while the green line shows
Free with trial A simple line graph showing a downward trend with an arrow pointing down on a white background. Decrease statistics illustrations Downward trending line graph with arrow indicating decline business finance. A simple line graph showing a downward trend with an arrow pointing down on a white background
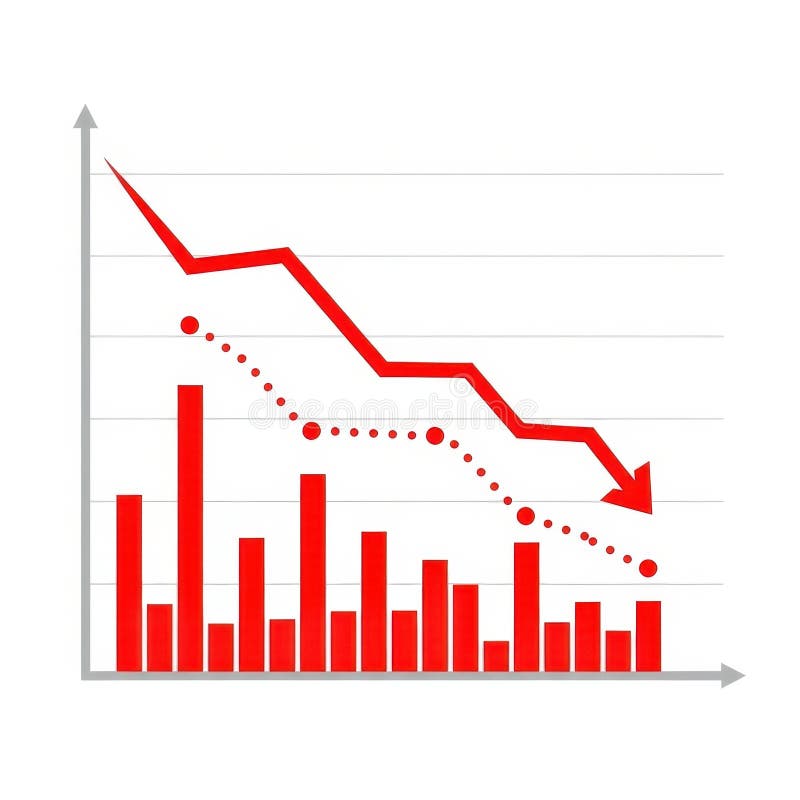
Free with trial A visual representation of negative financial performance. It features red bars and a red line graph showing a downward trend, accompanied by a dotted line indicating a similar pattern. Decrease statistics illustrations Red downward trending graph with bars and dotted line. A visual representation of negative financial performance. It features red bars and a red line graph showing a downward trend, accompanied by a dotted line indicating a similar pattern
Free with trial This striking image depicts a red globe and barrels, symbolizing economic downturn, financial loss, and market volatility, set against a dark background. Decrease statistics illustrations Global Economic Crisis Concept with Red Globe and Barrel Symbols Representing Market Downturn on Black Background. This striking image depicts a red globe and barrels, symbolizing economic downturn, financial loss, and market volatility, set against a dark background
Free with trial Blue sad face next to a declining line graph in a calendar frame under a cloud. Ideal for business loss, economic crisis, emotional impact, failure, disappointment, analytics, trends. Simple flat. Decrease statistics vectors Sad face and declining data chart representing failure, downturn, or negative outcome concept. Blue sad face next to a declining line graph in a calendar frame under a cloud. Ideal for business loss, economic crisis, emotional impact, failure, disappointment, analytics, trends. Simple flat
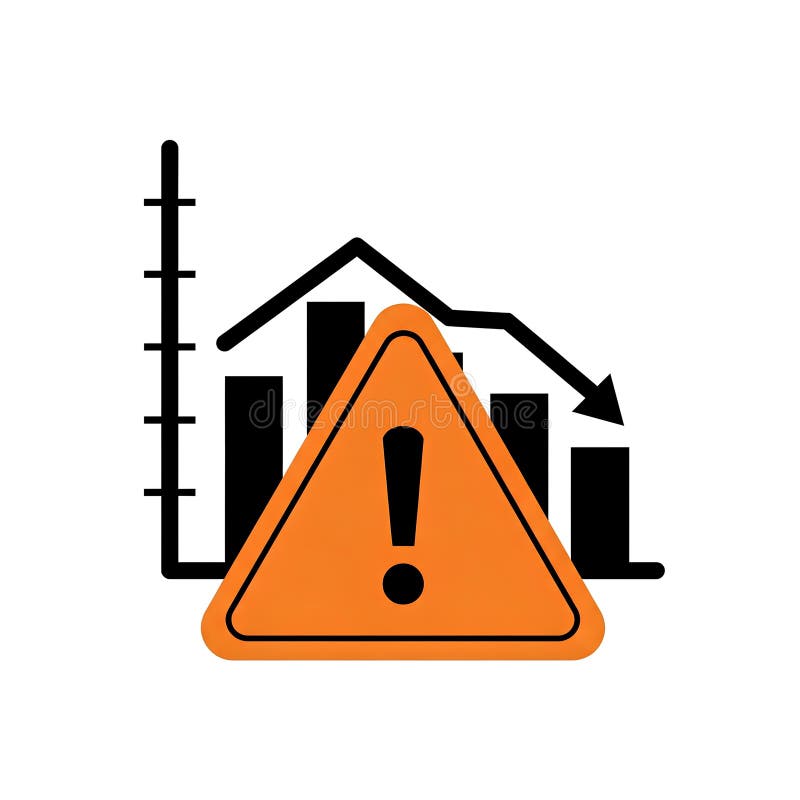
Free with trial Illustration of a downward trending graph with an orange warning sign in the foreground. The graph depicts a decline in performance or value. The warning sign highlights potential risks or negative outcomes. This image can be used to represent financial loss, economic downturn, business failure, or any situation where caution is advised. Decrease statistics illustrations Warning Sign with Declining Graph. Illustration of a downward trending graph with an orange warning sign in the foreground. The graph depicts a decline in performance or value. The warning sign highlights potential risks or negative outcomes. This image can be used to represent financial loss, economic downturn, business failure, or any situation where caution is advised.
Free with trial Downward Business Graph with Arrows Financial Loss and Market Decline Concept. Decrease statistics vectors Downward Business Graph with Arrows Financial Loss and Market Decline Concept
Free with trial 3D rendered graphic showing the word Finance in bold black letters with a green upward trending arrow above and a red downward trending arrow below, flanked by blue opposing arrows on a grid background. Decrease statistics illustrations Finance growth upward trend with opposing arrows image. 3D rendered graphic showing the word Finance in bold black letters with a green upward trending arrow above and a red downward trending arrow below, flanked by blue opposing arrows on a grid background
Free with trial A blue bar chart shows a downward trend indicated by a sharp red arrow. Isolated on a transparent background. Decrease statistics vectors Blue bar chart with red downward trending arrow isolated on a transparent background. A blue bar chart shows a downward trend indicated by a sharp red arrow. Isolated on a transparent background
Free with trial Downward arrow, magnifying glass, dollar sign indicate declining trends, financial analysis, revenue downturn. Ideal for business, finance, investment, market trends loss economic study simple. Decrease statistics vectors Declining Trends in Business Revenue with Analysis and Financial Focus. Downward arrow, magnifying glass, dollar sign indicate declining trends, financial analysis, revenue downturn. Ideal for business, finance, investment, market trends loss economic study simple
Free with trial Abstract 3D render of a financial growth chart. The image features a series of vertical bars, some in teal and others in orange, representing data points on a graph. The bars increase in height towards the right, suggesting positive growth or progress. The chart is set against a dark background with a subtle grid pattern and a reflective surface, adding depth and visual interest. Suitable for illustrating financial reports, market analysis, or business trends. Decrease statistics illustrations Abstract Financial Growth Chart. Abstract 3D render of a financial growth chart. The image features a series of vertical bars, some in teal and others in orange, representing data points on a graph. The bars increase in height towards the right, suggesting positive growth or progress. The chart is set against a dark background with a subtle grid pattern and a reflective surface, adding depth and visual interest. Suitable for illustrating financial reports, market analysis, or business trends.
Free with trial Paper cutouts Upward red arrow, zigzag green arrow & downward red arrow on pastel background. Decrease statistics illustrations Red and green arrows up and. Paper cutouts Upward red arrow, zigzag green arrow & downward red arrow on pastel background
Free with trial A silver laptop sits on a light brown wooden surface. Its screen displays a dark background with a grid pattern and a prominent red line graph sharply declining from left to right. The red line is brightly lit, creating a strong visual contrast against the dark background. The overall mood is one of concern or warning, suggesting a negative trend or decline. The image is clean and simple, focusing, generated by AI. Decrease statistics illustrations Laptop Screen Showing Red Downward Trend Graph computer. A silver laptop sits on a light brown wooden surface. Its screen displays a dark background with a grid pattern and a prominent red line graph sharply declining from left to right. The red line is brightly lit, creating a strong visual contrast against the dark background. The overall mood is one of concern or warning, suggesting a negative trend or decline. The image is clean and simple, focusing, generated by AI.
Free with trial A bright blue easel holds a whiteboard displaying a bar chart with a clear downward trend. The bars transition in color from green to red, and a prominent red arrow points downwards, emphasizing the decline. The illustration is set against a clean white background. Decrease statistics illustrations Blue Easel Displaying a Downward Trend Bar Chart with Red Arrow graph decline. A bright blue easel holds a whiteboard displaying a bar chart with a clear downward trend. The bars transition in color from green to red, and a prominent red arrow points downwards, emphasizing the decline. The illustration is set against a clean white background
Free with trial A blue bar and line graph showing upward financial trends against a backdrop of a world map, symbolizing global economic growth and market expansion. Decrease statistics illustrations Global business growth chart with world map background. A blue bar and line graph showing upward financial trends against a backdrop of a world map, symbolizing global economic growth and market expansion
Free with trial 3D red bar graph with downward arrows indicating decline. Suitable for diverse creative needs. Decrease statistics illustrations 3D red bar graph with downward arrows indicating decline.
Free with trial Hand Drawn Downward Trend Arrow On white Background. Decrease statistics illustrations Hand-drawn black zigzag line ending with a downward arrow On white Background, symbolizing decline or negative trend. Hand Drawn Downward Trend Arrow On white. Hand Drawn Downward Trend Arrow On white Background
Free with trial Sales data trends illustration figures products, quarter chbar, highlight market sales data trends. Decrease statistics illustrations Sales data trends
Free with trial Financial stock market chart with falling red arrow and rising green arrow. Business growth and decline concept for economic analysis success failure and investment. Decrease statistics vectors Red decreasing and green increasing arrows representing market trend analytics. Financial stock market chart with falling red arrow and rising green arrow. Business growth and decline concept for economic analysis success failure and investment
Free with trial A black silhouette of a bar chart with three bars of decreasing height, representing a downward trend on a white background. Decrease statistics illustrations Black Bar Chart Icon Showing Decreasing Values on White Background graph data. A black silhouette of a bar chart with three bars of decreasing height, representing a downward trend on a white background
Free with trial Downward trend line on a graph, sad face emoticon, verified user profile. Ideal for analytics, decline monitoring, user feedback, quality control, performance review, error tracking simple flat. Decrease statistics vectors Declining Performance Chart with Sad Face and User Profile Checkmark. Downward trend line on a graph, sad face emoticon, verified user profile. Ideal for analytics, decline monitoring, user feedback, quality control, performance review, error tracking simple flat
Free with trial A black jagged line graph with an arrow pointing downwards on a white background. Clear details and vibrant co. Decrease statistics illustrations Black descending jagged line graph with arrow indicating downward trend chart. A black jagged line graph with an arrow pointing downwards on a white background. Clear details and vibrant co
Free with trial Sixteen simple yellow candlestick charts with black lines on a white background, arranged in a four by four grid. Decrease statistics vectors Vector illustration of sixteen yellow candlestick charts. Sixteen simple yellow candlestick charts with black lines on a white background, arranged in a four by four grid
Free with trial A clean 3D render featuring a bright blue arrow pointing upwards and a vibrant red arrow pointing downwards, positioned side-by-side. The arrows have rounded edges and a smooth, matte finish, casting subtle shadows on the white background. This imagery represents opposing directions, choices, or trends. Decrease statistics illustrations 3D Rendered Blue Up Arrow and Red Down Arrow Side by Side on White Background image photo. A clean 3D render featuring a bright blue arrow pointing upwards and a vibrant red arrow pointing downwards, positioned side-by-side. The arrows have rounded edges and a smooth, matte finish, casting subtle shadows on the white background. This imagery represents opposing directions, choices, or trends
Free with trial A collage of various hand-drawn charts and graphs in shades of blue, illustrating business growth, data analysis, and financial trends. The collection includes bar charts, line graphs, and pie charts, all rendered with a sketchy, artistic style. These visuals are perfect for presentations, reports, or any project requiring a dynamic and informative representation of data and progress. Decrease statistics illustrations Hand-Drawn Business Growth Charts and Graphs Collection. A collage of various hand-drawn charts and graphs in shades of blue, illustrating business growth, data analysis, and financial trends. The collection includes bar charts, line graphs, and pie charts, all rendered with a sketchy, artistic style. These visuals are perfect for presentations, reports, or any project requiring a dynamic and informative representation of data and progress.
Free with trial Abstract illustration of business growth, featuring bar graphs and line graphs in shades of blue and grey. The image conveys concepts of data analysis, progress, and financial performance. Suitable for presentations, reports, and marketing materials related to business, finance, and technology. Decrease statistics illustrations Abstract Business Growth Chart. Abstract illustration of business growth, featuring bar graphs and line graphs in shades of blue and grey. The image conveys concepts of data analysis, progress, and financial performance. Suitable for presentations, reports, and marketing materials related to business, finance, and technology.
Free with trial A dynamic red jagged arrow plunges downward, visually representing a sharp decline, economic downturn, or negative trend in business and finance. Ideal for charting losses or market drops. Decrease statistics illustrations Red jagged arrow pointing down symbolizing financial decline or negative trend. A dynamic red jagged arrow plunges downward, visually representing a sharp decline, economic downturn, or negative trend in business and finance. Ideal for charting losses or market drops
Free with trial A stark red arrow zigzags downwards, powerfully representing economic downturns, market crashes, and negative financial trends. This visual signifies a crisis or significant drop. Decrease statistics illustrations Red downward arrow symbolizing financial decline and economic recession trends. A stark red arrow zigzags downwards, powerfully representing economic downturns, market crashes, and negative financial trends. This visual signifies a crisis or significant drop
Free with trial A modern business analytics dashboard showcasing key performance indicators (KPIs) with engaging charts and graphs for data visualization Ideal for presentations and reports. Generative AI. Decrease statistics illustrations Business Analytics Dashboard Graphs Charts Data Performance Growth Metrics KPI. A modern business analytics dashboard showcasing key performance indicators (KPIs) with engaging charts and graphs for data visualization Ideal for presentations and reports. Generative AI
Free with trial Black and white graph showing a fluctuating trend line with an upward and a downward arrow. Decrease statistics illustrations Black and white graph showing fluctuating trend with up and down arrows chart data. Black and white graph showing a fluctuating trend line with an upward and a downward arrow
Free with trial Worried man holding a red downward pointing arrow represents financial decline or business failure. Flat vector illustration isolated on white background. Decrease statistics illustrations Worried man holding a red downward pointing arrow represents financial decline or business failure
Free with trial A black icon showing two bars of different heights with a downward arrow pointing to the smaller bar. Decrease statistics illustrations Black icon of two bars with a downward arrow pointing to the smaller bar chart. A black icon showing two bars of different heights with a downward arrow pointing to the smaller bar
Free with trial A graph with a curved line labeled "SOFT LANDING" shows a gradual decline on white. Decrease statistics illustrations Graph showing a soft landing curve with text on white background chart decline. A graph with a curved line labeled "SOFT LANDING" shows a gradual decline on white
Free with trial Bar chart with six vertical blue bars of descending height, indicating a negative trend. A jagged red arrow slants downward from left to right across the bars, emphasizing the decrease. No specific location is provided. Decrease statistics vectors Financial bar chart showing downward trend with red arrow. Bar chart with six vertical blue bars of descending height, indicating a negative trend. A jagged red arrow slants downward from left to right across the bars, emphasizing the decrease. No specific location is provided.
Free with trial A black and white illustration features a thermometer, a warning triangle with an exclamation mark, a percentage symbol, and a downward trending arrow. Decrease statistics vectors Warning Sign with Thermometer, Percentage Symbol, and Downward Arrow danger alert. A black and white illustration features a thermometer, a warning triangle with an exclamation mark, a percentage symbol, and a downward trending arrow
Free with trial A 3D bar chart with two red bars and one taller green bar, topped by a percentage symbol in a circle. Decrease statistics illustrations 3d bar chart illustrating percentage growth and decline. A 3D bar chart with two red bars and one taller green bar, topped by a percentage symbol in a circle
Free with trial The chart displays a candlestick pattern where the prices fluctuate over time. Different colors represent price movements and trading activity during sessions. Decrease statistics vectors The chart displays a candlestick pattern where the prices fluctuate over time. Different colors represent price movements and
Free with trial A jagged black line graph shows a steep downward trend ending with an arrow. Clear details and vibrant colors. Decrease statistics illustrations Jagged black line graph trending downwards with arrow on white background line chart. A jagged black line graph shows a steep downward trend ending with an arrow. Clear details and vibrant colors
Free with trial A close-up of paper cutouts, showing a red background and a declining green arrow. Decrease statistics illustrations Red paper with green arrow up. A close-up of paper cutouts, showing a red background and a declining green arrow
Free with trial This vector illustration shows a set of black graph icons with rising and falling charts indicated by arrows showing trends in data with clear simple design and sharp edges calm. Generative AI. Decrease statistics vectors Black graph icons set rising and falling charts with arrows vector illustration simple design. This vector illustration shows a set of black graph icons with rising and falling charts indicated by arrows showing trends in data with clear simple design and sharp edges calm. Generative AI
Free with trial Layered Funnel Chart with Segments in Different Blue Shades. Decrease statistics vectors Layered Funnel Chart with Segments in Different Blue Shades
Free with trial Magnifying glass highlights poor analytics on chart, signed document, and sad emotion. Ideal for business, analytics, decline, review, research productivity failure. Simple flat metaphor. Decrease statistics illustrations Analysis of Declining Trends with Signed Document and Performance Chart. Magnifying glass highlights poor analytics on chart, signed document, and sad emotion. Ideal for business, analytics, decline, review, research productivity failure. Simple flat metaphor
Free with trial Downward graph with red markers, sad face icon, alert envelope, and mobile payment issues. Ideal for finance, declining trends, user frustration, bad news failure loss warning signal. Simple flat. Decrease statistics vectors Declining Graph with Sad Face, Notification Alert, and Mobile Payment Issues. Downward graph with red markers, sad face icon, alert envelope, and mobile payment issues. Ideal for finance, declining trends, user frustration, bad news failure loss warning signal. Simple flat
Free with trial A professional 3D conceptual visualization of a financial market crash or economic recession, featuring a stack of solid gold bullion bars contrasted by a sharp, descending golden arrow pointing downwards on a clean neutral background. Decrease statistics illustrations Financial Market Downturn Concept with Stacked Gold Bullion and Descending Arrow. A professional 3D conceptual visualization of a financial market crash or economic recession, featuring a stack of solid gold bullion bars contrasted by a sharp, descending golden arrow pointing downwards on a clean neutral background
Free with trial An image showcasing four different graphical representations of financial trends using arrows and lines on grid backgrounds. Decrease statistics illustrations Graphical representation of financial trends isolated on transparent background. An image showcasing four different graphical representations of financial trends using arrows and lines on grid backgrounds
Free with trial A 3D cloud icon displays a downward trending graph and falling dollar coins, symbolizing financial decline or loss. Decrease statistics illustrations 3D Cloud Icon with Downward Trend Graph and Falling Dollar Coins finance economy. A 3D cloud icon displays a downward trending graph and falling dollar coins, symbolizing financial decline or loss
Free with trial A black bar graph icon with a downward arrow and trend line indicates a decline. Clear details and vibrant col. Decrease statistics illustrations Black Bar Graph Icon with Downward Arrow and Trend Line on White Background data. A black bar graph icon with a downward arrow and trend line indicates a decline. Clear details and vibrant col
Free with trial Black bars decreasing in height diagonally on a white background, representing a downward trend or decline. Decrease statistics illustrations Black bars decreasing in height diagonally on a white background bar chart graph. Black bars decreasing in height diagonally on a white background, representing a downward trend or decline
Free with trial Declining graph with bar chart and down arrow, vector graphic. Decrease statistics vectors Declining graph with bar chart and down arrow, vector graphic
Free with trial Green bar graph illustrating continuous growth or progress. Decrease statistics illustrations Green bar graph illustrating continuous growth or progress.