Free with trial A black graph displays a downward curving line within a rectangular frame. Clear details and vibrant colors en. Decrease statistics illustrations Black graph showing a downward curve within a frame chart decline. A black graph displays a downward curving line within a rectangular frame. Clear details and vibrant colors en
Free with trial A striking 3D rendered image featuring a bar chart with decreasing red bars and a prominent red downward-pointing arrow, set against a vibrant yellow background. This minimalist visual powerfully symbolizes financial decline, economic recession, business loss, or a negative trend in performance. The clean design effectively conveys concepts of decreasing profits, market downturns, or poor investment outcomes. Ideal for presentations, financial reports, economic analysis, infographics, and articles discussing challenges, risks, or market volatility in business and finance. Decrease statistics illustrations Economic Downturn Bar Chart with Downward Arrow. A striking 3D rendered image featuring a bar chart with decreasing red bars and a prominent red downward-pointing arrow, set against a vibrant yellow background. This minimalist visual powerfully symbolizes financial decline, economic recession, business loss, or a negative trend in performance. The clean design effectively conveys concepts of decreasing profits, market downturns, or poor investment outcomes. Ideal for presentations, financial reports, economic analysis, infographics, and articles discussing challenges, risks, or market volatility in business and finance.
Free with trial Businessman in suit drawing a downward trending graph with the word RISK Clear details and vibrant colors enha. Decrease statistics illustrations Businessman drawing a downward trending graph with the word RISK risk chart. Businessman in suit drawing a downward trending graph with the word RISK Clear details and vibrant colors enha
Free with trial A prominent red arrow pointing downwards, symbolizing a decline or loss, set against a backdrop of a digital stock market chart with various financial figures and graphs. Decrease statistics illustrations Red Arrow Pointing Downwards on Stock Market Chart. A prominent red arrow pointing downwards, symbolizing a decline or loss, set against a backdrop of a digital stock market chart with various financial figures and graphs
Free with trial A vibrant red arrow dramatically points downwards, symbolizing a significant decline or loss, set against a blurred background of financial stock market charts and numbers, all bathed in a red hue. Decrease statistics illustrations Red Arrow Pointing Downwards with Stock Market Chart Background. A vibrant red arrow dramatically points downwards, symbolizing a significant decline or loss, set against a blurred background of financial stock market charts and numbers, all bathed in a red hue
Free with trial A 3D cartoon illustration depicts a hand in a suit pointing a finger downwards towards a bar chart. The chart shows bars of varying heights in green, yellow, orange, and red, with the red bar being the shortest. A red arrow points downwards, indicating a decline. The chart sits on a red and black base, all against a white background. Decrease statistics illustrations Cartoon Hand Pointing Downward Arrow on Declining Bar Chart with Red Base business finance. A 3D cartoon illustration depicts a hand in a suit pointing a finger downwards towards a bar chart. The chart shows bars of varying heights in green, yellow, orange, and red, with the red bar being the shortest. A red arrow points downwards, indicating a decline. The chart sits on a red and black base, all against a white background
Free with trial Line graph with downward trend alongside sad face. Ideal for performance loss, business challenges, failure, analysis, recession, disappointment, frustration. Simple flat metaphor. Decrease statistics vectors Declining Line Graph with Sad Face Representing Negative Trend and Disappointment. Line graph with downward trend alongside sad face. Ideal for performance loss, business challenges, failure, analysis, recession, disappointment, frustration. Simple flat metaphor
Free with trial A 3D rendered image of a bar chart with a downward trend, set against a bright yellow background. The chart features grey frame and orange bars, with a prominent red arrow indicating a decline. This image is suitable for illustrating concepts related to financial loss, market downturn, economic recession, or negative performance in business and investment contexts. Decrease statistics illustrations Downward Trend Chart on Yellow Background. A 3D rendered image of a bar chart with a downward trend, set against a bright yellow background. The chart features grey frame and orange bars, with a prominent red arrow indicating a decline. This image is suitable for illustrating concepts related to financial loss, market downturn, economic recession, or negative performance in business and investment contexts.
Free with trial A businessman interacts with a digital graph showcasing cost reduction through a declining trend. It symbolizes modern financial strategies and data-driven decision-making. XDMCP. Decrease statistics illustrations Businessman Presenting Digital Graph with Cost Reduction Concept, Showing Declining Trend in Expenses with Iconic. A businessman interacts with a digital graph showcasing cost reduction through a declining trend. It symbolizes modern financial strategies and data-driven decision-making. XDMCP
Free with trial A minimalist 3D icon rendered in white is presented against a light gray background. The icon features a square frame with rounded corners, containing a prominent downward-pointing arrow. Below the arrow, two percentage symbols are visible. The overall design suggests concepts of reduction, discount, or a downward trend. Decrease statistics illustrations White 3D icon with a downward arrow and percentage symbols inside a square frame image photo. A minimalist 3D icon rendered in white is presented against a light gray background. The icon features a square frame with rounded corners, containing a prominent downward-pointing arrow. Below the arrow, two percentage symbols are visible. The overall design suggests concepts of reduction, discount, or a downward trend
Free with trial A clean and minimalist black outline icon of a percentage symbol, isolated on a pure white background. This versatile graphic represents discounts, sales, interest rates, financial calculations, and statistical data. Ideal for web design, mobile applications, business presentations, marketing materials, infographics, and educational content. Its simple, modern aesthetic makes it perfect for conveying concepts of proportion, growth, and change in a clear and concise manner. Decrease statistics illustrations Minimalist Percentage Symbol Outline Icon. A clean and minimalist black outline icon of a percentage symbol, isolated on a pure white background. This versatile graphic represents discounts, sales, interest rates, financial calculations, and statistical data. Ideal for web design, mobile applications, business presentations, marketing materials, infographics, and educational content. Its simple, modern aesthetic makes it perfect for conveying concepts of proportion, growth, and change in a clear and concise manner.
Free with trial Sad face alongside a line graph showing downward trends, small airport icon, and flight imagery. Ideal for travel analysis, business performance, economy, transportation, tourism, crisis impact. Decrease statistics illustrations Declining Travel Trends Represented by Graph and Sad Face. Sad face alongside a line graph showing downward trends, small airport icon, and flight imagery. Ideal for travel analysis, business performance, economy, transportation, tourism, crisis impact
Free with trial A black wavy arrow points downwards on a white background Clear details and vibrant colors enhance visual appeal. Decrease statistics illustrations Black wavy downward trending arrow on a white background decline. A black wavy arrow points downwards on a white background Clear details and vibrant colors enhance visual appeal
Free with trial A dynamic image of a digital stock market ticker screen displaying financial data. The background is filled with red, downward-pointing arrows and negative numbers, symbolizing a bearish market, recession, or economic downturn. In stark contrast, a single, large, bright green arrow points upwards, representing growth, success, profit, and recovery. This powerful visual metaphor illustrates a single stock's success or a broader economic turnaround amidst widespread losses. It's perfect for concepts related to investment strategy, financial analysis, market volatility, and economic hope. Decrease statistics illustrations Stock Market Recovery and Growth Concept. A dynamic image of a digital stock market ticker screen displaying financial data. The background is filled with red, downward-pointing arrows and negative numbers, symbolizing a bearish market, recession, or economic downturn. In stark contrast, a single, large, bright green arrow points upwards, representing growth, success, profit, and recovery. This powerful visual metaphor illustrates a single stock's success or a broader economic turnaround amidst widespread losses. It's perfect for concepts related to investment strategy, financial analysis, market volatility, and economic hope.
Free with trial This image features a clear financial chart on a plain white background, illustrating a significant downward trend. A bold red line with an arrow points sharply downwards, symbolizing decline, loss, or a crisis. A grey line, possibly representing historical data or another metric, also shows a general downward movement. This visual effectively conveys concepts of economic recession, market crash, poor business performance, or financial distress. It's ideal for presentations, reports, news articles, or any content discussing negative economic indicators, investment risks, or strategic challenges. Decrease statistics vectors Financial Chart Illustrating Economic Decline and Market Downturn. This image features a clear financial chart on a plain white background, illustrating a significant downward trend. A bold red line with an arrow points sharply downwards, symbolizing decline, loss, or a crisis. A grey line, possibly representing historical data or another metric, also shows a general downward movement. This visual effectively conveys concepts of economic recession, market crash, poor business performance, or financial distress. It's ideal for presentations, reports, news articles, or any content discussing negative economic indicators, investment risks, or strategic challenges.
Free with trial Arrow Direction and Percentage Icons for Business Growth Concept. Decrease statistics illustrations Arrow Direction and Percentage Icons for Business Growth Concept
Free with trial A 3D rendered icon depicting a blue document with a raised bar graph. The bar graph features alternating blue, orange, and yellow bars of varying heights. White lines and a circular orange and white element are also present on the blue document surface. The icon is isolated on a white background. Decrease statistics vectors 3 D blue document icon with orange and blue bar graph and white lines image. A 3D rendered icon depicting a blue document with a raised bar graph. The bar graph features alternating blue, orange, and yellow bars of varying heights. White lines and a circular orange and white element are also present on the blue document surface. The icon is isolated on a white background
Free with trial A clean, white three-dimensional percentage symbol stands prominently against a pure white background. The symbol is rendered with smooth surfaces and clear edges, casting a subtle shadow beneath it. The design is simple and iconic, representing concepts of proportion or discount. Decrease statistics illustrations White 3D Percentage Symbol on White Background sign number. A clean, white three-dimensional percentage symbol stands prominently against a pure white background. The symbol is rendered with smooth surfaces and clear edges, casting a subtle shadow beneath it. The design is simple and iconic, representing concepts of proportion or discount
Free with trial A 3D rendered red bar chart and line graph show a downward trend against a white grid background. The graph reflects a decline with a red arrow pointing down. Decrease statistics illustrations Red downward trending bar chart and line graph on white grid image. A 3D rendered red bar chart and line graph show a downward trend against a white grid background. The graph reflects a decline with a red arrow pointing down
Free with trial Blue bar chart with a black arrow bouncing backward vector illustration. Economic recession, financial loss, market crash, business failure, negative growth, setback. Data graph with falling pointer. Decrease statistics vectors Financial bar chart with a bouncing arrow pointing down economic recession and market loss vector illustration. Blue bar chart with a black arrow bouncing backward vector illustration. Economic recession, financial loss, market crash, business failure, negative growth, setback. Data graph with falling pointer
Free with trial A person in a suit holding a magnifying glass showing blue upward and red downward percentage arrows. Decrease statistics illustrations Person holding magnifying glass with percentage arrows hand blue. A person in a suit holding a magnifying glass showing blue upward and red downward percentage arrows.
Free with trial Black and white icon of a bar graph with a diagonal arrow indicating a sharp decline. Decrease statistics illustrations Falling bar graph with diagonal arrow showing sharp decline bar chart. Black and white icon of a bar graph with a diagonal arrow indicating a sharp decline
Free with trial A black icon representing a bar chart with bars decreasing in height Clear details and vibrant colors enhance. Decrease statistics illustrations Black descending bar chart icon on white background graph decline. A black icon representing a bar chart with bars decreasing in height Clear details and vibrant colors enhance
Free with trial Businessman with downward graph indicating financial decline, recession, and negative growth. Ideal for economic analysis, loss reporting, and business downturn visuals. Decrease statistics vectors Business decline graph with downward arrow showing financial loss recession and negative growth concept. Businessman with downward graph indicating financial decline, recession, and negative growth. Ideal for economic analysis, loss reporting, and business downturn visuals
Free with trial This image depicts a bar graph on an easel showing a clear downward trend. The bars are blue, and a large red arrow points downward, indicating a decline. Decrease statistics illustrations Decline in data represented by a descending bar graph on an easel. This image depicts a bar graph on an easel showing a clear downward trend. The bars are blue, and a large red arrow points downward, indicating a decline
Free with trial Two sets of pastel blocks create miniature pyramidal formations, resembling charts or landscapes. The soft colors and clean lines give a modern, minimalist aesthetic. Decrease statistics illustrations Pastel pyramids rising and falling in an artistic, geometric display. Two sets of pastel blocks create miniature pyramidal formations, resembling charts or landscapes. The soft colors and clean lines give a modern, minimalist aesthetic.
Free with trial A seamless pattern of shiny golden percentage (%) symbols arranged in a grid on a light, gradient background. The 3D rendered symbols have a metallic sheen and cast subtle shadows, creating a sense of depth and luxury. This abstract background is ideal for financial, marketing, or sale-related themes, conveying concepts of discounts, interest rates, or economic growth. Decrease statistics illustrations Golden Percentage Symbols Pattern Background. A seamless pattern of shiny golden percentage (%) symbols arranged in a grid on a light, gradient background. The 3D rendered symbols have a metallic sheen and cast subtle shadows, creating a sense of depth and luxury. This abstract background is ideal for financial, marketing, or sale-related themes, conveying concepts of discounts, interest rates, or economic growth.
Free with trial Vibrant 3D red bar chart illustrating declining growth trends for business analytics, finance reports, and data visualization projects. Decrease statistics vectors 3D red bar chart decreasing growth business data analysis concept. Vibrant 3D red bar chart illustrating declining growth trends for business analytics, finance reports, and data visualization projects
Free with trial Black line graph showing upward and downward trends with arrows on a white background. Decrease statistics illustrations Black line graph with upward and downward trends and arrows chart data. Black line graph showing upward and downward trends with arrows on a white background
Free with trial A striking 3D rendering depicts a significant financial market decline, symbolized by a bold red arrow sharply pointing downwards across a dark grey background. The scene includes a subtle line graph and bar charts in shades of red and grey, illustrating a negative trend in data. This image effectively conveys concepts of economic recession, stock market crash, business losses, and financial crisis. Ideal for articles, presentations, and reports discussing market downturns, investment risks, or economic challenges. Decrease statistics illustrations Financial Market Decline with Red Arrow Chart. A striking 3D rendering depicts a significant financial market decline, symbolized by a bold red arrow sharply pointing downwards across a dark grey background. The scene includes a subtle line graph and bar charts in shades of red and grey, illustrating a negative trend in data. This image effectively conveys concepts of economic recession, stock market crash, business losses, and financial crisis. Ideal for articles, presentations, and reports discussing market downturns, investment risks, or economic challenges.
Free with trial Bar chart representation of data increase growth and finance. Data analysis. Decrease statistics vectors Bar chart representation of data increase growth and finance. Data analysis
Free with trial 3d blue magnifying glass with downward-trending chart inside Financial analysis, economic decline, risk assessment, market monitoring, investment evaluation concept Low poly digital futuristic Vector. Decrease statistics vectors 3d blue magnifying glass with downward-trending chart inside Financial analysis, economic decline, risk assessment
Free with trial A flat depicting two distinct financial charts against a white background. The left chart a bar graph with bars in shades of green and blue, topped by a jagged blue line graph ascending towards a green percentage symbol and an upward arrow. The right chart a bar graph with bars in yellow, orange, and red, with a red line graph descending from a yellow dollar sign. Decrease statistics illustrations Upward and downward financial charts with percentage and dollar symbols. A flat depicting two distinct financial charts against a white background. The left chart a bar graph with bars in shades of green and blue, topped by a jagged blue line graph ascending towards a green percentage symbol and an upward arrow. The right chart a bar graph with bars in yellow, orange, and red, with a red line graph descending from a yellow dollar sign
Free with trial Two distinct bar charts are depicted against a white background. The left chart a downward trend with bars in blue, yellow, and purple, accompanied by a yellow coin with a dollar sign and an arrow pointing down towards it from a small graph indicating a rising trend. The right chart an upward trend with bars in red, green, and blue, and a green coin with a dollar sign connected to a circle with a. Decrease statistics illustrations Bar charts showing financial growth and decline with dollar symbols. Two distinct bar charts are depicted against a white background. The left chart a downward trend with bars in blue, yellow, and purple, accompanied by a yellow coin with a dollar sign and an arrow pointing down towards it from a small graph indicating a rising trend. The right chart an upward trend with bars in red, green, and blue, and a green coin with a dollar sign connected to a circle with a
Free with trial Four simple bar chart are displayed against a white background. Two are solid black, one showing an upward trend with an arrow, and the other a downward trend with an arrow. The remaining two. Decrease statistics vectors Four bar chart showing upward and downward trends graph. Four simple bar chart are displayed against a white background. Two are solid black, one showing an upward trend with an arrow, and the other a downward trend with an arrow. The remaining two
Free with trial A dynamic, futuristic digital display showing a falling stock market chart. This detailed financial graph features glowing red candlestick patterns and line charts indicating a significant downward trend and high volatility. The image represents concepts like an economic crisis, bear market, financial recession, investment risk, and a stock market crash. It's an ideal visual for business reports, financial news, technology articles, and presentations on global economics, trading, or fintech, conveying a sense of urgency and downturn. Decrease statistics illustrations Stock Market Crash and Financial Downturn Graph. A dynamic, futuristic digital display showing a falling stock market chart. This detailed financial graph features glowing red candlestick patterns and line charts indicating a significant downward trend and high volatility. The image represents concepts like an economic crisis, bear market, financial recession, investment risk, and a stock market crash. It's an ideal visual for business reports, financial news, technology articles, and presentations on global economics, trading, or fintech, conveying a sense of urgency and downturn.
Free with trial A 3D rendered candlestick stock market chart displays a downward trend. Green bars, indicating upward movement, are followed by red bars, signifying a decline. The chart is angled diagonally across a white background, with a subtle shadow cast beneath it, emphasizing the concept of financial loss or market downturn. Decrease statistics illustrations Downward Trending Stock Market Candlestick Chart with Red and Green Bars on a White Background. A 3D rendered candlestick stock market chart displays a downward trend. Green bars, indicating upward movement, are followed by red bars, signifying a decline. The chart is angled diagonally across a white background, with a subtle shadow cast beneath it, emphasizing the concept of financial loss or market downturn
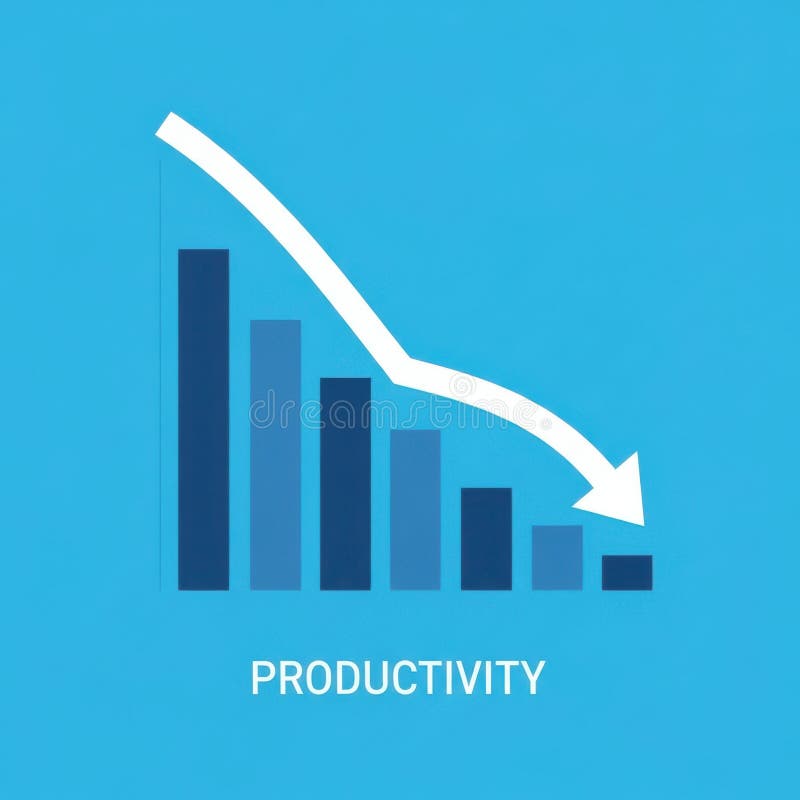
Free with trial A bar graph visually represents a downward trend in productivity over time, indicating a decline in efficiency or output. Decrease statistics illustrations Decreasing Productivity Graph Showing Decline. A bar graph visually represents a downward trend in productivity over time, indicating a decline in efficiency or output
Free with trial This graphic illustration depicts a stark representation of declining business performance. It features a bar chart with three colorful bars (yellow, orange, green) suggesting varying data points, overlaid with three distinct lines in yellow, blue, and orange, all sharply descending downwards. A prominent red arrow points downwards, emphasizing the negative trend. A small yellow plus sign is also visible, potentially signifying a point of reference or a contrasting element. The clean white background isolates the graphical elements, making them ideal for conveying concepts of loss, recession, or negative growth. Decrease statistics illustrations Declining Business Graph with Downward Arrows. This graphic illustration depicts a stark representation of declining business performance. It features a bar chart with three colorful bars (yellow, orange, green) suggesting varying data points, overlaid with three distinct lines in yellow, blue, and orange, all sharply descending downwards. A prominent red arrow points downwards, emphasizing the negative trend. A small yellow plus sign is also visible, potentially signifying a point of reference or a contrasting element. The clean white background isolates the graphical elements, making them ideal for conveying concepts of loss, recession, or negative growth.
Free with trial A sophisticated 3D rendered bar graph composed of multiple vertical blue glass bars arranged in a line with varying heights, where the tallest bar appears at the bottom right side and the shortest bars are positioned at the top left, creating a visually striking data visualization against a clean white background that emphasizes the transparent glass-like material and realistic lighting effects. Decrease statistics illustrations 3D rendered blue glass bar graph showing data visualization with vertical columns of varying heights on white background. A sophisticated 3D rendered bar graph composed of multiple vertical blue glass bars arranged in a line with varying heights, where the tallest bar appears at the bottom right side and the shortest bars are positioned at the top left, creating a visually striking data visualization against a clean white background that emphasizes the transparent glass-like material and realistic lighting effects
Free with trial Two bar graphs, one green showing growth and one red showing decline, with trend lines indicating opposite directions. Decrease statistics illustrations Bar graphs showing upward and downward trends. Two bar graphs, one green showing growth and one red showing decline, with trend lines indicating opposite directions
Free with trial This image features three bold, three-dimensional arrows pointing sharply downward, each rendered in distinct vibrant colors�'blue, yellow, and red�'symbolizing a significant market downturn, financial loss, or economic decline, set against a clean, minimalist white background that enhances their striking visual impact and conveys urgency and negative momentum in business, trading, or investment. Decrease statistics illustrations Colorful downward trending financial arrows in blue yellow and red illustrating market decline and economic downturn concepts. This image features three bold, three-dimensional arrows pointing sharply downward, each rendered in distinct vibrant colors�'blue, yellow, and red�'symbolizing a significant market downturn, financial loss, or economic decline, set against a clean, minimalist white background that enhances their striking visual impact and conveys urgency and negative momentum in business, trading, or investment
Free with trial Vibrant candlestick patterns and descending trend lines illustrate a market downturn, highlighting analysis tools amid a somber financial atmosphere. Decrease statistics illustrations Stock market decline with colorful candlestick charts and trend lines. Vibrant candlestick patterns and descending trend lines illustrate a market downturn, highlighting analysis tools amid a somber financial atmosphere
Free with trial Inflation pictogram group. Set of growth and fall signs, income and profit signs. Dollar sign. Charts, notifications, messages. Decrease statistics vectors Inflation pictogram group. Set of growth and fall signs, income and profit signs. Dollar sign. Charts, notifications, messages.
Free with trial A vibrant red arrow graph sharply declining against a dark, textured background, symbolizing a significant financial downturn or economic crisis. Decrease statistics illustrations Red downward arrow graph on dark background showing financial crisis. A vibrant red arrow graph sharply declining against a dark, textured background, symbolizing a significant financial downturn or economic crisis
Free with trial Businessman presenting falling chart indicating financial decline and loss. Ideal for analytics, reporting, and economic downturn presentations. Decrease statistics vectors Business decline presentation with downward chart representing financial loss analysis and negative growth. Businessman presenting falling chart indicating financial decline and loss. Ideal for analytics, reporting, and economic downturn presentations
Free with trial Failed investor tries to avoid bankruptcy during financial crisis, and pulls economic chart up. Male investor panics due to start of recession and falling prices for stocks and government bonds. Decrease statistics vectors Failed investor tries to avoid bankruptcy during financial crisis, and pulls economic chart up
Free with trial A professional hand gesture overlays a dynamic financial graph, representing market trends and data analysis essential for effective investment strategies. Scalp. Decrease statistics illustrations Professional Hand Gesture Over Financial Graph Displaying Market Trends and Data Analysis for Investment and Trading. A professional hand gesture overlays a dynamic financial graph, representing market trends and data analysis essential for effective investment strategies. Scalp
Free with trial 3d illustration of red decreasing graph on stand, financial presentation representing negative results or economic downturn. Decrease statistics vectors 3d illustration of red decreasing graph on stand, financial presentation representing negative results
Free with trial A black upward arrow merges into a downward curving line graph on a white background. Decrease statistics illustrations Black upward arrow and downward curve graph on white background chart. A black upward arrow merges into a downward curving line graph on a white background
Free with trial Line art icon featuring a magnifying glass positioned over a vertical bar chart. The design is simple and minimalistic, using grey lines. The bar chart consists of three bars of varying heights, and the magnifying glass is centered over the middle bar, suggesting examination or analysis of data. This icon is likely used to symbolize data analysis, inspection, or detailed observation in a graphical representation. Decrease statistics vectors Line art icon of magnifying glass over bar chart. Line art icon featuring a magnifying glass positioned over a vertical bar chart. The design is simple and minimalistic, using grey lines. The bar chart consists of three bars of varying heights, and the magnifying glass is centered over the middle bar, suggesting examination or analysis of data. This icon is likely used to symbolize data analysis, inspection, or detailed observation in a graphical representation.
Free with trial A green line graph illustrating data points over time, with the y-axis labeled 'Value' and the x-axis labeled 'Time', showcasing significant ups and downs in the data. Decrease statistics illustrations Line graph showing fluctuating values over time. A green line graph illustrating data points over time, with the y-axis labeled 'Value' and the x-axis labeled 'Time', showcasing significant ups and downs in the data
Free with trial A clean and modern graphic featuring the number '5%' prominently displayed on a soft, golden gradient background. A bright, circular spotlight effect emanates from the right side, creating a sense of illumination and focus. This versatile image is ideal for representing discounts, sales, special offers, promotions, or any concept related to a five percent value. The minimalist design and ample negative space make it perfect for adding text overlays or integrating into various marketing materials. Decrease statistics illustrations Five Percent Discount - Clean Gradient Background with Spotlight Effect. A clean and modern graphic featuring the number '5%' prominently displayed on a soft, golden gradient background. A bright, circular spotlight effect emanates from the right side, creating a sense of illumination and focus. This versatile image is ideal for representing discounts, sales, special offers, promotions, or any concept related to a five percent value. The minimalist design and ample negative space make it perfect for adding text overlays or integrating into various marketing materials.
Free with trial An isometric 3D bar chart with four descending bars, made of a clear glass with a modern, holographic, and iridescent finish in pink and blue. Concept of financial decline or decreasing data trends. Decrease statistics vectors Isometric Bar Chart Showing Decline with Iridescent Bars. An isometric 3D bar chart with four descending bars, made of a clear glass with a modern, holographic, and iridescent finish in pink and blue. Concept of financial decline or decreasing data trends
Free with trial Two translucent blue glass arrows are positioned against a white background. One arrow points upwards, and the other points downwards, symbolizing direction, change, or opposing forces. The arrows have a glossy, reflective surface, giving them a modern and digital appearance. Decrease statistics illustrations Two Blue Glass Arrows Pointing Up and Down on a White Background up arrow down arrow. Two translucent blue glass arrows are positioned against a white background. One arrow points upwards, and the other points downwards, symbolizing direction, change, or opposing forces. The arrows have a glossy, reflective surface, giving them a modern and digital appearance
Free with trial This vector illustration set features six distinct icons representing key financial and economic concepts. It includes bar charts depicting growth with a green arrow and decline with a red arrow, alongside currency exchange rate indicators for USD, INR, and EUR. Two donut charts visualize data distribution, while a world map colored green and red signifies global market trends or segmentation. Ideal for business presentations, financial reports, economic analysis, and investment-related content, these versatile graphics convey complex data clearly and concisely. Decrease statistics vectors Financial Growth, Decline, and Global Market Data Visualization Icons Set. This vector illustration set features six distinct icons representing key financial and economic concepts. It includes bar charts depicting growth with a green arrow and decline with a red arrow, alongside currency exchange rate indicators for USD, INR, and EUR. Two donut charts visualize data distribution, while a world map colored green and red signifies global market trends or segmentation. Ideal for business presentations, financial reports, economic analysis, and investment-related content, these versatile graphics convey complex data clearly and concisely.
Free with trial A hand interacts with vibrant financial charts, showcasing data trends through modern technology and digital interfaces, ideal for conveying analytics and growth. Scalp. Decrease statistics illustrations Hand Interacting with Financial Growth Chart Displaying Data Trends and Indicators Through Interactive Technology and. A hand interacts with vibrant financial. A hand interacts with vibrant financial charts, showcasing data trends through modern technology and digital interfaces, ideal for conveying analytics and growth. Scalp
Free with trial A stark red arrow dramatically descends across a series of blue bars, illustrating a significant downward trend. Decrease statistics illustrations Red arrow shows sharp decline on blue bar graph. A stark red arrow dramatically descends across a series of blue bars, illustrating a significant downward trend
Free with trial Combining love growth and decline charts, symbolizing relationship ups and downs. Perfect for dating, counseling, and emotional data visualization projects. Decrease statistics vectors Combining love growth and decline charts, symbolizing relationship ups and downs. Perfect for dating, counseling, and emotional
Free with trial Black and white line graph comparing nominal and real return over time with axes labeled. Decrease statistics illustrations Black and white line graph showing nominal and real return over time chart nominal return. Black and white line graph comparing nominal and real return over time with axes labeled
Free with trial A black line graph icon showing a downward trend with an arrow pointing down on a white background. Decrease statistics illustrations Downward Trend Graph Icon with Arrow on White Background chart decline. A black line graph icon showing a downward trend with an arrow pointing down on a white background
Free with trial Three black rectangular bars of decreasing height arranged horizontally on a white background. Decrease statistics illustrations Three Descending Black Bar Chart Blocks on White Background graph data. Three black rectangular bars of decreasing height arranged horizontally on a white background
Free with trial Black icon of a fluctuating graph with a downward trend arrow on a white background. Decrease statistics illustrations Black icon of a fluctuating graph with downward trend arrow chart data. Black icon of a fluctuating graph with a downward trend arrow on a white background
Free with trial Black and red arrow pointing downward on financial graph showing a decline. Business growth chart with falling trend line for investment analysis. Decrease statistics illustrations Black and red arrow pointing downward on financial graph showing a decline
Free with trial This abstract image features a vibrant candlestick chart, common in financial trading visualizations. The chart is overlaid on a blurred background of colorful circles, adding to its abstract aesthetic. Below the chart are vertical bars of varying heights and colors. This image was generated by AI. Decrease statistics illustrations Candlestick Chart Abstract. This abstract image features a vibrant candlestick chart, common in financial trading visualizations. The chart is overlaid on a blurred background of colorful circles, adding to its abstract aesthetic. Below the chart are vertical bars of varying heights and colors. This image was generated by AI.
Free with trial A 3D rendered bar chart with bars in red, yellow, green, and blue, arranged in descending order of height. A thick black arrow curves downwards from the top left, crossing over the bars and pointing towards the bottom right, indicating a downward trend or decline. The image is set against a clean, white background. Decrease statistics illustrations Colorful Bar Chart Showing Downward Trend with Black Arrow on White Background graph. A 3D rendered bar chart with bars in red, yellow, green, and blue, arranged in descending order of height. A thick black arrow curves downwards from the top left, crossing over the bars and pointing towards the bottom right, indicating a downward trend or decline. The image is set against a clean, white background
Free with trial Analyze the crash in the stock market crash. Learn from investment failure mistakes. Assess the damage from the business sector. Experts find the cause of the stock chart fall. Decrease statistics vectors Analyze the crash in the stock market crash. Learn from investment failure mistakes. Assess the damage from the business
Free with trial A stark red arrow graphically depicts a significant downward trend on a white chart, symbolizing financial loss or market crash. Decrease statistics illustrations Red arrow graph showing sharp financial decline. A stark red arrow graphically depicts a significant downward trend on a white chart, symbolizing financial loss or market crash
Free with trial Dynamic teal graph visually represents financial data. Professional design elements provide an ideal visual for business reports and presentations , dreamy concept. Decrease statistics illustrations Abstract Digital Financial Graph with Teal Data. Dynamic teal graph visually represents financial data. Professional design elements provide an ideal visual for business reports and presentations , dreamy concept
Free with trial A digital illustration on a black background features a world map rendered in shades of pink and purple with Data Doomsday text above it, divided into sections representing different data levels and centered by a line graph tracking data progression from 2000 to 2100 with green lines showing pre-industrial and contemporary data trends arranged vertically with a legend explaining each metric. Decrease statistics illustrations Data doomsday digital illustration showing world map with pink purple color scheme and line graph tracking data levels from 2000. A digital illustration on a black background features a world map rendered in shades of pink and purple with Data Doomsday text above it, divided into sections representing different data levels and centered by a line graph tracking data progression from 2000 to 2100 with green lines showing pre-industrial and contemporary data trends arranged vertically with a legend explaining each metric
Free with trial Black icon illustrating a downward sloping graph with an arrow indicating decline on a white background. Decrease statistics illustrations Black icon showing a downward sloping graph with an arrow chart decline. Black icon illustrating a downward sloping graph with an arrow indicating decline on a white background
Free with trial Black bar graph with downward arrows indicating a decline or loss on a white background. Decrease statistics illustrations Falling bar graph with downward arrows indicating decline or loss chart. Black bar graph with downward arrows indicating a decline or loss on a white background
Free with trial Volatility of financial market pleases or upsets man standing near chart with sharp fluctuations. Problems of volatility in trading and influence of emotional background on investor. Decrease statistics vectors Volatility of financial market pleases or upsets man standing near chart with sharp fluctuations
Free with trial A close-up view of black financial and business chart icons arranged in a grid on a light background. Decrease statistics illustrations Close-up of financial and business chart icons on a grid finance charts. A close-up view of black financial and business chart icons arranged in a grid on a light background
Free with trial A bright red, glossy 3D rendering of the number 2 stands next to a percent symbol. The objects are positioned on a clean white surface with a subtle gradient background, creating a sense of depth and focus on the numerical elements. This image is suitable for concepts related to finance, sales, or discounts. Decrease statistics illustrations Red 3D Number 2 and Percent Symbol on White Background 2 percent two percent. A bright red, glossy 3D rendering of the number 2 stands next to a percent symbol. The objects are positioned on a clean white surface with a subtle gradient background, creating a sense of depth and focus on the numerical elements. This image is suitable for concepts related to finance, sales, or discounts
Free with trial Displaying purple world map with rising red bars, red line graph on slide with green grid. Infographic, analytics, digital, technology, finance, strategic, modern. Decrease statistics illustrations Displaying purple world map with rising red bars, red line graph on slide with green grid
Free with trial Conceptual Image of Cost Analysis with Hands Reaching Out to Digital Graphs and Icons Representing Business Strategy and Financial Planning Quark. Decrease statistics illustrations Conceptual Image of Cost Analysis with Hands Reaching Out to Digital Graphs and Icons Representing Business Strategy and
Free with trial Black icon of a falling graph with a downward arrow on a white background. Clear details and vibrant colors en. Decrease statistics illustrations Falling Graph with Downward Arrow Icon on White Background downward trend decline. Black icon of a falling graph with a downward arrow on a white background. Clear details and vibrant colors en
Free with trial A black and white line illustration depicts a bar chart with bars of decreasing height from left to right. A thick, angular arrow points downwards across the chart, indicating a negative trend. To the upper right of the arrow, a circle contains a dollar sign, representing currency. The overall composition suggests a financial downturn or loss. Decrease statistics vectors Bar chart with downward trend arrow and dollar coin. A black and white line illustration depicts a bar chart with bars of decreasing height from left to right. A thick, angular arrow points downwards across the chart, indicating a negative trend. To the upper right of the arrow, a circle contains a dollar sign, representing currency. The overall composition suggests a financial downturn or loss
Free with trial Green up and red down 3d arrow graph showing rising, descending trend, business result, profit or loss symbol symbol. Business arrow, goals concept. 3d world money symbols. Financial growth vector isolated. Decrease statistics vectors Green up and red down 3d arrow graph showing rising, descending trend, business result, profit. world money symbols. Green up and red down 3d arrow graph showing rising, descending trend, business result, profit or loss symbol symbol. Business arrow, goals concept. 3d world money symbols. Financial growth vector isolated