Free with trial Pyramid chart line icon. Neumorphic, Flat shadow, 3d buttons. Analytics graph sign. Market analytics symbol. Line pyramid chart icon. Social media icons. Vector. Decrease statistics vectors Pyramid chart line icon. Analytics graph sign. Neumorphic buttons. Vector. Pyramid chart line icon. Neumorphic, Flat shadow, 3d buttons. Analytics graph sign. Market analytics symbol. Line pyramid chart icon. Social media icons. Vector
Free with trial A 3D illustration of a statistic down icon isolated on a white background symbolizing decline in data or business performance. Decrease statistics illustrations Statistic down 3D illustration. A 3D illustration of a statistic down icon isolated on a white background symbolizing decline in data or business performance
Free with trial A clean, minimalist 3D render depicts a series of white arrows of varying heights arranged in a graph-like formation. The tallest arrows, on the left, are illuminated with a warm, orange glow, symbolizing growth, success, and positive trends. The arrows decrease in size towards the right, suggesting a progression or trend line. The reflective surface and bright, airy background create a modern and optimistic feel, ideal for business, finance, and technology-related concepts. Decrease statistics illustrations Rising Arrows Graph. A clean, minimalist 3D render depicts a series of white arrows of varying heights arranged in a graph-like formation. The tallest arrows, on the left, are illuminated with a warm, orange glow, symbolizing growth, success, and positive trends. The arrows decrease in size towards the right, suggesting a progression or trend line. The reflective surface and bright, airy background create a modern and optimistic feel, ideal for business, finance, and technology-related concepts.
Free with trial Hand-drawn financial charts, graphs, and calculators perfect for business, finance, and accounting illustrations. These vector illustrations depict various tools used for data analysis and financial calculations. Decrease statistics vectors Collection of Hand Drawn Financial Charts and Calculators. Hand-drawn financial charts, graphs, and calculators perfect for business, finance, and accounting illustrations. These vector illustrations depict various tools used for data analysis and financial calculations.
Free with trial Diagram chart line icon. Neumorphic, Flat shadow, 3d buttons. Column 3d graph sign. Market analytics symbol. Line 3d chart icon. Social media icons. Vector. Decrease statistics vectors Diagram chart line icon. Column 3d graph sign. Neumorphic buttons. Vector. Diagram chart line icon. Neumorphic, Flat shadow, 3d buttons. Column 3d graph sign. Market analytics symbol. Line 3d chart icon. Social media icons. Vector
Free with trial A neon glowing graph with blue bars and pink zigzag arrow showing fluctuating growth on black background. Generative AI. Decrease statistics illustrations Neon glowing graph with blue bars and pink zigzag arrow showing fluctuating growth on black background
Free with trial Graphic element displays contrasting financial indicators featuring a jagged green arrow pointing up signifying growth alongside a similar red arrow pointing sharply down representing decline or market correction. Decrease statistics vectors Graphic representation contrasting upward trending market growth with sharp downward trending financial decline. Graphic element displays contrasting financial indicators featuring a jagged green arrow pointing up signifying growth alongside a similar red arrow pointing sharply down representing decline or market correction
Free with trial A visual representation of financial losses or declining market trends, ideal for economic reports and business analysis presentations. Decrease statistics illustrations Bar chart showing a significant decline, emphasized by a red arrow pointing downwards and a magnifying glass. A visual representation of financial losses or declining market trends, ideal for economic reports and business analysis presentations
Free with trial This image features two minimalist icons representing financial or data trends. The left icon is a white line graph with circular data points and directional arrows, set against a solid black shield shape. The right icon presents the same line graph and data points within a black outline of a shield, on a white background. Both icons depict fluctuating data, with one showing a downward trend and the other an upward trend, symbolizing market volatility, analysis, and security. Decrease statistics illustrations Line Graph Icon with Shield Symbol - Upward and Downward Trends. This image features two minimalist icons representing financial or data trends. The left icon is a white line graph with circular data points and directional arrows, set against a solid black shield shape. The right icon presents the same line graph and data points within a black outline of a shield, on a white background. Both icons depict fluctuating data, with one showing a downward trend and the other an upward trend, symbolizing market volatility, analysis, and security.
Free with trial The image shows a visual representation of a downward trend using a bar chart and a bold red arrow pointing downward. The chart is displayed on a light-colored easel with a small figure standing behind it, suggesting a presentation or analysis of decreasing values over time, possibly in a business or financial context. Decrease statistics illustrations Declining trend illustrated with bar chart and arrow on easel. The image shows a visual representation of a downward trend using a bar chart and a bold red arrow. The image shows a visual representation of a downward trend using a bar chart and a bold red arrow pointing downward. The chart is displayed on a light-colored easel with a small figure standing behind it, suggesting a presentation or analysis of decreasing values over time, possibly in a business or financial context
Free with trial Falling bar chart with up and right arrows illustrating declining business trends. Decrease statistics vectors Falling bar chart with up and right arrows illustrating declining business trends
Free with trial Bar chart collapse icon with downward arrow. Decline and negative trend sign symbol vector. Decrease statistics vectors Bar chart collapse icon with downward arrow. Decline and negative trend sign symbol
Free with trial Downward trend graph with large sad face and woman in casual attire. Ideal for business performance, feedback, failure, regret, decisions, emotions, analytics. Clean simple flat metaphor. Decrease statistics vectors Declining Trend Graph with Sad Face and Casual Woman Highlighting Failure or Negative Feedback. Downward trend graph with large sad face and woman in casual attire. Ideal for business performance, feedback, failure, regret, decisions, emotions, analytics. Clean simple flat metaphor
Free with trial A stark red arrow zigzags downwards, powerfully representing economic downturns, market crashes, and negative financial trends. This visual signifies a crisis or significant drop. Decrease statistics illustrations Red downward arrow symbolizing financial decline and economic recession trends. A stark red arrow zigzags downwards, powerfully representing economic downturns, market crashes, and negative financial trends. This visual signifies a crisis or significant drop
Free with trial A vibrant image featuring a thick, textured green arrow pointing upwards, symbolizing growth, success, and progress. Contrasting this, a bold red arrow points downwards, representing decline, loss, and failure. Both arrows are rendered with a painterly style, suggesting a hand-drawn or artistic representation of financial or market trends. The clean white background isolates the arrows, emphasizing their symbolic meaning. This visual is ideal for illustrating concepts like stock market fluctuations, business performance, positive and negative trends, or decision-making. Decrease statistics illustrations Up and Down Arrows: Growth vs. Decline. A vibrant image featuring a thick, textured green arrow pointing upwards, symbolizing growth, success, and progress. Contrasting this, a bold red arrow points downwards, representing decline, loss, and failure. Both arrows are rendered with a painterly style, suggesting a hand-drawn or artistic representation of financial or market trends. The clean white background isolates the arrows, emphasizing their symbolic meaning. This visual is ideal for illustrating concepts like stock market fluctuations, business performance, positive and negative trends, or decision-making.
Free with trial A dynamic red jagged arrow plunges downward, visually representing a sharp decline, economic downturn, or negative trend in business and finance. Ideal for charting losses or market drops. Decrease statistics illustrations Red jagged arrow pointing down symbolizing financial decline or negative trend. A dynamic red jagged arrow plunges downward, visually representing a sharp decline, economic downturn, or negative trend in business and finance. Ideal for charting losses or market drops
Free with trial Collection of various red infographic elements including charts, graphs, diagrams, and symbols, perfect for presentations and data visualization. Ideal for showcasing data trends, progress, and comparisons. Easily customizable and adaptable to diverse projects. Decrease statistics illustrations Red Infographic Elements
Free with trial A graph shows a downward trend. Green bars diminish in height along a timeline. A red arrow underscores the downward movement of the data on the timeline. Decrease statistics illustrations Decreasing graph showing green bars plunging downward with a red arrow indication. A graph shows a downward trend. Green bars diminish in height along a timeline. A red arrow underscores the downward movement of the data on the timeline
Free with trial This vibrant 3D bar chart illustrates strong business growth and upward progress. The colorful, glossy bars represent data points, clearly showing an increase. Ideal for presentations and reports. Decrease statistics illustrations Colorful 3D Bar Chart Showing Business Growth and Progress. This vibrant 3D bar chart illustrates strong business growth and upward progress. The colorful, glossy bars represent data points, clearly showing an increase. Ideal for presentations and reports.
Free with trial A collection of black and white icons representing financial concepts such as growth charts, decline arrows, and money symbols, all presented clearly on a plain white background for easy integration i. Decrease statistics vectors Financial growth and decline icons isolated on transparent background. A collection of black and white icons representing financial concepts such as growth charts, decline arrows, and money symbols, all presented clearly on a plain white background for easy integration i
Free with trial Stacks of gold and silver coins in front of a blurred background with a financial graph and percentages. Decrease statistics illustrations Stacks of coins and financial graph with percentages in background finance money. Stacks of gold and silver coins in front of a blurred background with a financial graph and percentages
Free with trial A minimalist cartoon-style illustration on a white background depicts a green horseshoe-shaped symbol on the left with two arrows pointing toward it, one green arrow entering from the left and a larger red arrow exiting to the right, pointing downward to signify a decreasing trend in cancer diagnoses, while a second red arrow points upward, creating a contrast that visually communicates changing. Decrease statistics illustrations Cancer diagnosis decline concept with arrows and horseshoe shape. A minimalist cartoon-style illustration on a white background depicts a green horseshoe-shaped symbol on the left with two arrows pointing toward it, one green arrow entering from the left and a larger red arrow exiting to the right, pointing downward to signify a decreasing trend in cancer diagnoses, while a second red arrow points upward, creating a contrast that visually communicates changing
Free with trial A conceptual vector illustration depicting business analysis and market research. A hand holds a magnifying glass, focusing on a colorful financial chart with bar and line graphs labeled 'Market Trends'. Surrounding icons represent key business metrics like growth, decline, market share, and innovation. This flat design graphic is ideal for presentations, reports, and web content related to data analytics, strategic planning, and financial performance evaluation, symbolizing the scrutiny of data to identify opportunities and understand market dynamics. Decrease statistics illustrations Business Analysis and Market Trends Concept with Magnifying Glass. A conceptual vector illustration depicting business analysis and market research. A hand holds a magnifying glass, focusing on a colorful financial chart with bar and line graphs labeled 'Market Trends'. Surrounding icons represent key business metrics like growth, decline, market share, and innovation. This flat design graphic is ideal for presentations, reports, and web content related to data analytics, strategic planning, and financial performance evaluation, symbolizing the scrutiny of data to identify opportunities and understand market dynamics.
Free with trial Decreasing graph line icon. Continuous line big heart. Column chart sign. Market analytics symbol. 3d hearts in heart shaped loop. Decreasing graph single line ribbon. Loop curve pattern. Vector. Decrease statistics vectors Decreasing graph line icon. Column chart sign. Continuous line big heart. Vector. Decreasing graph line icon. Continuous line big heart. Column chart sign. Market analytics symbol. 3d hearts in heart shaped loop. Decreasing graph single line ribbon. Loop curve pattern. Vector
Free with trial Pie chart line icon. Neumorphic, Flat shadow, 3d buttons. Presentation 3d graph sign. Market analytics symbol. Line pie chart icon. Social media icons. Vector. Decrease statistics vectors Pie chart line icon. Presentation 3d graph sign. Neumorphic buttons. Vector. Pie chart line icon. Neumorphic, Flat shadow, 3d buttons. Presentation 3d graph sign. Market analytics symbol. Line pie chart icon. Social media icons. Vector
Free with trial A simple bar chart and line graph with a downward arrow illustrates a negative trend like recession or business failure ideal for financial reports about crisis or loss. Decrease statistics illustrations Declining Blue Bar Chart and Line Graph Showing Financial Loss on Gray Background. A simple bar chart and line graph with a downward arrow illustrates a negative trend like recession or business failure ideal for financial reports about crisis or loss
Free with trial Colorful Bar Chart Graph Showing Growth and Performance Over Time with Upward Trend. Decrease statistics vectors Colorful Bar Chart Graph Showing Growth and Performance Over Time with Upward Trend
Free with trial This graph illustrates the fluctuation of interest rates over the last 12 months, ranging from 3. 5% to 7%. The line chart provides a visual representation of the trend, allowing for easy analysis and understanding of the data. The graph is a valuable resource for businesses, investors, and individuals looking to stay informed about the current state of the economy and make informed decisions about their financial planning and strategy. Decrease statistics illustrations A graph showing interest rate fluctuation over the last 12 months. This graph illustrates the fluctuation of interest rates over the last 12 months, ranging from 3.5% to 7%. The line chart provides a visual representation of the trend, allowing for easy analysis and understanding of the data. The graph is a valuable resource for businesses, investors, and individuals looking to stay informed about the current state of the economy and make informed decisions about their financial planning and strategy.
Free with trial Red downward arrows symbolize a decline in financial markets or economic downturn. The background features blurred lights, enhancing the dramatic effect. Decrease statistics illustrations Red downward arrows symbolize a decline in financial markets or economic downturn.
Free with trial This vibrant image, generated by AI, depicts a cityscape with a dynamic graph illustrating growth and potential decline. The color transition symbolizes economic fluctuations, offering a visual representation of urban development and market trends. Decrease statistics illustrations AI-Generated Cityscape Growth Chart. This vibrant image, generated by AI, depicts a cityscape with a dynamic graph illustrating growth and potential decline. The color transition symbolizes economic fluctuations, offering a visual representation of urban development and market trends.
Free with trial Five colorful bars, resembling a chart, visually represent a downward trend. The bars are yellow, green, blue and purple. Decrease statistics vectors Colorful bar chart illustration showing declining trend on transparent background. Five colorful bars, resembling a chart, visually represent a downward trend. The bars are yellow, green, blue and purple.
Free with trial This futuristic visualization, generated by AI, depicts a global Bitcoin network, highlighting its worldwide reach and digital infrastructure. Data streams and interactive elements showcase the complex interplay of transactions and information flow within the cryptocurrency ecosystem. Decrease statistics illustrations Global Bitcoin Network
Free with trial Simple vector graph illustration showing increasing and decreasing trend with bars. Decrease statistics vectors Simple vector graph illustration showing increasing and decreasing trend with bars
Free with trial Set of twelve black and white icons representing business and finance concepts such as graphs charts analysis tools and targets isolated on transparent background. Decrease statistics vectors Collection of business and finance icons including graphs charts and analysis tools for presentations and reports. Set of twelve black and white icons representing business and finance concepts such as graphs charts analysis tools and targets isolated on transparent background
Free with trial Calendar graph line icon. Halftone dotted pattern. Gradient icon with grain shadow. Column chart sign. Growth diagram symbol. Line calendar graph icon. Various designs. Vector. Decrease statistics vectors Calendar graph line icon. Column chart sign. Halftone dotted pattern. Vector. Calendar graph line icon. Halftone dotted pattern. Gradient icon with grain shadow. Column chart sign. Growth diagram symbol. Line calendar graph icon. Various designs. Vector
Free with trial A glowing neon blue line graph depicts a steep downward trend with an arrow indicating a significant fall. Decrease statistics illustrations Neon blue graph illustrating a sharp decline and downward trend on a dark background. A glowing neon blue line graph depicts a steep downward trend with an arrow indicating a significant fall
Free with trial Travel industry decline, concept. Colorful suitcases with downward red arrow. 3D rendering isolated on white background. Decrease statistics illustrations Travel industry decline, concept. Colorful suitcases with downward red arrow. 3D rendering
Free with trial Red line graph showing a sharp decline overlays a world map, symbolizing a global financial crisis and market downturn. The graph, illuminated in red, sharply contrasts the dark background, highlighting volatility and economic instability. The map features continents in a subdued light, enhancing the focus on the graph's fluctuating line. This visual concept emphasizes the widespread impact of economic recession. Decrease statistics illustrations Glowing red graph showing a stock market crash and economic recession over a world map. Red line graph showing a sharp decline overlays a world map, symbolizing a global financial crisis and market downturn. The graph, illuminated in red, sharply contrasts the dark background, highlighting volatility and economic instability. The map features continents in a subdued light, enhancing the focus on the graph's fluctuating line. This visual concept emphasizes the widespread impact of economic recession.
Free with trial This image features a large, green percentage symbol rendered in a three-dimensional style, giving it a sense of depth and volume. The symbol is composed of two overlapping circles with a diagonal slash, often used to denote percentage calculations, discounts, or statistical representations. Decrease statistics illustrations A bold green percentage symbol displayed in a three-dimensional style. This image features a large, green percentage symbol rendered in a three-dimensional style, giving it a sense of depth and volume. The symbol is composed of two overlapping circles with a diagonal slash, often used to denote percentage calculations, discounts, or statistical representations
Free with trial A bold infographic in flat-style depicting inflation through an upward red arrow, a concerned professional figure, and financial icons symbolizing rising prices and reduced purchasing power �. Decrease statistics illustrations . A bold infographic in flat-style depicting inflation through an upward red arrow, a concerned professional figure, and financial icons symbolizing rising prices and reduced purchasing power �
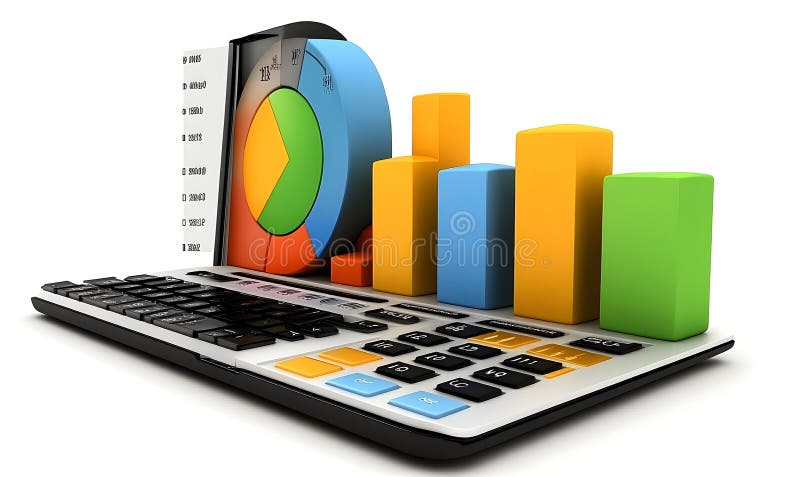
Free with trial Colorful Charts on a Calculator Keyboard. Decrease statistics illustrations Colorful Charts on a Calculator Keyboard
Free with trial A visual representation of a declining real estate market, showing smaller houses and a sharp downward trending green arrow. Decrease statistics illustrations Real estate market decline illustrated by decreasing house sizes and downward arrow. A visual representation of a declining real estate market, showing smaller houses and a sharp downward trending green arrow
Free with trial A vibrant circular chart displaying a twenty percent decrease with bright colors and clean design, ideal for business, finance, and analytics presentations. Decrease statistics illustrations Colorful Circular Chart with Percentage Reduction in Modern Data Visualization Style. A vibrant circular chart displaying a twenty percent decrease with bright colors and clean design, ideal for business, finance, and analytics presentations
Free with trial A simple black line graph depicts a downward trend with sharp fluctuations on white. Decrease statistics illustrations Black line graph showing a downward trend on a white background chart. A simple black line graph depicts a downward trend with sharp fluctuations on white
Free with trial A modern workspace features a desktop computer displaying hand-drawn charts and graphs, representing data analysis and business insights. The screen shows various types of charts including bar graphs, line graphs, and pie charts. The overall image projects a sense of productivity and strategic pla. Decrease statistics illustrations Data Visualization on Desktop. A modern workspace features a desktop computer displaying hand-drawn charts and graphs, representing data analysis and business insights. The screen shows various types of charts including bar graphs, line graphs, and pie charts. The overall image projects a sense of productivity and strategic pla
Free with trial Simple line art business icons set featuring a magnifying glass, minus symbol, pie chart, and rising bar graph for financial data analysis. Decrease statistics vectors Simple line art business icons set featuring a magnifying glass, minus symbol, pie chart, and rising bar graph for
Free with trial This image shows a calculator, tablet, and financial charts, all generated by AI for illustrative purposes. The blue color scheme emphasizes the data-driven nature of modern finance and business analytics. The image suggests efficiency and precision in financial planning and analysis. Decrease statistics illustrations Financial Data Analysis. This image shows a calculator, tablet, and financial charts, all generated by AI for illustrative purposes. The blue color scheme emphasizes the data-driven nature of modern finance and business analytics. The image suggests efficiency and precision in financial planning and analysis.
Free with trial Understanding bar graph charts data analysis and visualization for business and financial performance metrics. Decrease statistics vectors Understanding bar graph charts data analysis and visualization for business
Free with trial Business data is visually represented in black and white through various charts and graphs illustrating growth analysis and strategic planning for financial reporting showing a clear picture of market. Decrease statistics vectors Black and white business data visualization with charts and graphs showing growth and analysis for financial reporting and. Business data is visually represented in black and white through various charts and graphs illustrating growth analysis and strategic planning for financial reporting showing a clear picture of market
Free with trial Graphs set with line charts, bar charts, and scatter plots illustrating upward and downward trends with arrows and data points. Decrease statistics vectors Graphs set with line charts, bar charts, and scatter plots illustrating upward and
Free with trial A minimalist graphic illustration of a downward financial trend features a green line graph with three vertical bars topped by dollar signs, where the first bar is green, the second yellow, and the third orange, symbolizing decreasing monetary value, set against a clean white background with scattered dollar signs emphasizing economic decline, conveying a clear message of financial loss, market. Decrease statistics illustrations Downward financial trend with colored dollar signs on white background. A minimalist graphic illustration of a downward financial trend features a green line graph with three vertical bars topped by dollar signs, where the first bar is green, the second yellow, and the third orange, symbolizing decreasing monetary value, set against a clean white background with scattered dollar signs emphasizing economic decline, conveying a clear message of financial loss, market
Free with trial Decreasing graph line icon. Halftone dotted pattern. Gradient icon with grain shadow. Column chart sign. Crisis diagram symbol. Line decreasing graph icon. Various designs. Vector. Decrease statistics vectors Decreasing graph line icon. Crisis chart sign. Halftone dotted pattern. Vector. Decreasing graph line icon. Halftone dotted pattern. Gradient icon with grain shadow. Column chart sign. Crisis diagram symbol. Line decreasing graph icon. Various designs. Vector
Free with trial 3D illustration of a red bar chart with a downward arrow, isolated on a transparent background. Symbolizes financial loss, economic crisis, revenue drop, or business decline. Ideal for presentations, finance reports, investment warnings, stock market analysis, and economic downturn visuals. Decrease statistics illustrations 3D Red Downward Arrow Graph Icon Showing Financial Decline on Transparent Background. 3D illustration of a red bar chart with a downward arrow, isolated on a transparent background. Symbolizes financial loss, economic crisis, revenue drop, or business decline. Ideal for presentations, finance reports, investment warnings, stock market analysis, and economic downturn visuals.
Free with trial A 3D illustration of a statistic down icon isolated on a white background symbolizing decline in data or business performance. Decrease statistics illustrations Statistic down 3D illustration. A 3D illustration of a statistic down icon isolated on a white background symbolizing decline in data or business performance
Free with trial A simple bar graph illustrating upward growth and financial success. Ideal for presentations, reports, and website use. Decrease statistics vectors Upward Trending Bar Graph: Business Growth and Financial Success. A simple bar graph illustrating upward growth and financial success. Ideal for presentations, reports, and website use.
Free with trial Close-up of a financial chart showing a red line declining. The chart is on a piece of white paper and the red line is the main focus. Decrease statistics illustrations Financial Chart Showing Decline. Close-up of a financial chart showing a red line declining. The chart is on a piece of white paper and the red line is the main focus
Free with trial Graph line icon. Neumorphic, Flat shadow, 3d buttons. Column chart sign. Growth diagram symbol. Line graph chart icon. Social media icons. Vector. Decrease statistics vectors Graph line icon. Column chart sign. Neumorphic buttons. Vector. Graph line icon. Neumorphic, Flat shadow, 3d buttons. Column chart sign. Growth diagram symbol. Line graph chart icon. Social media icons. Vector
Free with trial A striking 3D rendering depicts a bold red downward trend arrow overlaid on a subtle grid, immediately conveying a sense of decline and loss. Set against a pristine white background, the graphic powerfully symbolizes financial instability, market downturns, and the potential for recession. This illustration is ideal for conveying concepts of investment risk, negative business trends, and economic. Decrease statistics illustrations Red downward trend arrow and grid symbolizing decline or recession on white background. A striking 3D rendering depicts a bold red downward trend arrow overlaid on a subtle grid, immediately conveying a sense of decline and loss. Set against a pristine white background, the graphic powerfully symbolizes financial instability, market downturns, and the potential for recession. This illustration is ideal for conveying concepts of investment risk, negative business trends, and economic
Free with trial Financial planning graph shows coins and pen. Decrease statistics illustrations Financial planning graph shows coins and pen
Free with trial Financial data analysis tools, vibrant background Generative AI. Decrease statistics illustrations Financial data analysis tools
Free with trial A business professional conducts a thorough analysis of financial data using a magnifying glass, illustrating market trends with graphs and charts on a digital interface. Scalp. Decrease statistics illustrations Business Professional Analyzing Financial Data with a Magnifying Glass, Graphs, and Visual Representation of Market. A business professional conducts a thorough analysis of financial data using a magnifying glass, illustrating market trends with graphs and charts on a digital interface. Scalp
Free with trial A conceptual vector illustration depicting the duality of business performance. On a modern teal background, two reports are shown side-by-side. One features a rising red graph symbolizing growth, profit, and success, while the other displays a descending graph representing decline, loss, and failure. This flat design graphic is ideal for financial analysis, market trend comparisons, business presentations, and infographics illustrating opposite outcomes or strategic choices. The long shadow effect adds a contemporary feel to the design. Decrease statistics vectors Growth and Decline Business Charts Comparison. A conceptual vector illustration depicting the duality of business performance. On a modern teal background, two reports are shown side-by-side. One features a rising red graph symbolizing growth, profit, and success, while the other displays a descending graph representing decline, loss, and failure. This flat design graphic is ideal for financial analysis, market trend comparisons, business presentations, and infographics illustrating opposite outcomes or strategic choices. The long shadow effect adds a contemporary feel to the design.
Free with trial A close-up shot of a printed financial report showing market fluctuations indicated by a red line graph. Decrease statistics illustrations A financial document showing a fluctuating red line graph displayed. A close-up shot of a printed financial report showing market fluctuations indicated by a red line graph
Free with trial A sharp red arrow graphically showcases a significant decline on a financial chart display. Decrease statistics illustrations A sharp red arrow graphically showcases a significant decline on a financial chart display
Free with trial Tax blocks with percentage symbol and up and down arrows on financial charts, concept of tax rate changes and fiscal policy featuring taxes, taxation, percent with VAT and government elements for. Decrease statistics illustrations Tax blocks with percentage symbol and up and down arrows on financial charts
Free with trial A magnifying glass focuses on a vibrant bar graph, symbolizing financial growth and investment opportunities. Stacks of gold coins rest on a financial report, enhancing the visual representation of wealth and prosperity. This 3D rendering, generated by AI, is ideal for illustrating financial concep. Decrease statistics illustrations Financial Growth Analysis. A magnifying glass focuses on a vibrant bar graph, symbolizing financial growth and investment opportunities. Stacks of gold coins rest on a financial report, enhancing the visual representation of wealth and prosperity. This 3D rendering, generated by AI, is ideal for illustrating financial concep
Free with trial A 3D rendered image showing a decreasing purple bar graph with an orange arrow pointing downwards. Stacks of coins are placed near the graph, suggesting financial loss or economic downturn. The graph is displayed on a white surface with lines indicating a chart. Decrease statistics illustrations 3d purple bar graph with orange downward arrow. A 3D rendered image showing a decreasing purple bar graph with an orange arrow pointing downwards. Stacks of coins are placed near the graph, suggesting financial loss or economic downturn. The graph is displayed on a white surface with lines indicating a chart
Free with trial A black graph on a white background depicts a sharp downward trend with an arrow indicating further decline. Decrease statistics illustrations Black graph showing a downward trend on a white background chart decline. A black graph on a white background depicts a sharp downward trend with an arrow indicating further decline
Free with trial An eye-catching 3D bar graph illustration with yellow, blue, and red elements. It is designed to represent data or growth concepts. Decrease statistics vectors Colorful 3D bar graph illustration showing descending values on transparent background. An eye-catching 3D bar graph illustration with yellow, blue, and red elements. It is designed to represent data or growth concepts.
Free with trial A dynamic 3D rendering of a bar graph, depicting a downward trend with vibrant red bars and a prominent white arrow pointing downwards. The scene is set against a dark, subtly textured background, creating a dramatic visual contrast. This image effectively symbolizes decline, loss, negative financial trends, or challenges in business. Decrease statistics illustrations 3D Bar Graph with Declining Red Bars and White Arrow Ai Generated. A dynamic 3D rendering of a bar graph, depicting a downward trend with vibrant red bars and a prominent white arrow pointing downwards. The scene is set against a dark, subtly textured background, creating a dramatic visual contrast. This image effectively symbolizes decline, loss, negative financial trends, or challenges in business.
Free with trial This image depicts a financial downturn with a graphic arrow indicating a decline in value. Decrease statistics illustrations Downward trend represented by a blue arrow breaking through the floor. This image depicts a financial downturn with a graphic arrow indicating a decline in value
Free with trial Illustration depicting a financial downturn, featuring stacks of gold coins, a blue bar graph showing a decline, and a red arrow pointing downwards, all set against a white background. Decrease statistics illustrations Financial decline with gold coins and bar graph. Illustration depicting a financial downturn, featuring stacks of gold coins, a blue bar graph showing a decline, and a red arrow pointing downwards, all set against a white background
Free with trial Behavioral Economics concept. An investor experiences loss aversion amid falling market graphs and diminishing returns. Investment risk, financial decision making. Vector illustration. Decrease statistics vectors Behavioral Economics. Flat Vector Illustration. Behavioral Economics concept. An investor experiences loss aversion amid falling market graphs and diminishing returns. Investment risk, financial decision making. Vector illustration.
Free with trial Hand drawing a down arrow over a decreasing bar chart on a green chalkboard. Decrease statistics illustrations Hand drawing declining bar graph on blackboard. Hand drawing a down arrow over a decreasing bar chart on a green chalkboard
Free with trial Hand holding tablet with red downward trend graph, digital style on dark office background, concept of financial crisis and market collapse. Decrease statistics illustrations Businessman holding tablet with falling stock market graph and red arrows representing financial crisis and global economic. Hand holding tablet with red downward trend graph, digital style on dark office background, concept of financial crisis and market collapse
Free with trial A vibrant bar graph shows an upward trend with a green arrow, indicating growth. The bars are blue, yellow, green, and red, set against a clean white background. Decrease statistics illustrations Colorful Bar Graph with Upward Trend Line and Green Arrow Indicator on White Background. A vibrant bar graph shows an upward trend with a green arrow, indicating growth. The bars are blue, yellow, green, and red, set against a clean white background
Free with trial This image depicts a computer screen displaying a sharply declining stock market graph, generated by AI. The red line dramatically illustrates a significant market downturn, accompanied by numerous data points and financial indicators. The dark aesthetic enhances the sense of urgency and potential. Decrease statistics illustrations AI-Generated Stock Market Decline. This image depicts a computer screen displaying a sharply declining stock market graph, generated by AI. The red line dramatically illustrates a significant market downturn, accompanied by numerous data points and financial indicators. The dark aesthetic enhances the sense of urgency and potential
Free with trial Isolated on transparent background downward arrow made of scattered red blocks. Decrease statistics illustrations Graphic illustration showing downward trend with falling blocks design. Isolated on transparent background downward arrow made of scattered red blocks
Free with trial This image illustrates a comparison between an increasing trend and a decreasing trend using bar graphs and arrows. Decrease statistics illustrations Comparison of increasing and decreasing trends. This image illustrates a comparison between an increasing trend and a decreasing trend using bar graphs and arrows
Free with trial This 3D rendered image shows a computer screen displaying various charts and graphs, including bar charts, pie charts, and line graphs. The data visualization is colorful and easy to understand, generated by AI for quick data interpretation. The design is simple and modern, ideal for presentations. Decrease statistics illustrations AI-Generated Data Dashboard. This 3D rendered image shows a computer screen displaying various charts and graphs, including bar charts, pie charts, and line graphs. The data visualization is colorful and easy to understand, generated by AI for quick data interpretation. The design is simple and modern, ideal for presentations