Free with trial Trend down isolated icon. Business graph line vector icon for websites and mobile 3d design. Decrease statistics vectors Trend down isolated icon. Business graph line vector icon for websites and mobile 3d design.
Free with trial Group of people with devices in hands having desk discussion and making reports together on laptop, tablet, notebookn. Decrease statistics illustrations Group of people with devices in hands having desk discussion and working on laptops, tablets in team. Group of people with devices in hands having desk discussion and making reports together on laptop, tablet, notebookn
Free with trial Reduction in the number of COVID-19 cases concept. Novel coronavirus pandemic. Template for background, banner, poster with text inscription. Vector EPS10 illustration. Decrease statistics vectors Reduction in the number of COVID-19 cases concept. Novel coronavirus pandemic. Template for background, banner, poster
Free with trial Bitcoin Up Down Graph. Vector Illustration with Financial Diagram isolated over White. Decrease statistics vectors Bitcoin Up Down Graph
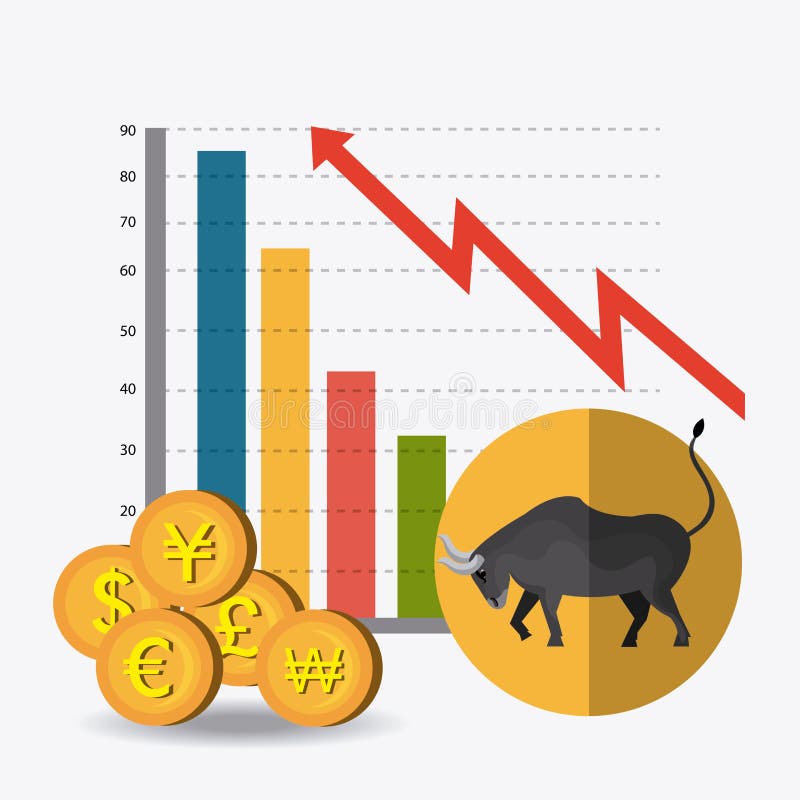
Free with trial Business stock exchange design over white background, vector illustration. Decrease statistics vectors Business stock exchange
Free with trial Business stock exchange design over white background, vector illustration. Decrease statistics vectors Business stock exchange
Free with trial Business stock exchange design over white background, vector illustration. Decrease statistics vectors Business stock exchange
Free with trial Negative trend. Declining graph, red arrow Vector illustration. Decrease statistics vectors Negative trend icon. Negative trend. Declining graph, red arrow Vector illustration
Free with trial Financial growth chart. The building and construction sector. EPS10. Decrease statistics vectors Financial growth chart. The building and construction sector.
Free with trial A red financial graph visually represents a stock market decline, showcasing bearish trends, losses, and a downward trajectory. The graph is depicted in red lines on a black background. Decrease statistics illustrations Red Stock Market Graph Displaying Financial Losses and Economic Downturn Trends. A red financial graph visually represents a stock market decline, showcasing. A red financial graph visually represents a stock market decline, showcasing bearish trends, losses, and a downward trajectory. The graph is depicted in red lines on a black background
Free with trial Infographic timeline. Correct answer, Calendar and Analytics graph icons simple set. Multichannel sign. Approved, Calculator device, Growth report. Multitasking. Technology set. 4 steps layout. Vector. Decrease statistics vectors Correct answer, Calendar and Analytics graph icons set. Multichannel sign. Vector. Infographic timeline. Correct answer, Calendar and Analytics graph icons simple set. Multichannel sign. Approved, Calculator device, Growth report. Multitasking. Technology set. 4 steps layout. Vector
Free with trial Covid19 coronavirus global economy downfall arrow background vector. Decrease statistics vectors Covid19 coronavirus global economy downfall arrow background
Free with trial Dot plot graph line icon. Presentation chart sign. Market analytics symbol. Colorful outline concept. Blue and orange thin line color Dot plot icon. Vector. Decrease statistics vectors Dot plot graph line icon. Presentation chart sign. Vector. Dot plot graph line icon. Presentation chart sign. Market analytics symbol. Colorful outline concept. Blue and orange thin line color Dot plot icon. Vector
Free with trial Set of Business icons, such as Timer, 5g notebook, 3d chart symbols. Mobile screen banners. Consolidation line icons. Stopwatch gadget, Wireless laptop, Presentation column. Strategy. Vector. Decrease statistics vectors Set of Business icons, such as Timer, 5g notebook, 3d chart symbols. Consolidation line icons. Vector. Set of Business icons, such as Timer, 5g notebook, 3d chart symbols. Mobile screen banners. Consolidation line icons. Stopwatch gadget, Wireless laptop, Presentation column. Strategy. Vector
Free with trial Two lines are representing increasing and declining trends over a grid background, symbolizing market analysis, financial performance, or business progress. Decrease statistics vectors Two lines are representing increasing and declining trends over a grid background, symbolizing market analysis
Free with trial Illustration of Global Financial Crisis, Currencies Falling Down Financial Recession. Decrease statistics vectors Global Financial Crisis Illustration, Currencies Falling Down. Illustration of Global Financial Crisis, Currencies Falling Down Financial Recession
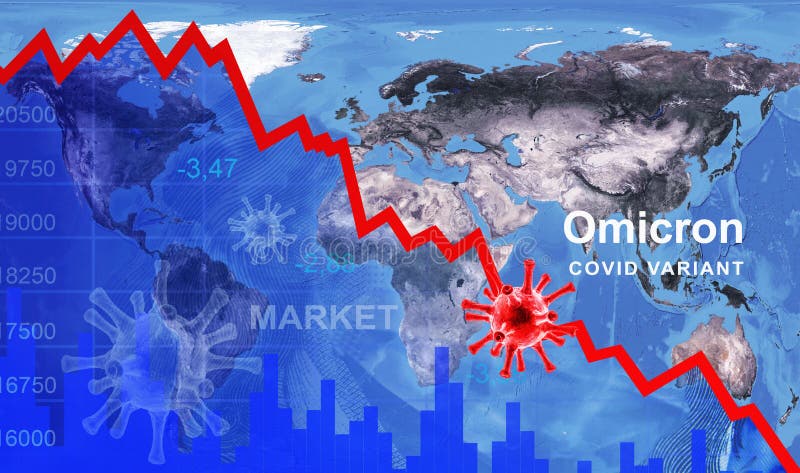
Free with trial Omicron COVID-19 variant effect to business, graph of stock market on world map, economy hits by corona virus. Concept of global financial crisis, recession and panic due to new coronavirus outbreak. Decrease statistics illustrations Omicron COVID-19 variant effect to business, graph of stock market on world map
Free with trial Crisis finance graph chart icon. Outline crisis finance graph chart vector icon for web design isolated on white background. Decrease statistics vectors Crisis finance graph chart icon, outline style. Crisis finance graph chart icon. Outline crisis finance graph chart vector icon for web design isolated on white background
Free with trial Economic crisis Well-crafted Pixel Perfect Vector Thin Line Icons 30 2x Grid for Web Graphics and Apps. Simple Minimal Pictogram. Decrease statistics vectors Economic crisis Well-crafted Pixel Perfect Vector Thin Line Icons
Free with trial Loss bar chart icon vector, filled flat sign, solid pictogram isolated on white. Symbol, logo illustration. Pixel perfect graphics. Decrease statistics vectors Loss bar chart icon vector
Free with trial Accounting checklist, Payment methods and Growth chart icons simple set. Comparison table. Calendar graph sign. Calculator, Credit card, Sale diagram. Annual report. Finance set. Pricing plan. Vector. Decrease statistics vectors Accounting checklist, Payment methods and Growth chart icons set. Calendar graph sign. Vector. Accounting checklist, Payment methods and Growth chart icons simple set. Comparison table. Calendar graph sign. Calculator, Credit card, Sale diagram. Annual report. Finance set. Pricing plan. Vector
Free with trial Decline chart icon isolated on dark background. Simple vector logo. Decrease statistics vectors Decline chart icon isolated on dark background
Free with trial Business stock exhange design, vector illustration eps 10. Decrease statistics vectors Business stock exchange. Business stock exhange design, vector illustration eps 10.
Free with trial GDP word rising and falling arrows and coins. Gross domestic product concept. 3D illustration. Decrease statistics illustrations GDP word rising and falling arrows and coins. Gross domestic product concept. 3D illustration
Free with trial Analytics graph, Horizontal chart and Engineering icons simple set. Laptop sign. Chart report, Presentation graph, Cogwheel head. Computer. Science set. Linear analytics graph icon. Vector. Decrease statistics vectors Analytics graph, Horizontal chart and Engineering icons set. Laptop sign. Vector. Analytics graph, Horizontal chart and Engineering icons simple set. Laptop sign. Chart report, Presentation graph, Cogwheel head. Computer. Science set. Linear analytics graph icon. Vector
Free with trial Stock market crash with arrows down vector illustration design. Decrease statistics vectors Stock market crash with arrows down
Free with trial Dot plot graph line icon. Presentation chart sign. Market analytics symbol. Geometric shapes. Random cross elements. Linear Dot plot icon design. Vector. Decrease statistics vectors Dot plot graph line icon. Presentation chart sign. Vector. Dot plot graph line icon. Presentation chart sign. Market analytics symbol. Geometric shapes. Random cross elements. Linear Dot plot icon design. Vector
Free with trial Graph chart with exponential decay bars and arrows on white background. 3d illustration. Decrease statistics illustrations Exponential decay decline statistical graph on white background. Graph chart with exponential decay bars and arrows on white background. 3d illustration
Free with trial The growth and decline concept with businessmen. Decrease statistics illustrations The growth and decline concept with businessmen
Free with trial Graph line icon. Column chart sign. Growth diagram symbol. Quality design flat app element. Editable stroke Graph chart icon. Vector. Decrease statistics vectors Graph line icon. Column chart sign. Vector. Graph line icon. Column chart sign. Growth diagram symbol. Quality design flat app element. Editable stroke Graph chart icon. Vector
Free with trial Checklist line icon. Graph chart sign. Growth diagram symbol. Colorful outline concept. Blue and orange thin line color Checklist icon. Vector. Decrease statistics vectors Checklist line icon. Graph chart sign. Vector. Checklist line icon. Graph chart sign. Growth diagram symbol. Colorful outline concept. Blue and orange thin line color Checklist icon. Vector
Free with trial Simple illustration of a business loss icon. Decrease statistics vectors Business loss icon
Free with trial Analytics graph icon. Column chart sign. Growth diagram symbol. Dynamic shapes. Gradient design analytics graph icon. Classic style. Vector. Decrease statistics vectors Analytics graph icon. Column chart sign. Vector. Analytics graph icon. Column chart sign. Growth diagram symbol. Dynamic shapes. Gradient design analytics graph icon. Classic style. Vector
Free with trial Column chart sign. Versus concept. Graph phone line icon. Growth diagram symbol. Line vs classic graph phone icon. Vector. Decrease statistics vectors Graph phone line icon. Column chart sign. Vector. Column chart sign. Versus concept. Graph phone line icon. Growth diagram symbol. Line vs classic graph phone icon. Vector
Free with trial Column graph sign. Certification complex icon. Growth chart line icon. Market analytics symbol. Certificate or diploma document. Growth chart sign. Vector. Decrease statistics vectors Growth chart line icon. Column graph sign. Vector. Column graph sign. Certification complex icon. Growth chart line icon. Market analytics symbol. Certificate or diploma document. Growth chart sign. Vector
Free with trial Oil prices industry design, vector illustration eps10. Decrease statistics illustrations Oil prices industry
Free with trial Financial stock crisis chart, vector art illustration. Decrease statistics vectors Financial stock crisis chart
Free with trial A striking red line graph against a dark backdrop, illustrating a stock market crash and highlighting a financial crisis. The image conveys a sense of loss and economic downturn. Decrease statistics illustrations Stock market crash illustration with red line graph on a dark background depicting financial crisis concept. A striking red line graph against a dark backdrop, illustrating a stock market crash and highlighting a financial crisis. The image conveys a sense of loss and economic downturn
Free with trial Report line icon. Halftone pattern. Column graph, pie chart sign. Market analytics symbol. Gradient background. Yellow halftone pattern. Vector. Decrease statistics vectors Report line icon. Column graph, pie chart sign. Vector. Report line icon. Halftone pattern. Column graph, pie chart sign. Market analytics symbol. Gradient background. Report line icon. Yellow halftone pattern. Vector
Free with trial Pyramid chart line icon. Analytics graph sign. Market analytics symbol. Colorful outline concept. Blue and orange thin line color Pyramid chart icon. Vector. Decrease statistics vectors Pyramid chart line icon. Analytics graph sign. Vector. Pyramid chart line icon. Analytics graph sign. Market analytics symbol. Colorful outline concept. Blue and orange thin line color Pyramid chart icon. Vector
Free with trial Like, Update data and Graph chart icons simple set. Halftone dots button. Customisation sign. Social media likes, Sales chart, Growth report. Settings. Technology set. Classic flat like icon. Vector. Decrease statistics vectors Like, Update data and Graph chart icons set. Customisation sign. Vector. Like, Update data and Graph chart icons simple set. Halftone dots button. Customisation sign. Social media likes, Sales chart, Growth report. Settings. Technology set. Classic flat like icon. Vector
Free with trial Pie chart line icon. Presentation 3d graph sign. Market analytics symbol. Quality design flat app element. Editable stroke Pie chart icon. Vector. Decrease statistics vectors Pie chart line icon. Presentation 3d graph sign. Vector. Pie chart line icon. Presentation 3d graph sign. Market analytics symbol. Quality design flat app element. Editable stroke Pie chart icon. Vector
Free with trial Hand using wireless mouse in a dark environment with cloud technology and online storage concept. Decrease statistics illustrations Hand using mouse with cloud technology and online storage concept. Hand using wireless mouse in a dark environment with cloud technology and online storage concept
Free with trial Widescreen Abstract financial chart with downtrend line graph and walking bear icon in stock market on red and blue color backgrou. Decrease statistics vectors Widescreen Abstract financial chart with downtrend line graph and walking bear icon in stock market on red and blue color backgrou
Free with trial Diagram chart line icon. Presentation graph sign. Market analytics symbol. Colorful outline concept. Blue and orange thin line color Diagram chart icon. Vector. Decrease statistics vectors Diagram chart line icon. Presentation graph sign. Vector. Diagram chart line icon. Presentation graph sign. Market analytics symbol. Colorful outline concept. Blue and orange thin line color Diagram chart icon. Vector
Free with trial Partnership, Project edit and 3d chart line icons set. Timeline process infograph. Idea sign. Business startup, Settings, Presentation column. Light bulb. Science set. Vector. Decrease statistics vectors Partnership, Project edit and 3d chart icons set. Idea sign. Business startup, Settings, Presentation column. Vector. Partnership, Project edit and 3d chart line icons set. Timeline process infograph. Idea sign. Business startup, Settings, Presentation column. Light bulb. Science set. Vector
Free with trial Graph line icon. Column chart sign. Growth diagram symbol. Quality design flat app element. Editable stroke Graph chart icon. Vector. Decrease statistics vectors Graph line icon. Column chart sign. Vector. Graph line icon. Column chart sign. Growth diagram symbol. Quality design flat app element. Editable stroke Graph chart icon. Vector
Free with trial Graph Chart Up Down Business Declining in Pandemic Economic Recession Illustration. Decrease statistics vectors Graph Chart Up Down Business Declining in Pandemic Economic Recession Illustration
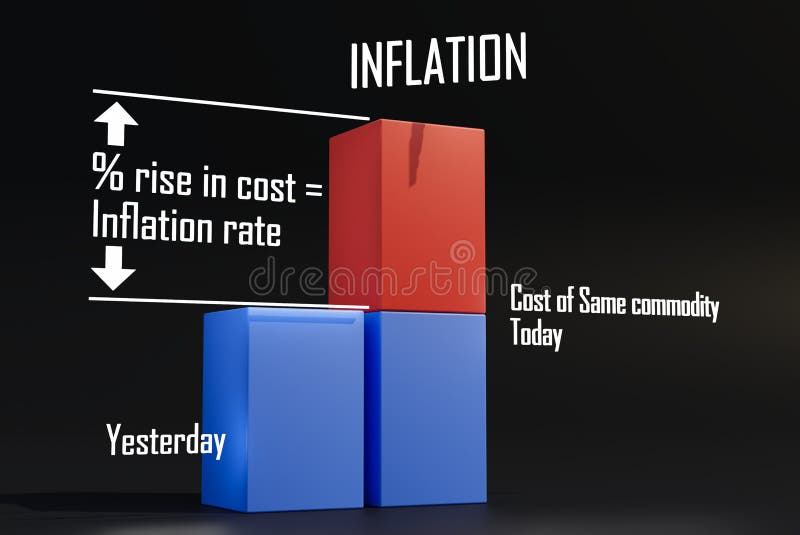
Free with trial 3D graph bar chart explains Inflation rate. 3D rendering illustration. Cost comparison chart. Decrease statistics illustrations 3D graph bar chart explains Inflation rate. 3D rendering illustration.
Free with trial Checklist line icon. Graph chart sign. Growth diagram symbol. Quality design flat app element. Editable stroke Checklist icon. Vector. Decrease statistics vectors Checklist line icon. Graph chart sign. Vector. Checklist line icon. Graph chart sign. Growth diagram symbol. Quality design flat app element. Editable stroke Checklist icon. Vector
Free with trial Bars descending graph vector line icon, sign, illustration on white background, editable strokes. Decrease statistics vectors Bars descending graph vector line icon, sign, illustration on background, editable strokes
Free with trial Header banner. Settings blueprint, Recycle and Survey checklist icons simple set. Diagram graph, Elevator and Sales diagram signs. Report document, Recycling waste. Technology set. Vector. Decrease statistics vectors Settings blueprint, Recycle and Survey checklist icons set. Diagram graph, Elevator and Sales diagram signs. Vector. Header banner. Settings blueprint, Recycle and Survey checklist icons simple set. Diagram graph, Elevator and Sales diagram signs. Report document, Recycling waste. Technology set. Vector
Free with trial Bar graph with declining concept. Vector illustration decorative design. Decrease statistics vectors Bar graph with declining concept. Vector illustration decorative design
Free with trial Set of Business icons, such as Loan percent, Friendship, Check investment, Bill accounting, Arena stadium, Unknown file, Diagram chart, Chemistry lab, Travel calendar, Bitcoin think. Vector. Decrease statistics vectors Set of Business icons, such as Loan percent, Friendship, Check investment. Vector. Set of Business icons, such as Loan percent, Friendship, Check investment, Bill accounting, Arena stadium, Unknown file, Diagram chart, Chemistry lab, Travel calendar, Bitcoin think. Vector
Free with trial Internet document, Fast verification and Facts line icons set. Business statistics, Approved agreement and Technical documentation signs. Line icons set. Vector. Decrease statistics vectors Internet document, Fast verification and Facts icons set. Vector. Internet document, Fast verification and Facts line icons set. Business statistics, Approved agreement and Technical documentation signs. Line icons set. Vector
Free with trial Abstract financial chart with downtrend line graph and numbers in stock market on gradient red color background. Decrease statistics illustrations Abstract financial chart with downtrend line graph and numbers in stock market on gradient red color background
Free with trial Pie chart, Accounting and Algorithm icons simple set. Idea sign. 3d graph, Supply and demand, Project. Light bulb. Science set. Infographic timeline. Line pie chart icon. 4 options or steps. Vector. Decrease statistics vectors Pie chart, Accounting and Algorithm icons set. Idea sign. 3d graph, Supply and demand, Project. Light bulb. Vector. Pie chart, Accounting and Algorithm icons simple set. Idea sign. 3d graph, Supply and demand, Project. Light bulb. Science set. Infographic timeline. Line pie chart icon. 4 options or steps. Vector
Free with trial Bitcoin Crash Website Design. Flat Style Vector Illustration for Web Banner and Landing Page. Decrease statistics vectors Bitcoin Crash Website Design
Free with trial Time management, Analytics graph and Accounting report line icons set. Timeline infographic. Time change sign. Settings, Chart report, Check finance. Clock. Education set. Time management icon. Vector. Decrease statistics vectors Time management, Analytics graph and Accounting report icons set. Time change sign. Vector. Time management, Analytics graph and Accounting report line icons set. Timeline infographic. Time change sign. Settings, Chart report, Check finance. Clock. Education set. Time management icon. Vector
Free with trial Online survey, Touchscreen gesture and Pie chart line icons set. Handshake deal, research and promotion complex icons. Heart target sign. Quiz test, Slide right, Presentation graph. Love aim. Vector. Decrease statistics vectors Online survey, Touchscreen gesture and Pie chart icons set. Heart target sign. Vector. Online survey, Touchscreen gesture and Pie chart line icons set. Handshake deal, research and promotion complex icons. Heart target sign. Quiz test, Slide right, Presentation graph. Love aim. Vector
Free with trial Credit card, Diagram graph and Internet shopping icons simple set. Button with halftone dots. Growth chart sign. Atm payment, Presentation chart, Cart with purchases. Upper arrows. Finance set. Vector. Decrease statistics vectors Credit card, Diagram graph and Internet shopping icons set. Growth chart sign. Vector. Credit card, Diagram graph and Internet shopping icons simple set. Button with halftone dots. Growth chart sign. Atm payment, Presentation chart, Cart with purchases. Upper arrows. Finance set. Vector
Free with trial Graph laptop line icon. Gradient blur button with glassmorphism. Column chart sign. Growth diagram symbol. Transparent glass design. Vector. Decrease statistics vectors Graph laptop line icon. Column chart sign. Gradient blur button. Vector. Graph laptop line icon. Gradient blur button with glassmorphism. Column chart sign. Growth diagram symbol. Transparent glass design. Graph laptop line icon. Vector
Free with trial Euro money, Diagram graph and 3d chart signs. Bitcoin graph, Refresh bitcoin and Dot plot line icons set. Finance, Demand curve symbols. Cryptocurrency analytics, Update cryptocurrency. Vector. Decrease statistics vectors Bitcoin graph, Refresh bitcoin and Dot plot icons set. Euro money, Diagram graph and 3d chart signs. Vector. Euro money, Diagram graph and 3d chart signs. Bitcoin graph, Refresh bitcoin and Dot plot line icons set. Finance, Demand curve symbols. Cryptocurrency analytics, Update cryptocurrency. Vector
Free with trial Money Graphic Down icon. Monochrome design style from money collection. For UX and UI usage. Decrease statistics vectors Money Graphic Down icon. Monochrome design style from money collection. For UX and UI usage
Free with trial Bar chart or bar graph decreasing vector icon with drop down arrow. Statistical data of stock, financial in business to loss, negative, decline or crisis. Graphic for report, presentation. 48x48 px. n. Decrease statistics vectors Bar chart or bar graph decreasing vector icon with drop down arrow. 48x48 pixel perfect and editable stroke. Bar chart or bar graph decreasing vector icon with drop down arrow. Statistical data of stock, financial in business to loss, negative, decline or crisis. Graphic for report, presentation. 48x48 px.n
Free with trial Graph chart with exponential decay bars and arrow down on black shiny reflective background. 3d illustration. Decrease statistics illustrations Exponential decay decline statistical graph on black background. Graph chart with exponential decay bars and arrow down on black shiny reflective background. 3d illustration
Free with trial Bitcoin pay, Time management and Graph chart line icons set. Group sign. Mobile payment, User with clock, Growth report. Group of users. People set. Line bitcoin pay outline icon. Vector. Decrease statistics vectors Bitcoin pay, Time management and Graph chart icons set. Group sign. Vector. Bitcoin pay, Time management and Graph chart line icons set. Group sign. Mobile payment, User with clock, Growth report. Group of users. People set. Line bitcoin pay outline icon. Vector
Free with trial Creativity concept, Architectural plan and Fast recovery icons simple set. Button with halftone dots. Pie chart sign. Graphic art, Technical project, Backup timer. Presentation graph. Vector. Decrease statistics vectors Creativity concept, Architectural plan and Fast recovery icons set. Pie chart sign. Vector. Creativity concept, Architectural plan and Fast recovery icons simple set. Button with halftone dots. Pie chart sign. Graphic art, Technical project, Backup timer. Presentation graph. Vector
Free with trial Analytics half glyph vector icon which can easily modify or edit. Decrease statistics vectors Analytics half glyph vector icon which can easily modify or edit
Free with trial Analytics graph line icon. Column chart sign. Growth diagram symbol. Quality design flat app element. Editable stroke Analytics graph icon. Vector. Decrease statistics vectors Analytics graph line icon. Column chart sign. Vector. Analytics graph line icon. Column chart sign. Growth diagram symbol. Quality design flat app element. Editable stroke Analytics graph icon. Vector
Free with trial Risky choice of strategy or development path,achieve high results through hard work despite obstacles,achieve your goals in a highly competitive environment,people hold letters risk in your hands. Decrease statistics vectors People hold letters risk in your hands
Free with trial Charts and Diagrams icons. Report, 3D Chart, Block diagram and Dot Plot graph icons. Trend, Pyramid and Pie chart report symbols. Presentation infochart, process flow diagram. Quality set. Vector. Decrease statistics vectors Charts and Diagrams icons. Set of 3D Chart, Block diagram and Dot Plot graph icons. Vector. Charts and Diagrams icons. Report, 3D Chart, Block diagram and Dot Plot graph icons. Trend, Pyramid and Pie chart report symbols. Presentation infochart, process flow diagram. Quality set. Vector
Free with trial Bar chart or bar graph decreasing vector icon with drop down arrow. Statistical data of stock, financial in business to loss, negative, decline or crisis. Graphic for report, presentation. 48x48 px. n. Decrease statistics illustrations Bar chart or bar graph decreasing vector icon with drop down arrow. 48x48 pixel perfect and editable stroke. Bar chart or bar graph decreasing vector icon with drop down arrow. Statistical data of stock, financial in business to loss, negative, decline or crisis. Graphic for report, presentation. 48x48 px.n
Free with trial Vector set of Electronic thermometer, Organic product and Ab testing line icons set. UI phone app screens with line icons. Analytics chart icon. Temperature scan, Leaves, Test chart. Vector. Decrease statistics vectors Vector set of Electronic thermometer, Organic product and Ab testing line icons set. Vector. Vector set of Electronic thermometer, Organic product and Ab testing line icons set. UI phone app screens with line icons. Analytics chart icon. Temperature scan, Leaves, Test chart. Vector
Free with trial Represents the economic decline, stock market decline and career failure, financial economic recession. Decrease statistics illustrations Financial economic decline and decline arrow, oil economy, financial bankruptcy and career failure. Represents the economic decline, stock market decline and career failure, financial economic recession
Free with trial Decreasing bars chart icon vector isolated on white background for your web and mobile app design, Decreasing bars chart logo concept. Decrease statistics vectors Decreasing bars chart icon vector sign and symbol isolated on white background, Decreasing bars chart logo concept. Decreasing bars chart icon vector isolated on white background for your web and mobile app design, Decreasing bars chart logo concept
Free with trial Charts and graphs icons. Infochart, Block diagram and Algorithm. Presentation classic icon set Quality set. Vector. Decrease statistics vectors Charts and graphs icons. Infochart, Block diagram and Algorithm. Classic icon set. Vector. Charts and graphs icons. Infochart, Block diagram and Algorithm. Presentation classic icon set Quality set. Vector
Free with trial Online survey, Touchscreen gesture and Pie chart line icons set. Heart target sign. Quiz test, Slide right, Presentation graph. Love aim. Business set. Line online survey outline icon. Vector. Decrease statistics vectors Online survey, Touchscreen gesture and Pie chart icons set. Heart target sign. Vector. Online survey, Touchscreen gesture and Pie chart line icons set. Heart target sign. Quiz test, Slide right, Presentation graph. Love aim. Business set. Line online survey outline icon. Vector
Free with trial Bitcoin exchange, Graph chart and Savings insurance line icons set. Timeline infograph speech bubble. Download arrow sign. Cryptocurrency change, Growth report, Money exchange. Crisis. Vector. Decrease statistics vectors Bitcoin exchange, Graph chart and Savings insurance icons set. Download arrow sign. Vector. Bitcoin exchange, Graph chart and Savings insurance line icons set. Timeline infograph speech bubble. Download arrow sign. Cryptocurrency change, Growth report, Money exchange. Crisis. Vector
Free with trial Stock market decline downfall red falling arrow. Decrease statistics vectors Stock market decline downfall red falling arrow