Free with trial Line art illustration of a bar chart depicting financial decrease for business analysis. Decrease statistics vectors Line art illustration of a bar chart depicting financial decrease for business analysis
Free with trial Set Binary code Pie chart infographic Data analysis Coal mine trolley Financial growth decrease and Browser with stocks market icon. Vector. Decrease statistics illustrations Set Binary code, Pie chart infographic, Data analysis, Coal mine trolley, Financial growth decrease, and Browser with. Set Binary code Pie chart infographic Data analysis Coal mine trolley Financial growth decrease and Browser with stocks market icon. Vector.
Free with trial Decrease glowing style sales graph split illustration profit revenue, analysis forecast, growth decline decrease glowing style sales graph split. Decrease statistics illustrations Decrease glowing style sales graph split
Free with trial Bar chart graphic showing a downward trend with an orange arrow indicating decrease. Decrease statistics vectors Bar chart graphic showing a downward trend with an orange arrow indicating decrease
Free with trial This image features a large, three-dimensional red percentage symbol with a glossy finish against a neutral background. The symbol is prominently displayed in the center, emphasizing its importance. This type of visual is often used in contexts related to finance, sales, discounts, statistics, or growth metrics to immediately convey the concept of percentage increase or decrease. Decrease statistics illustrations Bold red percentage symbol on a plain background for financial or promotional use. This image features a large, three-dimensional red percentage symbol with a glossy finish against a neutral background. The symbol is prominently displayed in the center, emphasizing its importance. This type of visual is often used in contexts related to finance, sales, discounts, statistics, or growth metrics to immediately convey the concept of percentage increase or decrease
Free with trial The image features two circular arrows, one red and one green, pointing in opposite directions. The red arrow curves downward with a percentage symbol and a minus sign, indicating a decrease. The green arrow curves upward with a percentage symbol and a plus sign, indicating an increase. Both arrows are set against a plain background, emphasizing the contrast between the upward and downward trends. Decrease statistics vectors Opposing percentage arrows indicating increase and decrease with contrasting colors. The image features two circular arrows, one red and one green, pointing in. The image features two circular arrows, one red and one green, pointing in opposite directions. The red arrow curves downward with a percentage symbol and a minus sign, indicating a decrease. The green arrow curves upward with a percentage symbol and a plus sign, indicating an increase. Both arrows are set against a plain background, emphasizing the contrast between the upward and downward trends
Free with trial The image shows three green downward-pointing arrows, each containing a percentage symbol, suggesting a trend of decline, reduction, or decrease in percentage terms. The arrows are aligned horizontally and are uniformly styled, emphasizing a consistent downward direction. Decrease statistics vectors Three green downward arrows with percentage signs indicating a decline or decrease. The image shows three green downward-pointing arrows, each containing a percentage symbol, suggesting a trend of decline, reduction, or decrease in percentage terms. The arrows are aligned horizontally and are uniformly styled, emphasizing a consistent downward direction
Free with trial The image depicts a 3D bar graph with red bars, showing a clear downward trend. The bars decrease in height from left to right, indicating a significant decline in the measured data. An arrow points downwards, emphasizing the negative trend. Decrease statistics illustrations A downward trending graph illustrating a significant decrease in data points over time. The image depicts a 3D bar graph with red bars, showing a clear downward trend. The bars decrease in height from left to right, indicating a significant decline in the measured data. An arrow points downwards, emphasizing the negative trend
Free with trial The image shows three identical red downward-pointing arrows, each containing a white percentage symbol. These arrows are commonly used to visually represent a decrease, discount, reduction, or decline in percentages across various contexts such as finance, sales, or statistics. Decrease statistics illustrations Three downward arrows with percentage symbols indicating a decline or reduction trend. The image shows three identical red downward-pointing arrows, each containing a white percentage symbol. These arrows are commonly used to visually represent a decrease, discount, reduction, or decline in percentages across various contexts such as finance, sales, or statistics
Free with trial A 3D rendered graphic shows a bright blue arrow pointing downwards, symbolizing a decrease or decline. Attached to the shaft of the arrow is a pink circular badge with a white percentage sign (%) prominently displayed. The arrow and badge have a smooth, glossy finish. The entire composition is isolated against a clean white background, making it suitable for representing concepts related to sales. Decrease statistics illustrations Blue Downward Arrow with Pink Percentage Sign Badge on White Background decrease decline. A 3D rendered graphic shows a bright blue arrow pointing downwards, symbolizing a decrease or decline. Attached to the shaft of the arrow is a pink circular badge with a white percentage sign (%) prominently displayed. The arrow and badge have a smooth, glossy finish. The entire composition is isolated against a clean white background, making it suitable for representing concepts related to sales
Free with trial The image depicts a green arrow pointing downward with a white percentage symbol inside it, indicating a reduction or decrease in percentage terms, often used in financial, business, or economic contexts to represent discounts, declines, or reductions in value. Decrease statistics illustrations Green downward arrow symbolizing a percentage decrease in financial or economic contexts. The image depicts a green arrow pointing downward with a white percentage symbol inside it, indicating a reduction or decrease in percentage terms, often used in financial, business, or economic contexts to represent discounts, declines, or reductions in value
Free with trial Computer Screen Showing Downward Trend Graph in Red. Stock Market Decrease and Economic Problems. Decrease statistics vectors Computer Screen Showing Downward Trend Graph in Red. Stock Market Decrease and Economic Problems
Free with trial The image presents a comprehensive display of weekly trends through multiple graphs and charts. It features line graphs, bar charts, and other visual representations of data, each highlighting different aspects of trends and statistics. The use of various colors, including green, red, and blue, against a dark background with white text enhances the visual appeal and facilitates easy comprehension. This image was generated using artificial intelligence. Decrease statistics illustrations A collection of graphs and charts showcasing various weekly trends and statistics in a visually engaging format with multiple. The image presents a comprehensive display of weekly trends through multiple graphs and charts. It features line graphs, bar charts, and other visual representations of data, each highlighting different aspects of trends and statistics. The use of various colors, including green, red, and blue, against a dark background with white text enhances the visual appeal and facilitates easy comprehension. This image was generated using artificial intelligence.
Free with trial This image features a thick, red zigzag arrow pointing downward, commonly used to symbolize a decline, reduction, or negative trend in various contexts such as finance, statistics, or general communication. The arrow's sharp angles and bold color emphasize the downward movement effectively. Decrease statistics illustrations A bold downward zigzag arrow indicating a decline or decrease trend. isolated on white background. This image features a thick, red zigzag arrow pointing downward, commonly used to symbolize a decline, reduction, or negative trend in various contexts such as finance, statistics, or general communication. The arrow's sharp angles and bold color emphasize the downward movement effectively
Free with trial Declining Bar Graph with Arrow, Decreasing Statistics, Market Downturn, Financial Loss, Negative Trend. Decrease statistics vectors Declining Bar Graph with Arrow, Decreasing Statistics, Market Downturn, Financial Loss, Negative Trend
Free with trial Blue bar graph with a downward trending arrow and a red heart above, representing a decrease in love or affection. Decrease statistics vectors Blue bar graph showing decrease in love and affection. Blue bar graph with a downward trending arrow and a red heart above, representing a decrease in love or affection
Free with trial Black and white line graph showing decreasing population statistics over time. Decrease statistics vectors Line graph showing decreasing population statistics icon. Black and white line graph showing decreasing population statistics over time
Free with trial Finances statistics descending bars graphic outline icon in white and black colors. finances statistics descending bars graphic flat vector icon from business collection for web, mobile apps and ui. Decrease statistics vectors Finances statistics descending bars graphic outline icon in white and black colors. finances statistics descending bars graphic
Free with trial This image displays a grid of nine red percentage symbols, each paired with a directional arrow. The arrows point either upward, downward, or are neutral, indicating trends of increase, decrease, or no change respectively. The symbols are arranged in three rows and three columns, with each symbol and arrow combination repeated in different positions. Decrease statistics illustrations Collection of red percentage symbols with directional arrows indicating increase or decrease. This image displays a grid of nine red percentage symbols, each paired with a directional arrow. The arrows point either upward, downward, or are neutral, indicating trends of increase, decrease, or no change respectively. The symbols are arranged in three rows and three columns, with each symbol and arrow combination repeated in different positions
Free with trial Minus 5 percent decrease red arrow. Plus 10 percent increase green arrow. Economic indicators. Financial statistics. Business performance. Market fluctuations shown. Decrease statistics illustrations Red down arrow with minus 5 percent and green up arrow with plus 10 percent on white background. Minus 5 percent decrease red arrow. Plus 10 percent increase green arrow. Economic indicators. Financial statistics. Business performance. Market fluctuations shown
Free with trial Decreasing stacks of gold coins with red arrow pointing down and word Decrease. Economic recession concept. Business decline. Financial crisis. Market crash. Investment loss. Decrease statistics illustrations Decreasing stacks of gold coins with red arrow pointing down and word Decrease
Free with trial This vibrant image features a collection of colorful 3D bar graphs representing data trends, perfect for visualizing statistics in business presentations and analyses. Decrease statistics illustrations Colorful Bar Graph with 3D Shapes Representing Data Trends and Visualizing Statistics in Business and Finance Environments. This vibrant image features a collection of colorful 3D bar graphs representing data trends, perfect for visualizing statistics in business presentations and analyses
Free with trial This vibrant image features a collection of colorful 3D bar graphs representing data trends, perfect for visualizing statistics in business presentations and analyses. Decrease statistics illustrations Colorful Bar Graph with 3D Shapes Representing Data Trends and Visualizing Statistics in Business and Finance Environments. This vibrant image features a collection of colorful 3D bar graphs representing data trends, perfect for visualizing statistics in business presentations and analyses
Free with trial Four colorful bar charts are displayed on a graph, representing trends, statistics, and timeline data, with a potential focus on business infographics elements. Decrease statistics illustrations Four colorful bar charts are displayed on a graph, representing trends, statistics, and timeline data, with a potential
Free with trial Percentage sign set hand drawn. math calculation, finance statistics, increase decrease percentage sign vector sketch. isolated black illustration. Decrease statistics vectors Percentage sign set sketch hand drawn vector. percentage sign set hand drawn. math calculation, finance statistics, increase decrease percentage sign vector sketch. isolated black illustration
Free with trial Percentage sign set hand drawn. math calculation, finance statistics, increase decrease percentage sign vector sketch. isolated color illustration. Decrease statistics illustrations Percentage sign set sketch hand drawn vector. percentage sign set hand drawn. math calculation, finance statistics, increase decrease percentage sign vector sketch. isolated color illustration
Free with trial Percentage sign set hand drawn. math calculation, finance statistics, increase decrease percentage sign vector sketch. isolated color illustration. Decrease statistics vectors Percentage sign set sketch hand drawn vector. percentage sign set hand drawn. math calculation, finance statistics, increase decrease percentage sign vector sketch. isolated color illustration
Free with trial Percentage sign set hand drawn. math calculation, finance statistics, increase decrease percentage sign vector sketch. isolated black illustration. Decrease statistics illustrations Percentage sign set sketch hand drawn vector. percentage sign set hand drawn. math calculation, finance statistics, increase decrease percentage sign vector sketch. isolated black illustration
Free with trial Math percentage sign hand drawn. calculation finance, statistics increase, decrease ratio math percentage sign vector sketch. isolated color illustration. Decrease statistics illustrations Math percentage sign sketch hand drawn vector. math percentage sign hand drawn. calculation finance, statistics increase, decrease ratio math percentage sign vector sketch. isolated color illustration
Free with trial Math percentage sign hand drawn. calculation finance, statistics increase, decrease ratio math percentage sign vector sketch. isolated color illustration. Decrease statistics vectors Math percentage sign sketch hand drawn vector. math percentage sign hand drawn. calculation finance, statistics increase, decrease ratio math percentage sign vector sketch. isolated color illustration
Free with trial Math percentage sign hand drawn. calculation finance, statistics increase, decrease ratio math percentage sign vector sketch. isolated black illustration. Decrease statistics illustrations Math percentage sign sketch hand drawn vector. math percentage sign hand drawn. calculation finance, statistics increase, decrease ratio math percentage sign vector sketch. isolated black illustration
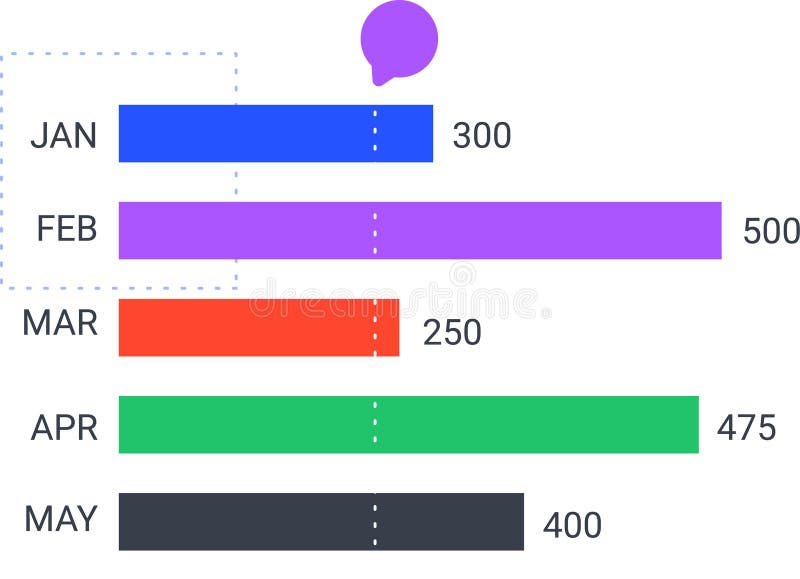
Free with trial Colorful horizontal bar chart is displaying monthly statistics from january to may, indicating trends and performance with a speech bubble above. Decrease statistics vectors Colorful horizontal bar chart is displaying monthly statistics from january to may, indicating trends and performance
Free with trial Chart bars down, icon in line design. Chart, bars, down, decrease, drop, decline, graph on white background vector. Chart bars down editable stroke icon. Decrease statistics vectors Chart bars down, icon in line design. Chart, bars, down, decrease, drop, decline, graph on white background vector
Free with trial Symbol percentage sign hand drawn. math calculation, finance statistics, increase decrease symbol percentage sign vector sketch. isolated color illustration. Decrease statistics illustrations Symbol percentage sign sketch hand drawn vector. symbol percentage sign hand drawn. math calculation, finance statistics, increase decrease symbol percentage sign vector sketch. isolated color illustration
Free with trial Symbol percentage sign hand drawn. math calculation, finance statistics, increase decrease symbol percentage sign vector sketch. isolated black illustration. Decrease statistics vectors Symbol percentage sign sketch hand drawn vector. symbol percentage sign hand drawn. math calculation, finance statistics, increase decrease symbol percentage sign vector sketch. isolated black illustration
Free with trial Finance percentage sign hand drawn. statistics increase, decrease ratio, proportion interest finance percentage sign vector sketch. isolated color illustration. Decrease statistics illustrations Finance percentage sign sketch hand drawn vector. finance percentage sign hand drawn. statistics increase, decrease ratio, proportion interest finance percentage sign vector sketch. isolated color illustration
Free with trial Finance percentage sign hand drawn. statistics increase, decrease ratio, proportion interest finance percentage sign vector sketch. isolated black illustration. Decrease statistics illustrations Finance percentage sign sketch hand drawn vector. finance percentage sign hand drawn. statistics increase, decrease ratio, proportion interest finance percentage sign vector sketch. isolated black illustration
Free with trial Finance percentage sign hand drawn. statistics increase, decrease ratio, proportion interest finance percentage sign vector sketch. isolated color illustration. Decrease statistics illustrations Finance percentage sign sketch hand drawn vector. finance percentage sign hand drawn. statistics increase, decrease ratio, proportion interest finance percentage sign vector sketch. isolated color illustration
Free with trial Colorful horizontal bar chart is displaying monthly statistics from january to may, indicating trends and performance with a speech bubble above. Decrease statistics vectors Colorful horizontal bar chart is displaying monthly statistics from january to may, indicating trends and performance
Free with trial Calculation percentage sign hand drawn. finance statistics, increase decrease, ratio proportion calculation percentage sign vector sketch. isolated color illustration. Decrease statistics illustrations Calculation percentage sign sketch hand drawn vector. calculation percentage sign hand drawn. finance statistics, increase decrease, ratio proportion calculation percentage sign vector sketch. isolated color illustration
Free with trial Calculation percentage sign hand drawn. finance statistics, increase decrease, ratio proportion calculation percentage sign vector sketch. isolated color illustration. Decrease statistics vectors Calculation percentage sign sketch hand drawn vector. calculation percentage sign hand drawn. finance statistics, increase decrease, ratio proportion calculation percentage sign vector sketch. isolated color illustration
Free with trial Calculation percentage sign hand drawn. finance statistics, increase decrease, ratio proportion calculation percentage sign vector sketch. isolated black illustration. Decrease statistics illustrations Calculation percentage sign sketch hand drawn vector. calculation percentage sign hand drawn. finance statistics, increase decrease, ratio proportion calculation percentage sign vector sketch. isolated black illustration
Free with trial Calculation percentage sign hand drawn. finance statistics, increase decrease, ratio proportion calculation percentage sign vector sketch. isolated color illustration. Decrease statistics illustrations Calculation percentage sign sketch hand drawn vector. calculation percentage sign hand drawn. finance statistics, increase decrease, ratio proportion calculation percentage sign vector sketch. isolated color illustration
Free with trial Stacked gold coins with a red arrow showing decrease. Concept of falling economy, financial crisis, inflation, bankruptcy, investment, decline, and economic downturn. Decrease statistics illustrations Stacked gold coins red arrow showing decrease concept of falling economy financial crisis inflation bankruptcy investment. Stacked gold coins with a red arrow showing decrease. Concept of falling economy, financial crisis, inflation, bankruptcy, investment, decline, and economic downturn
Free with trial Businessman Ted holding big red arrow pointing down. Financial loss, business downturn, negative result, decline and decrease concept. 3d vector people character. Cartoon minimal style. Decrease statistics vectors Businessman Ted holding big red arrow pointing down. Financial loss, business downturn, negative result, decline and decrease
Free with trial Set Mind map infographic, Pie chart, Cloud download and upload and Financial growth decrease icon. Vector. Decrease statistics vectors Set Mind map infographic, Pie chart, Cloud download and upload and Financial growth decrease icon. Vector
Free with trial Creative collage picture scissors cutting banknote cash hundred dollars statistics arrow decrease profit ciris recession devaluation. Decrease statistics illustrations Creative collage picture scissors cutting banknote cash hundred dollars statistics arrow decrease profit ciris recession
Free with trial Tree illustration with bar graph displaying decrease in carbon emissions from wood pellets, Generated by AI. Decrease statistics illustrations Tree illustration with bar graph displaying decrease in carbon emissions from wood pellets
Free with trial Tree illustration with bar graph displaying decrease in carbon emissions from wood pellets, Generated by AI. Decrease statistics illustrations Tree illustration with bar graph displaying decrease in carbon emissions from wood pellets
Free with trial Tree illustration with bar graph displaying decrease in carbon emissions from wood pellets, Generated by AI. Decrease statistics illustrations Tree illustration with bar graph displaying decrease in carbon emissions from wood pellets
Free with trial Tree illustration with bar graph displaying decrease in carbon emissions from wood pellets, Generated by AI. Decrease statistics illustrations Tree illustration with bar graph displaying decrease in carbon emissions from wood pellets
Free with trial A dynamic 3D illustration of a glossy red arrow pointing downwards in a jagged, volatile path. Isolated on a white background, this graphic icon is a powerful symbol for negative concepts. It represents decline, decrease, failure, loss, and crisis. This visual is perfect for illustrating stock market crashes, economic recession, financial downturns, poor business performance, or any downward trend in data and statistics. An ideal element for reports, presentations, and financial news, with ample copy space. Decrease statistics illustrations Red Jagged Arrow of Decline - Financial Crisis Concept. A dynamic 3D illustration of a glossy red arrow pointing downwards in a jagged, volatile path. Isolated on a white background, this graphic icon is a powerful symbol for negative concepts. It represents decline, decrease, failure, loss, and crisis. This visual is perfect for illustrating stock market crashes, economic recession, financial downturns, poor business performance, or any downward trend in data and statistics. An ideal element for reports, presentations, and financial news, with ample copy space.
Free with trial This image features two variations of a decreasing graph icon. One is an outline version, and the other is a solid black version. Both show a bar graph with descending bars and a curved arrow pointing downwards, symbolizing a decline or decrease. These icons are suitable for illustrating concepts like loss, recession, negative trends, or falling statistics in various contexts. Decrease statistics illustrations Decreasing Graph Icon Set. This image features two variations of a decreasing graph icon. One is an outline version, and the other is a solid black version. Both show a bar graph with descending bars and a curved arrow pointing downwards, symbolizing a decline or decrease. These icons are suitable for illustrating concepts like loss, recession, negative trends, or falling statistics in various contexts.
Free with trial Square icon with rounded edges featuring a red downward-trending bar graph on a white background. The graph has five bars of varying heights, each decreasing from left to right, with a red arrow descending across the tops of the bars. The icon is set against a plain gray background, highlighting the contrast between the red graph and the white square. The design suggests a decrease or decline in data or statistics, commonly used in business or financial contexts. Decrease statistics illustrations Square icon with rounded edges featuring a red downward-trending bar graph on a
Free with trial Generated with the use of AI. 3D graphic bar graph showing a declining trend, where the bars gradually decrease in height. The graph's surface is metallic, reflecting a somber environment. DEFLATION emphasizing economic downturn. Decrease statistics illustrations 3D graphic bar graph showing a declining trend where the bars gradually decrease in height. The graphs surface is metallic. Generated with the use of AI. 3D graphic bar graph showing a declining trend, where the bars gradually decrease in height. The graph's surface is metallic, reflecting a somber environment. DEFLATION emphasizing economic downturn
Free with trial A 3D rendered image of a large, glossy red arrow curving downwards on a clean, white background. The arrow's smooth, rounded shape and vibrant color create a sense of direction and emphasis. The image is suitable for illustrating concepts such as decline, decrease, failure, or downward trends in various contexts like finance, business, or statistics. Decrease statistics illustrations Red Arrow Pointing Downward. A 3D rendered image of a large, glossy red arrow curving downwards on a clean, white background. The arrow's smooth, rounded shape and vibrant color create a sense of direction and emphasis. The image is suitable for illustrating concepts such as decline, decrease, failure, or downward trends in various contexts like finance, business, or statistics.
Free with trial A simple and modern black silhouette icon of a business graph, isolated on a white background. This flat vector illustration combines a bar chart with an overlaid line graph, showing a fluctuating trend with a general decline. The graphic symbolizes concepts such as data analysis, financial reporting, market statistics, economic downturn, and business performance metrics. It's an ideal visual element for presentations, infographics, websites, and applications related to finance, economics, and analytics, representing concepts of decrease, loss, or market volatility. Decrease statistics vectors Business Data Analytics Chart Icon. A simple and modern black silhouette icon of a business graph, isolated on a white background. This flat vector illustration combines a bar chart with an overlaid line graph, showing a fluctuating trend with a general decline. The graphic symbolizes concepts such as data analysis, financial reporting, market statistics, economic downturn, and business performance metrics. It's an ideal visual element for presentations, infographics, websites, and applications related to finance, economics, and analytics, representing concepts of decrease, loss, or market volatility.
Free with trial A colored outline vector icon of a line graph showing a downward trend, indicating a decrease or decline. Represents financial trends, statistics, losses, or negative performance. Useful for finance, business reports, or data visualization showing reduction. Illustrates a declining value over time, vector design Generative AI. Decrease statistics vectors Decreasing Trend Stock Market Graph Vector, vector design Generative AI. A colored outline vector icon of a line graph showing a downward trend, indicating a decrease or decline. Represents financial trends, statistics, losses, or negative performance. Useful for finance, business reports, or data visualization showing reduction. Illustrates a declining value over time, vector design Generative AI
Free with trial Long, three dimensional arrow pointing downwards, symbolizing a decrease or decline. Decrease statistics illustrations Isometric arrow pointing down representing decrease. Long, three dimensional arrow pointing downwards, symbolizing a decrease or decline
Free with trial People discussing progress report. Colleagues analysing charts and graphs with statistical data. Employees during presentation of business results. Teamwork with financial statistics, office meeting. Decrease statistics vectors Teamwork with financial statistics, office meeting. Employees during business presentation. People discussing progress report. Colleagues analysing charts and graphs with statistical data. Employees during presentation of business results. Teamwork with financial statistics, office meeting
Free with trial A vector icon depicting a line chart with a downward trend. Represents decline, decrease, negative trend, or falling statistics. Useful for finance apps, business reports, stock market monitoring, or visualizing negative data changes, vector design Generative AI. Decrease statistics vectors Decreasing Line Chart Icon Vector Illustration, vector design Generative AI. A vector icon depicting a line chart with a downward trend. Represents decline, decrease, negative trend, or falling statistics. Useful for finance apps, business reports, stock market monitoring, or visualizing negative data changes, vector design Generative AI
Free with trial Line art icon of a flip chart showing a graph with decreasing statistics, concept for business failure. Decrease statistics vectors Flip chart showing decreasing statistics on whiteboard. Line art icon of a flip chart showing a graph with decreasing statistics, concept for business failure
Free with trial Statistics icon set, bar diagram illustration, business graph logo icon vector. Decrease statistics vectors Statistics icon set, bar diagram illustration, business graph logo icon vector
Free with trial Report statistics line icon. Neumorphic, Green gradient, 3d pin buttons. Column graph sign. Growth diagram symbol. Line icons. Neumorphic buttons with outline signs. Vector. Decrease statistics vectors Report statistics line icon. Column graph sign. Line icons. Vector. Report statistics line icon. Neumorphic, Green gradient, 3d pin buttons. Column graph sign. Growth diagram symbol. Line icons. Neumorphic buttons with outline signs. Vector
Free with trial Line chart going down on a website, showing a negative trend in statistics. Decrease statistics illustrations Website showing a graph representing decreasing statistics. Line chart going down on a website, showing a negative trend in statistics
Free with trial Decrease isolated on transparent background. Decrease statistics illustrations Decrease on transparent background. Decrease isolated on transparent background
Free with trial Statistics line icon. Neumorphic, Blue gradient, 3d pin buttons. Column chart sign. Growth graph diagram symbol. Line icons. Neumorphic buttons with outline signs. Vector. Decrease statistics illustrations Statistics line icon. Column graph chart sign. Line icons. Vector. Statistics line icon. Neumorphic, Blue gradient, 3d pin buttons. Column chart sign. Growth graph diagram symbol. Line icons. Neumorphic buttons with outline signs. Vector
Free with trial Statistics line icon. Neumorphic, Blue gradient, 3d pin buttons. Column chart sign. Growth graph diagram symbol. Line icons. Neumorphic buttons with outline signs. Vector. Decrease statistics vectors Statistics line icon. Column graph chart sign. Line icons. Vector. Statistics line icon. Neumorphic, Blue gradient, 3d pin buttons. Column chart sign. Growth graph diagram symbol. Line icons. Neumorphic buttons with outline signs. Vector
Free with trial Diagram chart line icon. Neumorphic, Flat shadow, 3d buttons. Statistics timer sign. Market analytics symbol. Line statistics timer icon. Social media icons. Vector. Decrease statistics vectors Diagram chart line icon. Statistics timer sign. Neumorphic buttons. Vector. Diagram chart line icon. Neumorphic, Flat shadow, 3d buttons. Statistics timer sign. Market analytics symbol. Line statistics timer icon. Social media icons. Vector
Free with trial Blue downward arrow, circular user avatar, abstract line, and curve visuals. Ideal for analytics, statistics, loss, user activity disengagement performance digital trends. Clean flat metaphor. Decrease statistics illustrations Downward Arrow and User Avatar Representing Decline or Decrease in User Activity. Blue downward arrow, circular user avatar, abstract line, and curve visuals. Ideal for analytics, statistics, loss, user activity disengagement performance digital trends. Clean flat metaphor
Free with trial Calculator alongside arrows indicating increase and decrease, and a line graph with fluctuations. Ideal for finance, budgeting, economics, analysis, statistics, decision-making, simple flat metaphor. Decrease statistics illustrations Calculator with Arrows and Graph Representing Financial Analysis and Data Trends. Calculator alongside arrows indicating increase and decrease, and a line graph with fluctuations. Ideal for finance, budgeting, economics, analysis, statistics, decision-making, simple flat metaphor
Free with trial Report statistics line icon. Halftone dotted pattern. Gradient icon with grain shadow. Column graph sign. Growth diagram symbol. Line report statistics icon. Various designs. Vector. Decrease statistics vectors Report statistics line icon. Column graph sign. Halftone dotted pattern. Vector. Report statistics line icon. Halftone dotted pattern. Gradient icon with grain shadow. Column graph sign. Growth diagram symbol. Line report statistics icon. Various designs. Vector
Free with trial Steep downward trending line graph red arrow decrease devaluation Can be customized to fit various themes and styles. Decrease statistics illustrations Steep downward trending line graph, red arrow , decrease, devaluation. Steep downward trending line graph red arrow decrease devaluation Can be customized to fit various themes and styles
Free with trial Presentation board with decreasing bar graph for business statistics. Decrease statistics vectors Presentation board with decreasing bar graph for business statistics
Free with trial Percentage sign set hand drawn. math calculation, finance statistics, increase decrease percentage sign vector sketch. isolated black illustration. Decrease statistics illustrations Percentage sign set sketch hand drawn vector. percentage sign set hand drawn. math calculation, finance statistics, increase decrease percentage sign vector sketch. isolated black illustration
Free with trial Decline bar chart with downward trend arrow outline icon. Decrease, loss, and financial drop symbol vector. Decrease statistics vectors Decline bar chart with downward trend arrow outline icon. Decrease, loss, and financial drop symbol
Free with trial Report statistics line icon. Neumorphic, Flat shadow, 3d buttons. Column graph sign. Growth diagram symbol. Line report statistics icon. Social media icons. Vector. Decrease statistics illustrations Report statistics line icon. Column graph sign. Neumorphic buttons. Vector. Report statistics line icon. Neumorphic, Flat shadow, 3d buttons. Column graph sign. Growth diagram symbol. Line report statistics icon. Social media icons. Vector
Free with trial Report statistics line icon. Neumorphic, Flat shadow, 3d buttons. Column graph sign. Growth diagram symbol. Line report statistics icon. Social media icons. Vector. Decrease statistics illustrations Report statistics line icon. Column graph sign. Neumorphic buttons. Vector. Report statistics line icon. Neumorphic, Flat shadow, 3d buttons. Column graph sign. Growth diagram symbol. Line report statistics icon. Social media icons. Vector
Free with trial Math percentage sign hand drawn. calculation finance, statistics increase, decrease ratio math percentage sign vector sketch. isolated black illustration. Decrease statistics vectors Math percentage sign sketch hand drawn vector. math percentage sign hand drawn. calculation finance, statistics increase, decrease ratio math percentage sign vector sketch. isolated black illustration
Free with trial Math percentage sign hand drawn. calculation finance, statistics increase, decrease ratio math percentage sign vector sketch. isolated black illustration. Decrease statistics illustrations Math percentage sign sketch hand drawn vector. math percentage sign hand drawn. calculation finance, statistics increase, decrease ratio math percentage sign vector sketch. isolated black illustration