Free with trial Math percentage sign hand drawn. calculation finance, statistics increase, decrease ratio math percentage sign vector sketch. isolated color illustration. Decrease statistics illustrations Math percentage sign sketch hand drawn vector. math percentage sign hand drawn. calculation finance, statistics increase, decrease ratio math percentage sign vector sketch. isolated color illustration
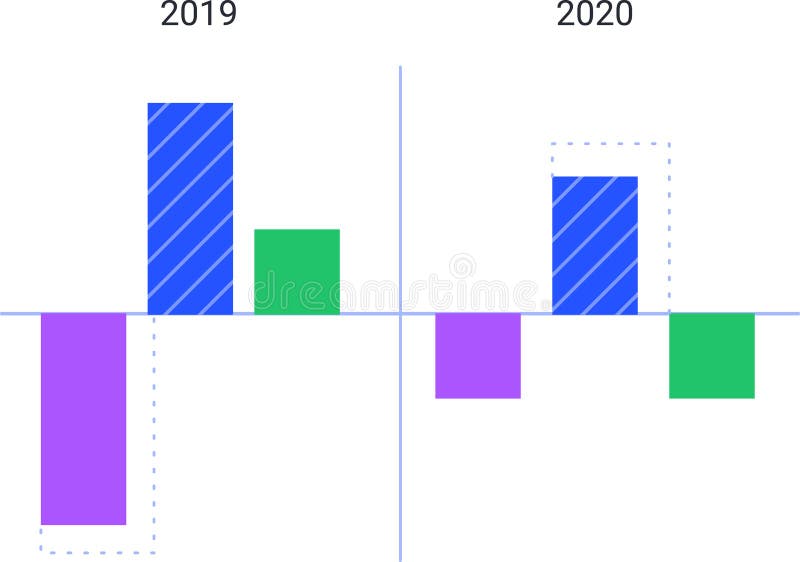
Free with trial Colorful bar charts are comparing data from 2019 and 2020, visualizing trends and statistics with positive and negative values represented by upward and downward bars. Decrease statistics illustrations Colorful bar charts are comparing data from 2019 and 2020, visualizing trends and statistics with positive and negative
Free with trial Line graph with a downward slope representing a decrease or drop in value. Decrease statistics vectors Arrow line falling diagram. Line graph with a downward slope representing a decrease or drop in value.
Free with trial A black outline graphic of a line trending downwards. This icon represents decline, decrease, negative trends, statistics, analysis, or negative performance in a simple graphic outline style, suitable for financial, business, or statistical visuals. , vector design Generative AI. Decrease statistics vectors Outline graphic of a downward sloping line, symbolizing decline trends , vector design Generative AI. A black outline graphic of a line trending downwards. This icon represents decline, decrease, negative trends, statistics, analysis, or negative performance in a simple graphic outline style, suitable for financial, business, or statistical visuals. , vector design Generative AI
Free with trial Business decline bar chart icon with long shadow. Decrease, loss, and financial collapse sign symbol vector. Decrease statistics vectors Business decline bar chart icon with long shadow. Decrease, loss, and financial collapse sign symbol
Free with trial Statistics line icon. Continuous line with share plane. Column chart sign. Growth graph diagram symbol. 3d star in speech bubble. Graph chart single line ribbon. Loop curve pattern. Vector. Decrease statistics illustrations Statistics line icon. Column graph chart sign. Continuous line with plane. Vector. Statistics line icon. Continuous line with share plane. Column chart sign. Growth graph diagram symbol. 3d star in speech bubble. Graph chart single line ribbon. Loop curve pattern. Vector
Free with trial Statistics line icon. Continuous line with share plane. Column chart sign. Growth graph diagram symbol. 3d star in speech bubble. Graph chart single line ribbon. Loop curve pattern. Vector. Decrease statistics illustrations Statistics line icon. Column graph chart sign. Continuous line with plane. Vector. Statistics line icon. Continuous line with share plane. Column chart sign. Growth graph diagram symbol. 3d star in speech bubble. Graph chart single line ribbon. Loop curve pattern. Vector
Free with trial Symbol percentage sign hand drawn. math calculation, finance statistics, increase decrease symbol percentage sign vector sketch. isolated black illustration. Decrease statistics illustrations Symbol percentage sign sketch hand drawn vector. symbol percentage sign hand drawn. math calculation, finance statistics, increase decrease symbol percentage sign vector sketch. isolated black illustration
Free with trial Symbol percentage sign hand drawn. math calculation, finance statistics, increase decrease symbol percentage sign vector sketch. isolated color illustration. Decrease statistics illustrations Symbol percentage sign sketch hand drawn vector. symbol percentage sign hand drawn. math calculation, finance statistics, increase decrease symbol percentage sign vector sketch. isolated color illustration
Free with trial Symbol percentage sign hand drawn. math calculation, finance statistics, increase decrease symbol percentage sign vector sketch. isolated color illustration. Decrease statistics vectors Symbol percentage sign sketch hand drawn vector. symbol percentage sign hand drawn. math calculation, finance statistics, increase decrease symbol percentage sign vector sketch. isolated color illustration
Free with trial Symbol percentage sign hand drawn. math calculation, finance statistics, increase decrease symbol percentage sign vector sketch. isolated black illustration. Decrease statistics illustrations Symbol percentage sign sketch hand drawn vector. symbol percentage sign hand drawn. math calculation, finance statistics, increase decrease symbol percentage sign vector sketch. isolated black illustration
Free with trial A 3D illustration featuring a bar chart with four ascending blue bars of varying heights, representing data growth. To the right of the chart are two white arrows, one pointing upwards and the other downwards, symbolizing increase and decrease respectively. The entire graphic is presented on a clean white background. Decrease statistics illustrations 3D Bar Chart with Up and Down Arrows on White Background graph statistics. A 3D illustration featuring a bar chart with four ascending blue bars of varying heights, representing data growth. To the right of the chart are two white arrows, one pointing upwards and the other downwards, symbolizing increase and decrease respectively. The entire graphic is presented on a clean white background
Free with trial Finance percentage sign hand drawn. statistics increase, decrease ratio, proportion interest finance percentage sign vector sketch. isolated color illustration. Decrease statistics vectors Finance percentage sign sketch hand drawn vector. finance percentage sign hand drawn. statistics increase, decrease ratio, proportion interest finance percentage sign vector sketch. isolated color illustration
Free with trial Finance percentage sign hand drawn. statistics increase, decrease ratio, proportion interest finance percentage sign vector sketch. isolated black illustration. Decrease statistics vectors Finance percentage sign sketch hand drawn vector. finance percentage sign hand drawn. statistics increase, decrease ratio, proportion interest finance percentage sign vector sketch. isolated black illustration
Free with trial Finance percentage sign hand drawn. statistics increase, decrease ratio, proportion interest finance percentage sign vector sketch. isolated black illustration. Decrease statistics illustrations Finance percentage sign sketch hand drawn vector. finance percentage sign hand drawn. statistics increase, decrease ratio, proportion interest finance percentage sign vector sketch. isolated black illustration
Free with trial A vector icon of a line graph showing a downward trend with a red arrow. Represents decline, loss, negative performance, or decreasing statistics. Useful for financial reports, business analytics, or illustrating unfavorable trends. Clear visual for decrease, vector design Generative AI. Decrease statistics vectors Downward Trend Line Graph Vector Icon for Decline Loss, vector design Generative AI. A vector icon of a line graph showing a downward trend with a red arrow. Represents decline, loss, negative performance, or decreasing statistics. Useful for financial reports, business analytics, or illustrating unfavorable trends. Clear visual for decrease, vector design Generative AI
Free with trial Falling bar chart with a downward trending line and arrow indicating decrease. Decrease statistics vectors Falling bar chart with a downward trending line and arrow indicating decrease
Free with trial Hand drawn bar chart illustration showing data statistics and business growth. Decrease statistics vectors Hand drawn bar chart illustration showing data statistics and business growth
Free with trial Modern abstract blue bars illustrating business statistics, trends, and analytics. Decrease statistics vectors Digital data analysis bars in blue hues, conceptualizing statistics and trends. Modern abstract blue bars illustrating business statistics, trends, and analytics.
Free with trial Decline bar chart with downward trend arrow icon vector. Decrease, loss, and financial drop symbol on circle line. Decrease statistics vectors Decline bar chart with downward trend arrow icon. Decrease, loss, and financial drop symbol on circle line
Free with trial Calculation percentage sign hand drawn. finance statistics, increase decrease, ratio proportion calculation percentage sign vector sketch. isolated black illustration. Decrease statistics vectors Calculation percentage sign sketch hand drawn vector. calculation percentage sign hand drawn. finance statistics, increase decrease, ratio proportion calculation percentage sign vector sketch. isolated black illustration
Free with trial Calculation percentage sign hand drawn. finance statistics, increase decrease, ratio proportion calculation percentage sign vector sketch. isolated black illustration. Decrease statistics illustrations Calculation percentage sign sketch hand drawn vector. calculation percentage sign hand drawn. finance statistics, increase decrease, ratio proportion calculation percentage sign vector sketch. isolated black illustration
Free with trial Sharp downward sloping line graph red arrow pointing down statistics dip trend Can be used as a banner or header image. Decrease statistics illustrations Sharp downward sloping line graph, red arrow pointing down, statistics, dip, trend. Sharp downward sloping line graph red arrow pointing down statistics dip trend Can be used as a banner or header image
Free with trial Declining bar chart with downward trend line, showing decrease and financial loss. Decrease statistics vectors Declining bar chart with downward trend line, showing decrease and financial loss
Free with trial Wooden block with a downward arrow symbol, representing a decline or decrease, sits on a rustic wooden surface. Decrease statistics illustrations Wooden block with an arrow symbol pointing down represents a decrease or decline. wooden block with a downward arrow symbol, representing a decline or decrease, sits on a rustic wooden surface.
Free with trial Decline bar chart with downward trend arrow icon vector. Decrease, loss, and financial crisis symbol in black circle. Decrease statistics vectors Decline bar chart with downward trend arrow icon. Decrease, loss, and financial crisis symbol in black circle
Free with trial Five oil barrels of varying sizes are arranged in a declining order. A bold orange arrow points downward, symbolizing a decrease in oil prices, illustrating market dynamics. Decrease statistics illustrations Art collage, Oil barrel sizes decrease, reflecting energy market trends and price fluctuations. Five oil barrels of varying sizes are arranged in a declining order. A bold orange arrow points downward, symbolizing a decrease in oil prices, illustrating market dynamics
Free with trial Downward trend bar chart with arrow showing financial economic decline loss decrease. Decrease statistics vectors Downward trend bar chart with arrow showing financial economic decline loss decrease
Free with trial Bar chart with descending arrow showing a significant decrease in data or performance. Decrease statistics vectors Bar chart with descending arrow showing a significant decrease in data or performance
Free with trial Tree graphic with bar graph displaying decrease in carbon emissions from wood pellets, Generated by AI. Decrease statistics illustrations Tree graphic with bar graph displaying decrease in carbon emissions from wood pellets
Free with trial Set line Financial growth decrease, Arrow, Pie chart infographic and Factory icon. Vector. Decrease statistics illustrations Set line Financial growth decrease, Arrow, Pie chart infographic and Factory icon. Vector
Free with trial This graphic illustrates various colorful bars and shapes representing data trends and statistics in a bold, abstract style. Decrease statistics illustrations Colorful abstract data visualization with bars, lines, and circles depicting trends and statistics. This graphic illustrates various colorful bars and shapes representing data trends and statistics in a bold, abstract style.
Free with trial A character is grasping a big red arrow that points downward, symbolizing decline or decrease against a plain white backdrop. Decrease statistics illustrations Character Holding a Large Red Downward Arrow on a White Background Indicating Decline or Decrease. A character is grasping a big red arrow that points downward, symbolizing decline or decrease against a plain white backdrop
Free with trial Sad businessman with graphs. Young guy evaluates statistics and infographics. Economic depression and recession. Entrepreneur with bankruptcy. Cartoon vector illustration isolated on white background. Decrease statistics vectors Sad businessman with graphs. Young guy evaluates statistics and infographics. Economic depression and recession
Free with trial Tariffs word with downward arrows showing falling trade taxes decrease. Tariffs background. Decrease statistics vectors Tariffs word with downward arrows showing falling trade taxes decrease. Green background. Tariffs word with downward arrows showing falling trade taxes decrease. Tariffs background. Tariffs word with downward arrows showing falling trade taxes decrease. Tariffs background
Free with trial Sketch image artwork composite photo collage of budget finance savings bank decrease loss money arrow down young lady hold support coins. Decrease statistics illustrations Sketch image artwork composite photo collage of budget finance savings bank decrease loss money arrow down young lady
Free with trial Creative collage picture young businesspeople money economy recession inflation golden coin bankruptcy stocks decrease drawing background. Decrease statistics illustrations Creative collage picture young businesspeople money economy recession inflation golden coin bankruptcy stocks decrease
Free with trial Vertical poster collage mature woman entrepreneur charts statistics hand body fragment pointing finger recession crisis loss. Decrease statistics illustrations Vertical poster collage mature woman entrepreneur charts statistics hand body fragment pointing finger recession crisis
Free with trial Close up magnifying glass on red spreadsheet cells economic slump downward trend statistics downturn Ideal for websites and social media. Decrease statistics illustrations Close up magnifying glass on red spreadsheet cells, economic slump, downward trend, statistics, downturn. Close up magnifying glass on red spreadsheet cells economic slump downward trend statistics downturn Ideal for websites and social media
Free with trial Bar Chart Decline Line And Solid Icon Set. Financial Loss, Economic Downturn, And Business Performance Decrease Symbol Collection. Data Analysis And Market Trends. Isolated Vector Illustration. Decrease statistics vectors Bar Chart Decline Line And Solid Icon Set. Financial Loss, Economic Downturn, And Business Performance Decrease Symbol
Free with trial Colorful Bar Graph Showing Decrease with a Yellow Arrow Signifying a Downward Trend in Financial Performance. Decrease statistics vectors Colorful Bar Graph Showing Decrease with a Yellow Arrow Signifying a Downward Trend in Financial Performance
Free with trial Set line Financial growth decrease, Stacks paper money cash, Pie chart infographic and Pos terminal icon. Vector. Decrease statistics illustrations Set line Financial growth decrease, Stacks paper money cash, Pie chart infographic and Pos terminal icon. Vector
Free with trial Set line Financial growth decrease Arrow Pie chart infographic Many ways directional arrow Pyramid infographics and Graph chart diagram icon. Vector. Decrease statistics illustrations Set line Financial growth decrease, Arrow, Pie chart infographic, Many ways directional arrow, Pyramid infographics, and. Set line Financial growth decrease Arrow Pie chart infographic Many ways directional arrow Pyramid infographics and Graph chart diagram icon. Vector.
Free with trial Set Search data analysis, Pie chart infographic, Calculator, Financial growth decrease, with folder, and icon. Vector. Decrease statistics vectors Set Search data analysis, Pie chart infographic, Calculator, Financial growth decrease, with folder, and icon. Vector
Free with trial Set line Graph, chart, diagram, Pie infographic, Financial growth decrease and icon. Vector. Decrease statistics vectors Set line Graph, chart, diagram, Pie infographic, Financial growth decrease and icon. Vector
Free with trial A digital hand displays an illuminated financial growth graph with various statistics against a dark city backdrop, emphasizing technology in data analysis and investment trends. Scalp. Decrease statistics illustrations Digital hand presenting glowing financial growth graph with statistics and global connectivity showcasing data analytics. A digital hand displays an illuminated financial growth graph with various statistics against a dark city backdrop, emphasizing technology in data analysis and investment trends. Scalp
Free with trial Headset with microphone audio decrease chart concept for support service and call center decrease, falling data information trend. Decrease statistics vectors Headset with microphone audio decrease chart concept for support service and call center decrease, falling data information trend
Free with trial Red bar graph shows decline with downward arrow, representing financial loss. Business failure reduced performance or decrease of value. Negative trend report. Decrease statistics illustrations Red bar graph shows decline with downward arrow, representing financial loss. Business failure, reduced performance or decrease. Red bar graph shows decline with downward arrow, representing financial loss. Business failure reduced performance or decrease of value. Negative trend report.
Free with trial Set Financial growth decrease Sales funnel with chart and Pie infographic icon. Vector. Decrease statistics vectors Set Financial growth decrease, Sales funnel with chart and Pie infographic icon. Vector
Free with trial Set Data analysis, Financial growth decrease, Search data and Pie chart infographic icon. Vector. Decrease statistics vectors Set Data analysis, Financial growth decrease, Search data and Pie chart infographic icon. Vector
Free with trial Tree illustration with bar graph displaying decrease in carbon emissions from wood pellets, Generated by AI. Decrease statistics illustrations Tree illustration with bar graph displaying decrease in carbon emissions from wood pellets
Free with trial Tree illustration with bar graph displaying decrease in carbon emissions from wood pellets, Generated by AI. Decrease statistics illustrations Tree illustration with bar graph displaying decrease in carbon emissions from wood pellets
Free with trial Colorful bar charts are comparing data from 2019 and 2020, visualizing trends and statistics with positive and negative values represented by upward and downward bars. Decrease statistics vectors Colorful bar charts are comparing data from 2019 and 2020, visualizing trends and statistics with positive and negative
Free with trial Set Mountains with flag Financial growth decrease Dollar symbol Pie chart infographic Intersection point Arrow and icon. Vector. Decrease statistics illustrations Set Mountains with flag, Financial growth decrease, Dollar symbol, Pie chart infographic, Intersection point, Arrow, and. Set Mountains with flag Financial growth decrease Dollar symbol Pie chart infographic Intersection point Arrow and icon. Vector.
Free with trial This minimal illustration depicts a business stock exchange downturn. The vector concept uses a red arrow symbol to represent a market crash, financial loss, and a minimalist decrease in value. Decrease statistics vectors Minimal Vector Concept of a Business Stock Exchange Market Downturn and Financial Crash Symbol Illustration. This minimal illustration depicts a business stock exchange downturn. The vector concept uses a red arrow symbol to represent a market crash, financial loss, and a minimalist decrease in value.
Free with trial Downward trend, schematic chart. Declining red line graph depicting a downward trend with fluctuations, indicating decrease over time. Greatly simplified symbol of downturn, falling, and loss. Vector. Decrease statistics vectors Downward trend, schematic chart, symbol of loss. Downward trend, schematic chart. Declining red line graph depicting a downward trend with fluctuations, indicating decrease over time. Greatly simplified symbol of downturn, falling, and loss. Vector
Free with trial Line icon of decreasing chart representing reduced productivity, low performance, and efficiency decline. Suitable for business, work, stress, and health related topics. Decrease statistics vectors Reduced Productivity Icon Decrease Performance Efficiency Decline Symbol. Line icon of decreasing chart representing reduced productivity, low performance, and efficiency decline. Suitable for business, work, stress, and health related topics.
Free with trial Line icon of decreasing chart representing reduced productivity, low performance, and efficiency decline. Suitable for business, work, stress, and health related topics. Decrease statistics vectors Reduced Productivity Icon Decrease Performance Efficiency Decline Symbol black. Line icon of decreasing chart representing reduced productivity, low performance, and efficiency decline. Suitable for business, work, stress, and health related topics.
Free with trial Downward line chart representing consistent decrease in financial metrics. Decrease statistics vectors Downward chart line trend. Downward line chart representing consistent decrease in financial metrics.
Free with trial Chart arrows up and down. Green and red arrows. Decrease and increase graph vector illustration. Decrease statistics vectors Chart arrows set. Chart arrows up and down. Green and red arrows. Decrease and increase graph vector illustration
Free with trial This striking graphic illustrates a significant economic downturn or market crash with a bold red arrow plunging downwards. Rendered by Ai, the image uses simple colors to maximize impact setting the alarming decline against subtle background charts. It effectively communicates concepts of loss decrease and a strong negative trend in business metrics. Decrease statistics illustrations Red arrow showing sharp financial market decline. This striking graphic illustrates a significant economic downturn or market crash with a bold red arrow plunging downwards. Rendered by Ai, the image uses simple colors to maximize impact setting the alarming decline against subtle background charts. It effectively communicates concepts of loss decrease and a strong negative trend in business metrics
Free with trial A simple black icon featuring a house symbol over a bar graph showing a downward trend, indicating a decrease in. Decrease statistics illustrations Downward trend graph with house icon. A simple black icon featuring a house symbol over a bar graph showing a downward trend, indicating a decrease in.
Free with trial A cartoon woman with brown hair in a ponytail, wearing a blue shirt and red pants, stands confidently between two bar graphs. The green graph on the left shows an increase, while the purple graph on the right shows a decrease. The image is a simple, illustrative representation of data analysis or business concepts. Decrease statistics vectors Woman Standing Between Two Bar Graphs. A cartoon woman with brown hair in a ponytail, wearing a blue shirt and red pants, stands confidently between two bar graphs. The green graph on the left shows an increase, while the purple graph on the right shows a decrease. The image is a simple, illustrative representation of data analysis or business concepts.
Free with trial A minimalist, black and white graphic representing a downward trend. A thick, bold arrow points diagonally down and to the right, symbolizing a decline. Below it, a jagged, irregular line graph mirrors this downward trajectory, depicting volatility and a general decrease. This imagery is ideal for illustrating financial losses, market downturns, negative performance, or any concept of falling or decreasing values. Decrease statistics vectors Down Trend Arrow and Jagged Line Graph. A minimalist, black and white graphic representing a downward trend. A thick, bold arrow points diagonally down and to the right, symbolizing a decline. Below it, a jagged, irregular line graph mirrors this downward trajectory, depicting volatility and a general decrease. This imagery is ideal for illustrating financial losses, market downturns, negative performance, or any concept of falling or decreasing values.
Free with trial Vibrant vector illustration featuring business data charts and graphs, including bar graphs, line graphs, pie charts, and a roller coaster metaphor for market trends. This eye-catching design is perfect for presentations, infographics, and financial reports. Decrease statistics illustrations Business Data Charts Graphs Vector Illustration, Statistics. Vibrant vector illustration featuring business data charts and graphs, including bar graphs, line graphs, pie charts, and a roller coaster metaphor for market trends. This eye-catching design is perfect for presentations, infographics, and financial reports.
Free with trial Bar graph with varying heights beside a line chart with rising and falling pattern on a grid. Ideal for business analysis, statistics, metrics, trends, presentation, infographics, simple flat. Decrease statistics illustrations Data Visualization with Bar Graph and Line Chart in Minimalist Design. Bar graph with varying heights beside a line chart with rising and falling pattern on a grid. Ideal for business analysis, statistics, metrics, trends, presentation, infographics, simple flat
Free with trial Chart with rising and falling trends on a grid board alongside a smaller cloud-connected line graph. Ideal for analytics, data analysis, statistics, forecasting, technology, research. Decrease statistics illustrations Data Analytics Visualization with Graphs and Cloud Integration Concept. Chart with rising and falling trends on a grid board alongside a smaller cloud-connected line graph. Ideal for analytics, data analysis, statistics, forecasting, technology, research
Free with trial A black bar chart graph with a falling arrow on a white background, indicating decline and decrease in data or business performance. Scalable format print and digital media. and projects. Decrease statistics vectors Black bar chart graph with falling arrow decline. A black bar chart graph with a falling arrow on a white background, indicating decline and decrease in data or business performance. Scalable format print and digital media. and projects
Free with trial Simple black vector icons depict an upward arrow with a percentage sign and a downward arrow with a percentage sign, symbolizing financial growth and decline in a flat design. Decrease statistics vectors Black percentage increase and decrease icons. Simple black vector icons depict an upward arrow with a percentage sign and a downward arrow with a percentage sign, symbolizing financial growth and decline in a flat design
Free with trial Bar chart icon showing three declining bars within a circular interface, symbolizing decreasing data, analytical trends, and financial performance concepts. Decrease statistics vectors Decreasing bar chart data analysis statistics icon. Bar chart icon showing three declining bars within a circular interface, symbolizing decreasing data, analytical trends, and financial performance concepts
Free with trial Woman working on laptop atop bar graph, large downward arrow symbolizing decrease, airplane highlighting travel or aviation. Ideal for business trends, travel industry, finance, productivity. Decrease statistics vectors Woman with Laptop Sitting on Bar Graph with Downward Arrow and Airplane in Blue Circle. Woman working on laptop atop bar graph, large downward arrow symbolizing decrease, airplane highlighting travel or aviation. Ideal for business trends, travel industry, finance, productivity
Free with trial A blue bar chart with four bars of decreasing height and a large blue downward arrow on the left side, indicating a decline or decrease in value. Scalable format print and digital media. Decrease statistics vectors Decreasing bar chart with downward arrow blue graph. A blue bar chart with four bars of decreasing height and a large blue downward arrow on the left side. A blue bar chart with four bars of decreasing height and a large blue downward arrow on the left side, indicating a decline or decrease in value. Scalable format print and digital media
Free with trial Minimalist red arrow icon for direction or business statistics. Decrease statistics illustrations Red 3d arrow pointing down on a bright red background. Minimalist red arrow icon for direction or business statistics.
Free with trial Minimalistic human head profile alongside descending bar chart, showcasing analysis, statistics, and progress trends. Ideal for business, evaluation, decision-making, trends, growth performance. Decrease statistics illustrations Human Profile Beside Downward Bar Chart Representing Analytics and Performance Trends. Minimalistic human head profile alongside descending bar chart, showcasing analysis, statistics, and progress trends. Ideal for business, evaluation, decision-making, trends, growth performance
Free with trial Bar chart with descending bars and dashed arrow illustrating decline in value or trend analysis. Ideal for business, finance, economy, performance, forecasting, data, and growth planning. Simple flat. Decrease statistics illustrations Declining Bar Chart with Dashed Arrow Representing Decrease and Trend Analysis. Bar chart with descending bars and dashed arrow illustrating decline in value or trend analysis. Ideal for business, finance, economy, performance, forecasting, data, and growth planning. Simple flat
Free with trial A versatile set of black and white vector icons depicting financial growth, decline, and market trends. Perfect for business, analytics, and finance presentations. Decrease statistics vectors Set of increase and decrease financial data icons. A versatile set of black and white vector icons depicting financial growth, decline, and market trends. Perfect for business, analytics, and finance presentations
Free with trial Gear mechanism showing a large downward arrow surrounded by smaller blue figures, illustrating a concept of decline, decrease, or negative trend within a system or process. Decrease statistics vectors Economic downfall concept with downward arrow in gear. Gear mechanism showing a large downward arrow surrounded by smaller blue figures, illustrating a concept of decline, decrease, or negative trend within a system or process
Free with trial Line graph illustrating data analysis and business statistics, charting financial growth, market changes, and performance metrics for visual information and infographic content. Decrease statistics illustrations Analyzing data with line graph showing business trends. Line graph illustrating data analysis and business statistics, charting financial growth, market changes, and performance metrics for visual information and infographic content
Free with trial A diverse set of graphic icons representing financial growth, decline, and market trends with clear up and down arrows, bar charts, and coin stacks. Flat design. Decrease statistics vectors Collection of colorful increase and decrease icons. A diverse set of graphic icons representing financial growth, decline, and market trends with clear up and down arrows, bar charts, and coin stacks. Flat design
Free with trial Financial Loss line icon with dollar symbol and downward arrow. Outline vector icon, sign representing decline, risk, and business decrease as a financial symbol. Decrease statistics vectors Financial Loss line icon