Free with trial Vector icons showing business growth and decline trends with arrows and magnifying glass for detailed analysis, representing financial and market data in a clear style. Professional and informative. Generative AI. Decrease statistics vectors Business growth and decline infographic icons with arrows and magnifying glass for analysis. Vector icons showing business growth and decline trends with arrows and magnifying glass for detailed analysis, representing financial and market data in a clear style. Professional and informative. Generative AI
Free with trial Dark grey descending bar chart with arrow indicating decline on white background. Decrease statistics illustrations Dark grey descending bar chart with arrow indicating decline on white background
Free with trial Diagram graph line icon. Neumorphic, Flat shadow, 3d buttons. Column chart sign. Market analytics symbol. Line diagram graph icon. Social media icons. Vector. Decrease statistics vectors Diagram graph line icon. Column chart sign. Neumorphic buttons. Vector. Diagram graph line icon. Neumorphic, Flat shadow, 3d buttons. Column chart sign. Market analytics symbol. Line diagram graph icon. Social media icons. Vector
Free with trial Declining dollar value graph. Vector economic icons. Financial downturn concept. EPS 10. Decrease statistics vectors Declining dollar value graph. Vector economic icons. Financial downturn concept.
Free with trial Glowing red financial chart with percentage symbols, stock market decline concept. Decrease statistics illustrations Glowing red financial chart with percentage symbols, stock market decline concept
Free with trial Hand drawn bar graph shows decreasing trend with downward arrow illustration. Decrease statistics vectors Hand drawn bar graph shows decreasing trend with downward arrow illustration
Free with trial Computer Monitor with a Graph Showing Decreasing Bar Chart for Data Analysis. Decrease statistics vectors Computer Monitor with a Graph Showing Decreasing Bar Chart for Data Analysis
Free with trial Decreasing Bar Chart with Downward Arrow Representing Declining Market Sales. Decrease statistics vectors Decreasing Bar Chart with Downward Arrow Representing Declining Market Sales
Free with trial A stylized line graph icon with a purple gradient is displayed against a solid black background. The graph features four circular data points connected by angled lines, forming an upward trend. Decrease statistics illustrations Stylized line graph icon with purple gradient on black background chart data. A stylized line graph icon with a purple gradient is displayed against a solid black background. The graph features four circular data points connected by angled lines, forming an upward trend
Free with trial A digital image featuring a bearish stock market trend with red and yellow colors on a dark background, concept of financial crisis. Decrease statistics illustrations A digital image featuring a bearish stock market trend with red and yellow colors on a dark background, concept of financial
Free with trial Area chart illustrating trends in Sareorplojicam and S�snpavai across years. Shows variations over time. Decrease statistics illustrations . Area chart illustrating trends in Sareorplojicam and S�snpavai across years. Shows variations over time
Free with trial A stark visual representation of a financial downturn with a bold red arrow pointing downwards. This graphic captures market decline and economic recession trends, ideal for financial analysis and reporting. Decrease statistics illustrations Financial downturn visualized red arrow chart showing decline candlestick graph indicating market drop economic recession trend. A stark visual representation of a financial downturn with a bold red arrow pointing downwards. This graphic captures market decline and economic recession trends, ideal for financial analysis and reporting
Free with trial Conceptual illustration combining a baby stroller with declining graphs to represent lowering birth rates and family planning changes. Highlights trends in societal demographics and population changes. Decrease statistics illustrations Illustration of declining birth rates represented with a baby stroller and graphs. Conceptual illustration combining a baby stroller with declining graphs to represent lowering birth rates and family planning changes. Highlights trends in societal demographics and population changes
Free with trial A close-up of a hand reaching towards a glowing data graph, symbolizing the intersection of technology and finance, with vibrant colors representing growth and potential. Decrease statistics illustrations Hand Touching Sparkling Data Graph with Vibrant Colors and Digital Elements. A close-up of a hand reaching towards a glowing data graph, symbolizing the intersection of technology and finance, with vibrant colors representing growth and potential
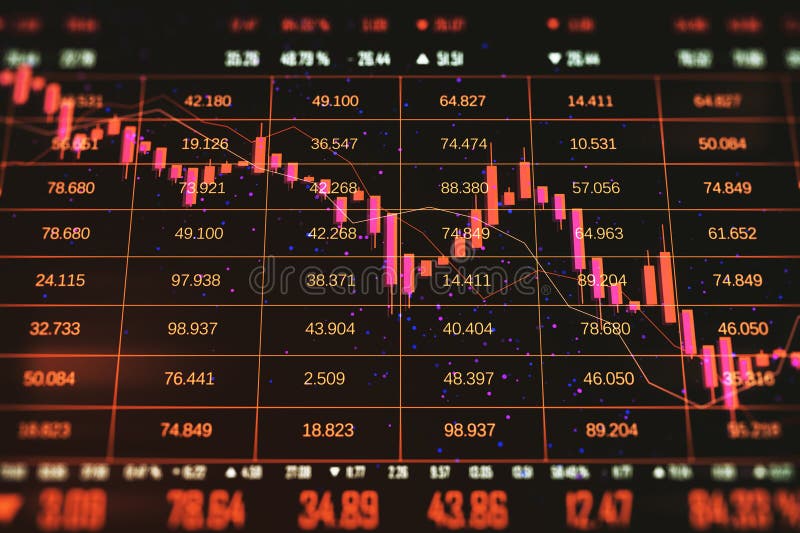
Free with trial Stock market chart displaying investment trends with red and blue candlesticks on a dark background. The chart features a timeline labeled by months at the top and numbers at the bottom, illustrating dynamic financial data. Candlesticks show market fluctuations, with red indicating a decrease and blue an increase in value. A faint blue line overlays the candles, representing the moving average. The scene is likely within a financial or trading setting, emphasizing the analysis of market activity. Decrease statistics illustrations Dynamic stock market chart with vibrant red and blue candles showing investment trends and financial data. Stock market chart displaying investment trends with red and blue candlesticks on a dark background. The chart features a timeline labeled by months at the top and numbers at the bottom, illustrating dynamic financial data. Candlesticks show market fluctuations, with red indicating a decrease and blue an increase in value. A faint blue line overlays the candles, representing the moving average. The scene is likely within a financial or trading setting, emphasizing the analysis of market activity.
Free with trial Tablet displays a declining graph, reflecting downturns. A dark world map serves as the backdrop, emphasizing global impact. This visualization symbolizes economic changes. The image is. Decrease statistics illustrations Global Decline Displayed on Tablet with World Map Background in Dim Lighting. Tablet displays a declining graph, reflecting downturns. A dark world map serves as the backdrop, emphasizing global impact. This visualization symbolizes economic changes. The image is
Free with trial This image depicts a financial loss with red arrows and bars on a stock market chart showing a downward trend. The concept conveys the theme of financial decline and loss in the stock market. The arrows and bars symbolize a negative trend in the financial market, indicating a decrease in value of stocks and shares. The image captures the significance of financial loss and the impact it can have on investors and the economy. The meaning behind it highlights the importance of understanding the risks associated with investing in the stock market and the need for informed decisions. This image is ideal for use in financial reports, presentations, and articles related to the stock market and investments. Decrease statistics illustrations Financial Loss: Red Arrows and Bars on Stock Market Chart Showing Downward Trend. This image depicts a financial loss with red arrows and bars on a stock market chart showing a downward trend. The concept conveys the theme of financial decline and loss in the stock market. The arrows and bars symbolize a negative trend in the financial market, indicating a decrease in value of stocks and shares. The image captures the significance of financial loss and the impact it can have on investors and the economy. The meaning behind it highlights the importance of understanding the risks associated with investing in the stock market and the need for informed decisions. This image is ideal for use in financial reports, presentations, and articles related to the stock market and investments.
Free with trial This 3D render shows a calculator with a colorful bar chart made of cubes illustrating growth and success in business and finance. Perfect for presentations and infographics. Decrease statistics illustrations Colorful 3D Calculator with Growing Bar Chart Cubes for Business and Finance. This 3D render shows a calculator with a colorful bar chart made of cubes illustrating growth and success in business and finance. Perfect for presentations and infographics.
Free with trial A male businessman character holding his temples in the middle of the frame has a stern and worried expression on his face. There is a red graph showing the downtrend of the stock market in the background. Refers to losses from investing in the stock market. Studio shots, clean pastel backgrounds, Pixar style, CGI renders. Decrease statistics illustrations Male businessman character with a serious and worried expression. A male businessman character holding his temples in the middle of the frame has a stern and worried expression on his face. There is a red graph showing the downtrend of the stock market in the background. Refers to losses from investing in the stock market. Studio shots, clean pastel backgrounds, Pixar style, CGI renders.
Free with trial A male businessman character holding his temples in the middle of the frame has a stern and worried expression on his face. There is a red graph showing the downtrend of the stock market in the background. Refers to losses from investing in the stock market. Studio shots, clean pastel backgrounds, Pixar style, CGI renders. Decrease statistics illustrations Male businessman character with a serious and worried expression. A male businessman character holding his temples in the middle of the frame has a stern and worried expression on his face. There is a red graph showing the downtrend of the stock market in the background. Refers to losses from investing in the stock market. Studio shots, clean pastel backgrounds, Pixar style, CGI renders.
Free with trial A close-up shot depicts a businessman's hands interacting with a holographic projection of a declining bar graph displayed on his laptop screen. The graph illustrates a significant downward trend, suggesting a negative financial performance or market downturn. The scene is set in a modern office environment, highlighted by a blurred potted plant in the background, adding a touch of natural. Decrease statistics illustrations Businessman Analyzing Decreasing Stock Market Trend on Laptop, Financial Loss. A close-up shot depicts a businessman's hands interacting with a holographic projection of a declining bar graph displayed on his laptop screen. The graph illustrates a significant downward trend, suggesting a negative financial performance or market downturn. The scene is set in a modern office environment, highlighted by a blurred potted plant in the background, adding a touch of natural
Free with trial A pair of hands holds a sheet of paper displaying a red line graph on a grid pattern the graph illustrates a downward trend, indicating a decline in business, finance or economy the image represents loss, failure, or a recession, generated by AI. Decrease statistics illustrations Hands holding paper showing a declining red business graph data. a pair of hands holds a sheet of paper displaying a red line graph on a grid pattern the graph illustrates a downward trend, indicating a decline in business, finance or economy the image represents loss, failure, or a recession, generated by AI.
Free with trial A vibrant red line depicts a sharp downward trend across a dynamic, motion-blurred abstract background. Decrease statistics illustrations Red downward trending graph line on abstract motion blurred background chart. A vibrant red line depicts a sharp downward trend across a dynamic, motion-blurred abstract background
Free with trial Steeply falling graph arrow pointing down dark background sharp decline ruin Ideal for websites and social media. Decrease statistics illustrations Steeply falling graph, arrow pointing down, dark background, sharp decline, ruin. Steeply falling graph arrow pointing down dark background sharp decline ruin Ideal for websites and social media
Free with trial Two distinct lines illustrate contrasting trends, one rising and the other falling. The gradient colors blend harmoniously, enhancing the visual impact. Decrease statistics illustrations Analysis of Fluctuating Trends in a Colorful Gradient Landscape Representation. Two distinct lines illustrate contrasting trends, one rising and the other falling. The gradient colors blend harmoniously, enhancing the visual impact
Free with trial An abstract digital rendering of a financial market chart with a prominent red line indicating fluctuations in a stock market or trading scenario, set against a background of data streams and numerical information. It can be used for visualizing economic trends or for representing financial analytics. Decrease statistics illustrations Abstract financial chart depicting market trends and data analysis interface. An abstract digital rendering of a financial market chart with a prominent red line indicating fluctuations in a stock market or trading scenario, set against a background of data streams and numerical information. It can be used for visualizing economic trends or for representing financial analytics
Free with trial A 3D rendering features a bar graph with three vertical bars in blue and yellow. Above the graph, a molecular structure is depicted with a central yellow sphere connected to three blue spheres by white rods. The entire graphic is isolated on a clean white background. Decrease statistics illustrations 3D bar graph with molecular structure above on a white background chart data. A 3D rendering features a bar graph with three vertical bars in blue and yellow. Above the graph, a molecular structure is depicted with a central yellow sphere connected to three blue spheres by white rods. The entire graphic is isolated on a clean white background
Free with trial Hand drawn bar chart sketch with ascending and descending data patterns. Decrease statistics vectors Hand drawn bar chart sketch with ascending and descending data patterns, AI Generative. Hand drawn bar chart sketch with ascending and descending data patterns.
Free with trial A graph vividly illustrates two contrasting trends, one declining and the other rising, captured with sharp focus and rich orange tones creating a dynamic visual. Decrease statistics illustrations Dynamic Trends Represented Through Contrasting Lines in a Vibrant Orange Graph. A graph vividly illustrates two contrasting trends, one declining and the other rising, captured with sharp focus and rich orange tones creating a dynamic visual
Free with trial Calculator with purple screen, upward-trending performance graph, and downward arrow. Ideal for finance, accounting, budgeting, data analysis, cost reduction, investment strategy simple flat. Decrease statistics vectors Financial calculation with a calculator, performance graph, and downward arrow for data analysis. Calculator with purple screen, upward-trending performance graph, and downward arrow. Ideal for finance, accounting, budgeting, data analysis, cost reduction, investment strategy simple flat
Free with trial Analyzing Dynamic Stock Market Trends with Red Graph Lines on Black Background. Generative AI. Decrease statistics illustrations Analyzing Dynamic Stock Market Trends with Red Graph Lines on Black Background
Free with trial Drawn down arrow trend graph depicting financial decline and economic downturn. Decrease statistics vectors Drawn down arrow trend graph depicting financial decline and economic downturn
Free with trial AI generated illustration of coins stacked near an upward-downward graph arrow line. Decrease statistics illustrations AI generated illustration of coins stacked near an upward-downward graph arrow line
Free with trial Hand drawn bar graph showing a downward trend with an arrow indicating decline. Decrease statistics vectors Hand drawn bar graph showing a downward trend with an arrow indicating decline
Free with trial Signed document with a frown face and declining bar chart symbolizing failure, loss, rejection, or performance drop. Ideal for business, finance, loss, analysis, feedback strategy simple landing. Decrease statistics vectors Document with Signature, Sad Face, and Bar Graph Highlighting Decline in Performance or Approval. Signed document with a frown face and declining bar chart symbolizing failure, loss, rejection, or performance drop. Ideal for business, finance, loss, analysis, feedback strategy simple landing
Free with trial A 3D render illustrates a downward trending bar chart. Five light blue vertical bars of decreasing height are arranged from left to right. A bright yellow line with an arrow at its end descends across the bars, indicating a negative trend. The background is a solid, soft pink. Decrease statistics illustrations Downward Trending Bar Chart with Yellow Arrow on a Pink Background graph data. A 3D render illustrates a downward trending bar chart. Five light blue vertical bars of decreasing height are arranged from left to right. A bright yellow line with an arrow at its end descends across the bars, indicating a negative trend. The background is a solid, soft pink
Free with trial Computer-generated world map, white continents, dark background, overlaid with red line and bar graphs showing downward trends, stylized global data visualization. Decrease statistics illustrations Realistic White World Map Data Visualization Dark Background Red Graphs Trend. Computer-generated world map, white continents, dark background, overlaid with red line and bar graphs showing downward trends, stylized global data visualization
Free with trial A computer screen displays a sharply declining red graph, indicative of a market crash. This 3D-rendered image, generated by AI, illustrates the dramatic visual representation of financial downturn. The image serves as a powerful symbol of economic instability and risk. Decrease statistics illustrations AI-Generated Market Crash Visualization. A computer screen displays a sharply declining red graph, indicative of a market crash. This 3D-rendered image, generated by AI, illustrates the dramatic visual representation of financial downturn. The image serves as a powerful symbol of economic instability and risk.
Free with trial Decreasing Bar Chart with Falling Arrow Illustrates Economic Downturn, Recession. Decrease statistics vectors Decreasing Bar Chart with Falling Arrow Illustrates Economic Downturn, Recession
Free with trial A 3d stylized financial chart displays a downward red arrow over blue and orange bars. Two gold coins with dollar signs flank the chart. Decrease statistics illustrations 3d stylized financial chart with downward red arrow and gold coins illustration. A 3d stylized financial chart displays a downward red arrow over blue and orange bars. Two gold coins with dollar signs flank the chart
Free with trial Stock market chart with candlestick patterns in red and yellow, digital, on dark background, concept of financial analysis. 3D. Decrease statistics illustrations Stock market chart with candlestick patterns in red and yellow, digital, on dark background, concept of financial analysis. 3D
Free with trial A striking red arrow plunges downwards, symbolizing a significant drop in data trends. This representation highlights a negative change in performance or market activity. Decrease statistics illustrations A red downward arrow indicating a sharp decline in numbers during market analysis. A striking red arrow plunges downwards, symbolizing a significant drop in data trends. This representation highlights a negative change in performance or market activity.
Free with trial A textured golden fifty-seven percent symbol rests on a peach background ideal for illustrating sales, discounts, or financial data. Decrease statistics illustrations Golden Fifty-seven Percent Symbol on Peach Background for Sales and Promotions. A textured golden fifty-seven percent symbol rests on a peach background ideal for illustrating sales, discounts, or financial data
Free with trial Steeply falling graph arrow pointing down dark background collapse devastation Perfect for blogs, articles, and online content. Decrease statistics illustrations Steeply falling graph, arrow pointing down, dark background, collapse, devastation. Steeply falling graph arrow pointing down dark background collapse devastation Perfect for blogs, articles, and online content
Free with trial Business graph data analysis on wooden desk with pencils, bananas and notebooks. Decrease statistics illustrations Business graph data analysis on wooden desk with pencils, bananas and notebooks
Free with trial Bear market stock chart illustration. It features strong, financial decline. It serves to visualize the concept of financial downturn. Decrease statistics illustrations Bear market and stock chart illustration symbolizes financial risk and investment trend. Bear market stock chart illustration. It features strong, financial decline. It serves to visualize the concept of financial downturn
Free with trial Bar graph with downward trend, arrows indicating loss, and coins falling. Ideal for finance, economics, business, investment, budgeting revenue loss and decline concepts. Simple flat metaphor. Decrease statistics illustrations Revenue Decline Illustration with Bar Graph, Arrows, and Falling Coins Symbolizing Financial Loss. Bar graph with downward trend, arrows indicating loss, and coins falling. Ideal for finance, economics, business, investment, budgeting revenue loss and decline concepts. Simple flat metaphor
Free with trial Illustration of descending financial chart background for business presentations, Generated by AI. Decrease statistics illustrations Illustration of descending financial chart background for business presentations
Free with trial Column 3d graph sign. Salaryman, gender equality and alert bell outline icons. Diagram chart line icon. Market analytics symbol. 3d chart line sign. Spy or profile placeholder icon. Vector. Decrease statistics vectors Diagram chart line icon. Column 3d graph sign. Salaryman, gender equality and alert bell. Vector. Column 3d graph sign. Salaryman, gender equality and alert bell outline icons. Diagram chart line icon. Market analytics symbol. 3d chart line sign. Spy or profile placeholder icon. Vector
Free with trial A hand in a suit holds a glowing red bar graph with a downward arrow indicating a decline. The image is lit with red and blue light. Decrease statistics illustrations Hand holding glowing red downward trending bar graph with arrow chart business. A hand in a suit holds a glowing red bar graph with a downward arrow indicating a decline. The image is lit with red and blue light
Free with trial Illustration of a baby stroller interwoven with statistical graphs representing demographic trends, particularly highlighting declining birth rates and societal focus on family-related economics. Decrease statistics illustrations Baby stroller illustration with declining demographic trends and graphical analytics. Illustration of a baby stroller interwoven with statistical graphs representing demographic trends, particularly highlighting declining birth rates and societal focus on family-related economics
Free with trial Downward arrows icon. Decreasing trend symbol. Vector arrow group. Economic downturn. EPS 10. Decrease statistics vectors Downward arrows icon. Decreasing trend symbol. Vector arrow group. Economic downturn.
Free with trial Bar chart showing a steep downward trend and a descending arrow indicating decline. Decrease statistics vectors Bar chart showing a steep downward trend and a descending arrow indicating decline
Free with trial Financial Decline Illustrated by Decreasing Coin Stacks and Downward Arrow Graph. Decrease statistics vectors Financial Decline Illustrated by Decreasing Coin Stacks and Downward Arrow Graph
Free with trial A simple vector illustration of a graph showing a sharp downward trend, representing a financial crisis or market decline. Perfect for illustrating economic downturn concepts. Decrease statistics vectors Trending Downward Graph Financial Crisis Icon Stock Market Decline Illustration. A simple vector illustration of a graph showing a sharp downward trend, representing a financial crisis or market decline. Perfect for illustrating economic downturn concepts.
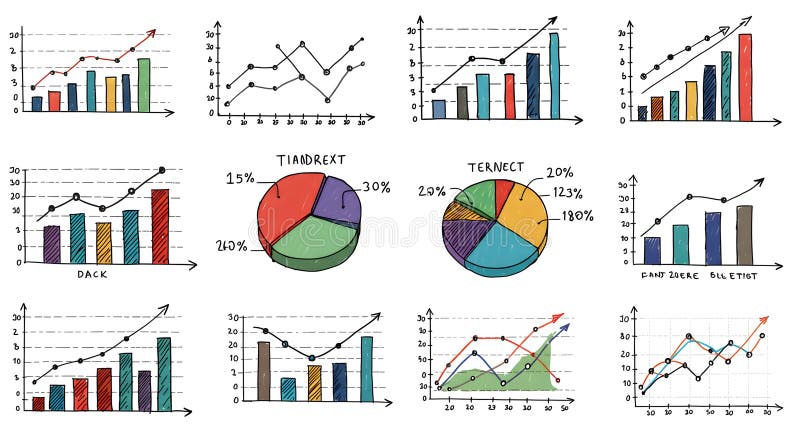
Free with trial A collection of hand-drawn style charts and diagrams that can be used to display data and analyze progress, ideal for business presentations, reports, or data visualizations. Decrease statistics illustrations Hand-Drawn Collection of Statistical Charts and Diagrams for Business Analytics. A collection of hand-drawn style charts and diagrams that can be used to display data and analyze progress, ideal for business presentations, reports, or data visualizations
Free with trial A versatile collection of nine black outline icons on a white background, representing key concepts in business, communication, and user management. Icons include user profiles, groups, growth and decline charts, user search, audio, ratings, target goals, and microphone recording. Ideal for UI UX design, presentations, web applications, and marketing materials, offering a modern and minimalist aesthetic for various digital and print projects. Decrease statistics vectors Business and Communication Line Icons Set. A versatile collection of nine black outline icons on a white background, representing key concepts in business, communication, and user management. Icons include user profiles, groups, growth and decline charts, user search, audio, ratings, target goals, and microphone recording. Ideal for UI UX design, presentations, web applications, and marketing materials, offering a modern and minimalist aesthetic for various digital and print projects.
Free with trial Visualize financial decline with this striking depiction of a report showing falling tax revenue and a clear downward trend, perfect for economic analysis and business strategy content. Decrease statistics vectors Business financial report shows declining tax revenue with downward trend arrow. Visualize financial decline with this striking depiction of a report showing falling tax revenue and a clear downward trend, perfect for economic analysis and business strategy content
Free with trial Digital globe with rising and falling stock market trends, represented by red and blue lines, symbolizing global financial fluctuations and economic uncertainty in a high-tech, futuristic style. Decrease statistics illustrations Global Market Fluctuations: A Digital Earth with Rising and Falling Stock Trends. Digital globe with rising and falling stock market trends, represented by red and blue lines, symbolizing global financial fluctuations and economic uncertainty in a high-tech, futuristic style
Free with trial Diagram graph line icon. Neumorphic, Red gradient, 3d pin buttons. Column chart sign. Market analytics symbol. Line icons. Neumorphic buttons with outline signs. Vector. Decrease statistics vectors Diagram graph line icon. Column chart sign. Line icons. Vector. Diagram graph line icon. Neumorphic, Red gradient, 3d pin buttons. Column chart sign. Market analytics symbol. Line icons. Neumorphic buttons with outline signs. Vector
Free with trial Red market decline graph on desk, glasses, tablet showing losses, office background, detailed background Generative AI. Decrease statistics illustrations Red market decline graph on desk, glasses, tablet showing losses, office background
Free with trial This 3D rendering showcases colorful bar graphs, pie charts, and a calculator, vividly illustrating concepts of business growth, financial success, and data analysis. The upward-trending arrow emphasizes positive progress. Decrease statistics illustrations Colorful 3D Charts and Calculator Illustrating Business Growth and Financial Success. This 3D rendering showcases colorful bar graphs, pie charts, and a calculator, vividly illustrating concepts of business growth, financial success, and data analysis. The upward-trending arrow emphasizes positive progress.
Free with trial Global RAM Shortage Crisis Impacting Computer Hardware Market and Semiconductor Supply Chain. With Declining Performance Trend. Decrease statistics vectors Global RAM Shortage Crisis Impacting Computer Hardware Market and Semiconductor Supply Chain. With Declining Performance Trend
Free with trial Colorful bar chart on a blue background illustrating data trends ,Generative ai. Decrease statistics illustrations Vibrant bar chart on blue background, visualizing data trends and insights colorful. Colorful bar chart on a blue background illustrating data trends ,Generative ai
Free with trial This illustration depicts a piggy bank beside a bar chart showing a sharp decline symbolizing decreasing savings and potential economic hardship The design uses simple clean graphics to effectively communicate a message of financial downturn Ideal for articles about recession financial planning or investment risks. Decrease statistics illustrations Declining Savings Piggy Bank and Bar Chart Showing Economic Downturn AI generated. This illustration depicts a piggy bank beside a bar chart showing a sharp decline symbolizing decreasing savings and potential economic hardship The design uses simple clean graphics to effectively communicate a message of financial downturn Ideal for articles about recession financial planning or investment risks
Free with trial Chess king symbolizing leadership beside a declining bar graph for strategy, business performance. Ideal for growth analysis, planning, decision-making, leadership vision, competition, management. Decrease statistics illustrations Strategic planning concept with chess king and declining bar chart for business analysis insights. Chess king symbolizing leadership beside a declining bar graph for strategy, business performance. Ideal for growth analysis, planning, decision-making, leadership vision, competition, management
Free with trial Downward arrow with decreasing bar graph alongside neutral, happy, and sad emotion faces. Ideal for emotional feedback, metrics, performance, business evaluation, impact loss failure. A simple flat. Decrease statistics vectors Decline in Performance Represented by Downward Arrow, Graph Bars, and Varying Emotional Expressions. Downward arrow with decreasing bar graph alongside neutral, happy, and sad emotion faces. Ideal for emotional feedback, metrics, performance, business evaluation, impact loss failure. A simple flat
Free with trial Financial chart with red and yellow candlesticks and a downward yellow arrow, on a dark background, concept of market crash and recession. 3D Rendering. Decrease statistics illustrations Abstract financial chart with red and yellow candlesticks showing a downward trend and falling market data on dark background. 3D. Financial chart with red and yellow candlesticks and a downward yellow arrow, on a dark background, concept of market crash and recession. 3D Rendering
Free with trial A minimalist 3D bar chart rendered in white against a bright white background. The chart displays four bars of decreasing height, visually representing a sharp downward trend. A prominent white arrow, also pointing downwards, overlays the bars, emphasizing the decline. The composition is clean and abstract, suitable for representing financial or economic downturns. Decrease statistics illustrations White 3D Bar Chart Showing a Sharp Downward Trend with Arrow on White Background graph. A minimalist 3D bar chart rendered in white against a bright white background. The chart displays four bars of decreasing height, visually representing a sharp downward trend. A prominent white arrow, also pointing downwards, overlays the bars, emphasizing the decline. The composition is clean and abstract, suitable for representing financial or economic downturns
Free with trial A minimalist bar chart is displayed on a white background. Three vertical bars of increasing height are depicted with thick black outlines. The interior of each bar features a subtle grey gradient fill, creating a sense of depth. Decrease statistics illustrations Simple Black Outline Bar Chart with Gradient Fill on White Background graph bars. A minimalist bar chart is displayed on a white background. Three vertical bars of increasing height are depicted with thick black outlines. The interior of each bar features a subtle grey gradient fill, creating a sense of depth
Free with trial A striking 3D render of a glossy red arrow, symbolizing a sharp decline or negative trend, against a dark, subtly textured gradient background. Decrease statistics illustrations Glossy Red Arrow Chart Symbol Descending Sharply Against Dark Gradient Background. A striking 3D render of a glossy red arrow, symbolizing a sharp decline or negative trend, against a dark, subtly textured gradient background.
Free with trial Smartphone displaying decreasing bar graph with down arrow hand drawn illustration. Decrease statistics vectors Smartphone displaying decreasing bar graph with down arrow hand drawn illustration
Free with trial Credit card decline financial chart with downward arrow. Economic and financial crisis symbol. Decrease statistics vectors Credit card decline financial chart with downward arrow. Economic and financial crisis symbol
Free with trial Descending Bar Chart and Downward Arrow Signifying Business Loss and Economic Downturn. Decrease statistics vectors Descending Bar Chart and Downward Arrow Signifying Business Loss and Economic Downturn
Free with trial A 3D cartoon boy with brown hair, wearing a light blue t-shirt and blue pants, holds a large pink arrow pointing downwards against a white background. Decrease statistics illustrations Cartoon boy in blue shirt and pants holding a large pink downward arrow male child. A 3D cartoon boy with brown hair, wearing a light blue t-shirt and blue pants, holds a large pink arrow pointing downwards against a white background
Free with trial Chart with a downward trend line and data points, a sad face emotion, and a pointing hand. Ideal for performance analysis, failure, problem-solving, disappointment, caution, decision-making simple. Decrease statistics vectors Hand pointing at declining data chart with a sad face icon highlighting negative performance trend. Chart with a downward trend line and data points, a sad face emotion, and a pointing hand. Ideal for performance analysis, failure, problem-solving, disappointment, caution, decision-making simple
Free with trial Financial chart with red candlesticks showing a downtrend, glowing on a dark background. Represents stock market downturn, financial crisis. 3D Rendering. Decrease statistics illustrations Financial chart with falling red candlesticks and data on a dark interface backdrop, representing market decline and economic loss. Financial chart with red candlesticks showing a downtrend, glowing on a dark background. Represents stock market downturn, financial crisis. 3D Rendering
Free with trial Backup logo design with editable slogan. Business card and branding book template. Decrease statistics vectors Backup logo design with editable slogan. Branding book and business card template. Backup logo design with editable slogan. Business card and branding book template.
Free with trial Stock market or crypto currency crash and going down, economic crisis or investing risk. Decrease statistics vectors Stock market or crypto currency crash and going down, economic crisis or investing risk
Free with trial A 3D rendered gray percentage symbol is presented against a clean white background. The symbol is composed of two circles and a diagonal line, with subtle shading that gives it a three-dimensional appearance. The lighting highlights the smooth surfaces of the symbol. Decrease statistics illustrations 3D Rendered Gray Percentage Symbol on White Background sign discount. A 3D rendered gray percentage symbol is presented against a clean white background. The symbol is composed of two circles and a diagonal line, with subtle shading that gives it a three-dimensional appearance. The lighting highlights the smooth surfaces of the symbol