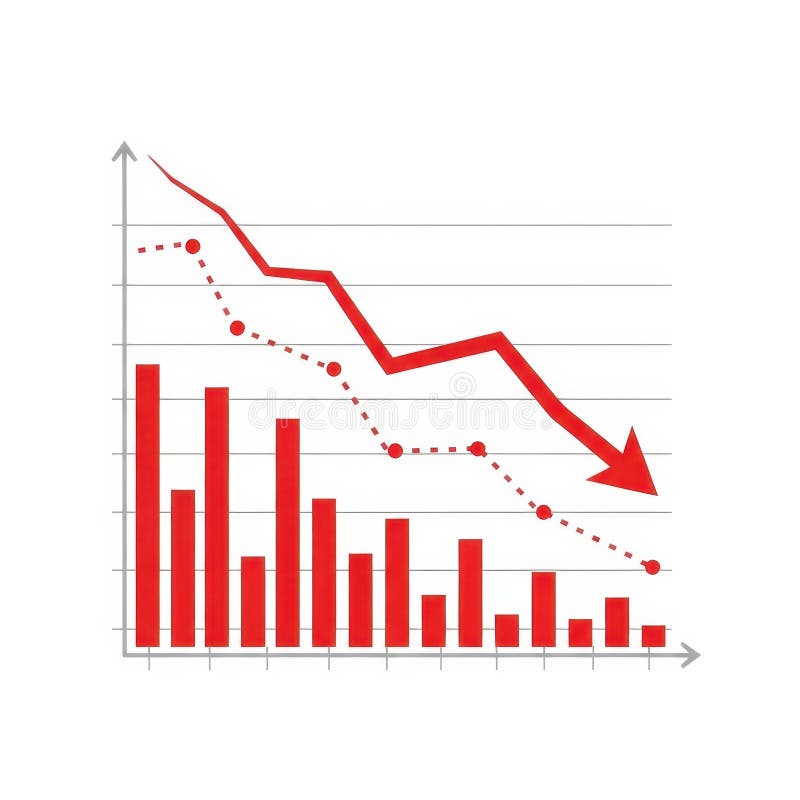
Free with trial Graphic bar chart illustrating business data analysis, financial statistics, and market trends with both positive growth and negative decline on a clean white background. Illustrating decrease vectors Business financial graph showing increase and decrease. Graphic bar chart illustrating business data analysis, financial statistics, and market trends with both positive growth and negative decline on a clean white background
Free with trial An abstract digital financial chart features multiple vibrant, fluctuating neon lines in blue, green, pink, and white, set against a dark grid background. Prominent red upward and downward arrows, along with a green downward arrow, clearly indicate market trends, growth, and decline. Interspersed geometric shapes connected by lines suggest complex data points and network connections. This dynamic visualization is ideal for illustrating concepts of stock market data, cryptocurrency trends, business analytics, investment volatility, big data, AI, and financial technology, suitable for modern business and tech-related projects. Illustrating decrease illustrations Digital Financial Data Chart with Fluctuating Lines and Arrows. An abstract digital financial chart features multiple vibrant, fluctuating neon lines in blue, green, pink, and white, set against a dark grid background. Prominent red upward and downward arrows, along with a green downward arrow, clearly indicate market trends, growth, and decline. Interspersed geometric shapes connected by lines suggest complex data points and network connections. This dynamic visualization is ideal for illustrating concepts of stock market data, cryptocurrency trends, business analytics, investment volatility, big data, AI, and financial technology, suitable for modern business and tech-related projects.
Free with trial Three funnel-shaped arrows�orange, red, and dark blue�decrease in size vertically, leading into a single blue arrow pointing right. Each funnel section tapers downward, representing a flow or process. The arrows contrast against a light background, emphasizing the transition from multiple inputs to a single output. Suitable for illustrating processes like sales funnels or data narrowing. Illustrating decrease vectors Funnel flow chart template with three arrows. Three funnel-shaped arrows�orange, red, and dark blue�decrease in size vertically, leading into a single blue arrow pointing right. Each funnel section tapers downward, representing a flow or process. The arrows contrast against a light background, emphasizing the transition from multiple inputs to a single output. Suitable for illustrating processes like sales funnels or data narrowing.
Free with trial This 3D render visually represents a financial crisis or economic recession. Four stacks of gold coins, decreasing in height from left to right, are depicted. A prominent red arrow, symbolizing a downward trend, points towards the smallest coin stack, emphasizing a significant decline. The clean, minimalist background with a reflective surface enhances the focus on the financial concept. This image is ideal for illustrating concepts like market crash, investment loss, bankruptcy, or economic instability. Illustrating decrease vectors Financial Downturn: Declining Coin Stacks and Red Arrow. This 3D render visually represents a financial crisis or economic recession. Four stacks of gold coins, decreasing in height from left to right, are depicted. A prominent red arrow, symbolizing a downward trend, points towards the smallest coin stack, emphasizing a significant decline. The clean, minimalist background with a reflective surface enhances the focus on the financial concept. This image is ideal for illustrating concepts like market crash, investment loss, bankruptcy, or economic instability.
Free with trial This graphic depicts supply and demand curves balanced by a scale, illustrating economic principles and market equilibrium. It's suitable for business presentations and educational materials. Illustrating decrease vectors Supply and demand graph with balance scale illustration. This graphic depicts supply and demand curves balanced by a scale, illustrating economic principles and market equilibrium. It's suitable for business presentations and educational materials
Free with trial Black wave patterns on a white background. The designs include six solid silhouettes on the left with various wave formations, and six halftone-style waves on the right. The halftone effect creates a gradient appearance as dots decrease in density away from the crest. These abstract representations convey movement and fluidity, illustrating stylized ocean waves common in graphic design and print media. Illustrating decrease vectors Black Abstract dotted halftone wave design dot patterns. Black wave patterns on a white background. The designs include six solid silhouettes on the left with various wave formations, and six halftone-style waves on the right. The halftone effect creates a gradient appearance as dots decrease in density away from the crest. These abstract representations convey movement and fluidity, illustrating stylized ocean waves common in graphic design and print media.
Free with trial A glowing red 3D coin with a downward arrow symbol, floating against a digital background featuring declining bar charts and bearish market indicators. The neon red lighting emphasizes loss, downturn, risk, volatility, and negative financial trends. Ideal for illustrating stock market crashes, crypto decline, recession concepts, falling prices, and economic downturn visuals. This image is Generated with the help of AI. Illustrating decrease illustrations Bearish red 3D coin with down arrow and falling market chart. A glowing red 3D coin with a downward arrow symbol, floating against a digital background featuring declining bar charts and bearish market indicators. The neon red lighting emphasizes loss, downturn, risk, volatility, and negative financial trends. Ideal for illustrating stock market crashes, crypto decline, recession concepts, falling prices, and economic downturn visuals. This image is Generated with the help of AI.
Free with trial Close-up of a hand gripping a bright red marker pen, drawing a clear red line on a pristine white surface. This imagery symbolizes emphasis, correction, or charting progress. Illustrating decrease illustrations Hand holding a red marker pen drawing a downward arrow line. Close-up of a hand gripping a bright red marker pen, drawing a clear red line on a pristine white surface. This imagery symbolizes emphasis, correction, or charting progress
Free with trial This image showcases a dynamic stock market graph, generated by AI, depicting a sharp downward trend in red. The vibrant red line against the black background creates a dramatic visual representation of market volatility. The image is perfect for illustrating concepts of risk, investment, and fina. Illustrating decrease illustrations Red Market Dip. This image showcases a dynamic stock market graph, generated by AI, depicting a sharp downward trend in red. The vibrant red line against the black background creates a dramatic visual representation of market volatility. The image is perfect for illustrating concepts of risk, investment, and fina
Free with trial A digital illustration depicting a Bitcoin crash. A glowing Bitcoin symbol is shown breaking apart with a downward trending line graph overlaid on a dark, grid-like background. The image represents financial loss, market volatility, and the risks associated with cryptocurrency investments. Suitable for illustrating articles about economic downturns, crypto market analysis, and investment strategies. Illustrating decrease illustrations Bitcoin Crash: Market Downturn Concept. A digital illustration depicting a Bitcoin crash. A glowing Bitcoin symbol is shown breaking apart with a downward trending line graph overlaid on a dark, grid-like background. The image represents financial loss, market volatility, and the risks associated with cryptocurrency investments. Suitable for illustrating articles about economic downturns, crypto market analysis, and investment strategies.
Free with trial Data analytics dashboard illustrating a mix of line graphs, bar charts, and data summaries, representing business growth, financial trends, and statistical insights for market analysis. Illustrating decrease vectors Data analytics dashboard showing business growth and decline. Data analytics dashboard illustrating a mix of line graphs, bar charts, and data summaries, representing business growth, financial trends, and statistical insights for market analysis
Free with trial A glowing neon red bar chart shows a significant downward trend, symbolizing financial loss or negative growth on a black backdrop. Illustrating decrease illustrations Neon red bar chart illustrating a steep decline in financial performance against a dark background. A glowing neon red bar chart shows a significant downward trend, symbolizing financial loss or negative growth on a black backdrop
Free with trial A bold, three-dimensional red arrow forms a jagged downward trend, symbolizing decline, loss, or negative performance. The arrow's sharp angles and bright red color convey urgency and a significant downturn. Isolated on a clean white background, this graphic is versatile for illustrating financial losses, market crashes, declining statistics, or any concept related to a negative trajectory. Its minimalist design makes it suitable for presentations, reports, and digital media. Illustrating decrease illustrations Red Downward Trend Arrow. A bold, three-dimensional red arrow forms a jagged downward trend, symbolizing decline, loss, or negative performance. The arrow's sharp angles and bright red color convey urgency and a significant downturn. Isolated on a clean white background, this graphic is versatile for illustrating financial losses, market crashes, declining statistics, or any concept related to a negative trajectory. Its minimalist design makes it suitable for presentations, reports, and digital media.
Free with trial A straightforward and clear vector graphic of a bar chart illustrating a negative trend. The solid black bars steadily decrease in height from left to right. A thick diagonal arrow points downward, connecting the top of the first bar to the end of the chart, visually emphasizing the decline. This minimalist design is perfect for representing losses, financial downturns, or decreasing statistics. Illustrating decrease illustrations Declining Bar Chart Icon, AI Generated. A straightforward and clear vector graphic of a bar chart illustrating a negative trend. The solid black bars steadily decrease in height from left to right. A thick diagonal arrow points downward, connecting the top of the first bar to the end of the chart, visually emphasizing the decline. This minimalist design is perfect for representing losses, financial downturns, or decreasing statistics.
Free with trial This comprehensive vector illustration features a set of 18 flat icons depicting various financial trends, market indicators, and warning signals. The collection includes rising and falling line graphs, bar charts, currency symbols (dollar and euro) indicating fluctuations, and alert symbols like sirens and exclamation marks. Ideal for illustrating concepts of economic growth, decline, market volatility, financial crisis, investment risks, and business performance. Perfect for presentations, reports, websites, and applications related to finance, economics, and stock markets. Illustrating decrease vectors Financial Trends, Market Indicators and Crisis Alert Icons Set. This comprehensive vector illustration features a set of 18 flat icons depicting various financial trends, market indicators, and warning signals. The collection includes rising and falling line graphs, bar charts, currency symbols (dollar and euro) indicating fluctuations, and alert symbols like sirens and exclamation marks. Ideal for illustrating concepts of economic growth, decline, market volatility, financial crisis, investment risks, and business performance. Perfect for presentations, reports, websites, and applications related to finance, economics, and stock markets.
Free with trial This set of four flat design icons visually represents key concepts related to climate change and sustainable energy. It includes a thermometer with a rising graph indicating global warming, a stylized Earth with continents and oceans, a young plant sprout symbolizing growth and nature, and a wind turbine representing renewable energy. These icons are ideal for illustrating environmental issues, conservation efforts, and the transition to clean power sources in presentations, articles, and educational materials. Illustrating decrease illustrations Climate Change and Green Energy Icons. This set of four flat design icons visually represents key concepts related to climate change and sustainable energy. It includes a thermometer with a rising graph indicating global warming, a stylized Earth with continents and oceans, a young plant sprout symbolizing growth and nature, and a wind turbine representing renewable energy. These icons are ideal for illustrating environmental issues, conservation efforts, and the transition to clean power sources in presentations, articles, and educational materials.
Free with trial A 3D golden bar chart is arranged in a descending sequence, illustrating a downward trend. The bars are polished and reflective, casting subtle shadows on the pure white background. This visual represents a decline in data or financial performance. Illustrating decrease illustrations Golden Bar Chart Showing Downward Trend on White Background graph metallic. A 3D golden bar chart is arranged in a descending sequence, illustrating a downward trend. The bars are polished and reflective, casting subtle shadows on the pure white background. This visual represents a decline in data or financial performance
Free with trial Green money bag with dollar sign and downward arrow on grey background representing financial loss, business decline, or economic crisis concept. Perfect for illustrating investment risk, recession, and business downturn themes. Illustrating decrease illustrations Green Money Bag with Downward Arrow Symbolizing Financial Loss. Green money bag with dollar sign and downward arrow on grey background representing financial loss, business decline, or economic crisis concept. Perfect for illustrating investment risk, recession, and business downturn themes.
Free with trial A vibrant, hand-drawn doodle illustration centered around a large percentage sign. This creative sketch features various financial and business icons, including bar graphs, pie charts, stacks of coins, dollar signs, and arrows indicating growth and decline. The colorful, cartoonish style makes it perfect for illustrating concepts like interest rates, economic trends, business analytics, and financial reports. Ideal for use in presentations, infographics, websites, and educational materials, this vector art is isolated on a white background for versatile application. Illustrating decrease illustrations Finance and Economy Doodle Illustration. A vibrant, hand-drawn doodle illustration centered around a large percentage sign. This creative sketch features various financial and business icons, including bar graphs, pie charts, stacks of coins, dollar signs, and arrows indicating growth and decline. The colorful, cartoonish style makes it perfect for illustrating concepts like interest rates, economic trends, business analytics, and financial reports. Ideal for use in presentations, infographics, websites, and educational materials, this vector art is isolated on a white background for versatile application.
Free with trial A striking red arrow points downwards on a soft gray background, signifying a negative trend. Illustrating decrease illustrations Bold red downward arrow symbol against a subtle gradient background illustrating decline. A striking red arrow points downwards on a soft gray background, signifying a negative trend
Free with trial A hand delicately stacks smooth, white stones vertically on a wooden surface, illustrating concepts of balance and mindfulness. The stones are circular and gradually decrease in size from bottom to top. The background is plain, enhancing the peaceful and minimalistic arrangement. The scene suggests themes of calm and focus. Illustrating decrease illustrations Hand Stacking Smooth Stones Symbolizing Balance Calm And Mindfulness. A hand delicately stacks smooth, white stones vertically on a wooden surface, illustrating concepts of balance and mindfulness. The stones are circular and gradually decrease in size from bottom to top. The background is plain, enhancing the peaceful and minimalistic arrangement. The scene suggests themes of calm and focus.
Free with trial A prominent 3D metallic US dollar sign stands against a dynamic digital background featuring various financial charts and graphs. The background displays a fluctuating line graph and a colorful bar chart, symbolizing market trends, economic data, and investment performance. This image powerfully conveys concepts of finance, global economy, currency strength, stock market analysis, and wealth management in a modern, digital context. Ideal for illustrating reports, presentations, or articles related to business, banking, and financial growth. Illustrating decrease illustrations US Dollar Symbol with Digital Financial Charts and Market Data. A prominent 3D metallic US dollar sign stands against a dynamic digital background featuring various financial charts and graphs. The background displays a fluctuating line graph and a colorful bar chart, symbolizing market trends, economic data, and investment performance. This image powerfully conveys concepts of finance, global economy, currency strength, stock market analysis, and wealth management in a modern, digital context. Ideal for illustrating reports, presentations, or articles related to business, banking, and financial growth.
Free with trial A comprehensive vector icon collection illustrating various aspects of financial crises, market downturns, and economic challenges. This set includes symbols like bull and bear market dynamics, broken shields representing risk and vulnerability, declining bar charts, candlestick patterns, and emergency indicators. Concepts such as bankruptcy, recession, financial loss, and market volatility are visually conveyed. Ideal for financial news, economic reports, business presentations, educational materials, and articles discussing market risks or economic forecasts. Illustrating decrease vectors Financial Crisis, Market Downturn, and Bankruptcy Vector Icons Set. A comprehensive vector icon collection illustrating various aspects of financial crises, market downturns, and economic challenges. This set includes symbols like bull and bear market dynamics, broken shields representing risk and vulnerability, declining bar charts, candlestick patterns, and emergency indicators. Concepts such as bankruptcy, recession, financial loss, and market volatility are visually conveyed. Ideal for financial news, economic reports, business presentations, educational materials, and articles discussing market risks or economic forecasts.
Free with trial A 3D rendered image of a bar chart with a downward trend, set against a bright yellow background. The chart features grey frame and orange bars, with a prominent red arrow indicating a decline. This image is suitable for illustrating concepts related to financial loss, market downturn, economic recession, or negative performance in business and investment contexts. Illustrating decrease illustrations Downward Trend Chart on Yellow Background. A 3D rendered image of a bar chart with a downward trend, set against a bright yellow background. The chart features grey frame and orange bars, with a prominent red arrow indicating a decline. This image is suitable for illustrating concepts related to financial loss, market downturn, economic recession, or negative performance in business and investment contexts.
Free with trial This image features two bar graphs isolated on a white background. The left graph, labeled 'PROFIT,' shows increasing bars indicating rising profit levels. The right graph, labeled 'LOSS,' displays decreasing bars, illustrating increasing loss levels. The image is clear, concise, and SEO-friendly, highlighting financial concepts. Illustrating decrease illustrations Profit and loss graphs isolated on white background. This image features two bar graphs isolated on a white background. The left graph, labeled 'PROFIT,' shows increasing bars indicating rising profit levels. The right graph, labeled 'LOSS,' displays decreasing bars, illustrating increasing loss levels. The image is clear, concise, and SEO-friendly, highlighting financial concepts
Free with trial A collection of simple black glyph icons representing economic downturn, financial loss, bankruptcy, and recession. These icons are suitable for illustrating concepts related to investment risk, market crash, and personal finance issues. Illustrating decrease vectors Minimalist Black Glyph Economic Crisis and Financial Loss Icon Set. A collection of simple black glyph icons representing economic downturn, financial loss, bankruptcy, and recession. These icons are suitable for illustrating concepts related to investment risk, market crash, and personal finance issues.
Free with trial A dramatic visual representation of a stock market crash, featuring a downward trending red candlestick chart against a dark, grid-like background. Numbers and financial data are subtly visible, emphasizing the financial context. This image evokes feelings of loss, recession, and economic downturn, making it ideal for illustrating financial crises, market volatility, and investment risks. Illustrating decrease illustrations Red Stock Market Crash Chart. A dramatic visual representation of a stock market crash, featuring a downward trending red candlestick chart against a dark, grid-like background. Numbers and financial data are subtly visible, emphasizing the financial context. This image evokes feelings of loss, recession, and economic downturn, making it ideal for illustrating financial crises, market volatility, and investment risks.
Free with trial This image visually represents a decreasing financial trend. Stacks of gold coins are arranged on a rustic wooden surface, decreasing in height from left to right. A prominent red downward-pointing arrow overlays the coins, clearly illustrating a negative economic trajectory or a decline in wealth, investments, or profits. The dark, textured wood background enhances the serious tone of financial downturn. The overall effect is a compelling visual metaphor for economic recession or loss. Illustrating decrease illustrations Declining Financial Growth Shown by Coins and Arrow. This image visually represents a decreasing financial trend. Stacks of gold coins are arranged on a rustic wooden surface, decreasing in height from left to right. A prominent red downward-pointing arrow overlays the coins, clearly illustrating a negative economic trajectory or a decline in wealth, investments, or profits. The dark, textured wood background enhances the serious tone of financial downturn. The overall effect is a compelling visual metaphor for economic recession or loss.
Free with trial A conceptual vector illustration depicting a severe economic downturn. The image features a grey bar chart with progressively shorter bars, symbolizing declining profits or performance. A bold red arrow points sharply downwards, representing a crash or significant loss, alongside a blue line graph also showing a negative trend. This graphic is ideal for illustrating concepts such as financial crisis, recession, stock market crash, business failure, bankruptcy, and negative growth. Perfect for financial reports, business presentations, news articles, and economic analysis infographics. Illustrating decrease illustrations Economic Downturn and Financial Crisis Graph. A conceptual vector illustration depicting a severe economic downturn. The image features a grey bar chart with progressively shorter bars, symbolizing declining profits or performance. A bold red arrow points sharply downwards, representing a crash or significant loss, alongside a blue line graph also showing a negative trend. This graphic is ideal for illustrating concepts such as financial crisis, recession, stock market crash, business failure, bankruptcy, and negative growth. Perfect for financial reports, business presentations, news articles, and economic analysis infographics.
Free with trial A minimalist illustration of a downward pointing zigzag arrow, conveying decline, direction, and a sense of motion. Great for illustrating a negative trend or movement. Illustrating decrease vectors Simple Bold Zigzag Decline Arrow Direction Sign Symbol Icon Element. A minimalist illustration of a downward pointing zigzag arrow, conveying decline, direction, and a sense of motion. Great for illustrating a negative trend or movement.
Free with trial A striking 3D rendering depicts a significant financial market decline, symbolized by a bold red arrow sharply pointing downwards across a dark grey background. The scene includes a subtle line graph and bar charts in shades of red and grey, illustrating a negative trend in data. This image effectively conveys concepts of economic recession, stock market crash, business losses, and financial crisis. Ideal for articles, presentations, and reports discussing market downturns, investment risks, or economic challenges. Illustrating decrease illustrations Financial Market Decline with Red Arrow Chart. A striking 3D rendering depicts a significant financial market decline, symbolized by a bold red arrow sharply pointing downwards across a dark grey background. The scene includes a subtle line graph and bar charts in shades of red and grey, illustrating a negative trend in data. This image effectively conveys concepts of economic recession, stock market crash, business losses, and financial crisis. Ideal for articles, presentations, and reports discussing market downturns, investment risks, or economic challenges.
Free with trial A close-up shot of a smartphone displaying a stock market chart, showing fluctuating prices. The dark theme enhances the visual impact of the pink graph line, generated by AI for a modern and sleek aesthetic. This image is perfect for illustrating financial technology, mobile trading, and investmen. Illustrating decrease illustrations Mobile Stock Market Chart. A close-up shot of a smartphone displaying a stock market chart, showing fluctuating prices. The dark theme enhances the visual impact of the pink graph line, generated by AI for a modern and sleek aesthetic. This image is perfect for illustrating financial technology, mobile trading, and investmen
Free with trial This image features three bold, three-dimensional arrows pointing sharply downward, each rendered in distinct vibrant colors�'blue, yellow, and red�'symbolizing a significant market downturn, financial loss, or economic decline, set against a clean, minimalist white background that enhances their striking visual impact and conveys urgency and negative momentum in business, trading, or investment. Illustrating decrease illustrations Colorful downward trending financial arrows in blue yellow and red illustrating market decline and economic downturn concepts. This image features three bold, three-dimensional arrows pointing sharply downward, each rendered in distinct vibrant colors�'blue, yellow, and red�'symbolizing a significant market downturn, financial loss, or economic decline, set against a clean, minimalist white background that enhances their striking visual impact and conveys urgency and negative momentum in business, trading, or investment
Free with trial An image illustrating economic decline with falling coin stacks and a downward trending financial chart. Illustrating decrease illustrations Economic downturn depicted by falling coin stacks and declining chart. An image illustrating economic decline with falling coin stacks and a downward trending financial chart
Free with trial A green line graph illustrating data points over time, with the y-axis labeled 'Value' and the x-axis labeled 'Time', showcasing significant ups and downs in the data. Illustrating decrease illustrations Line graph showing fluctuating values over time. A green line graph illustrating data points over time, with the y-axis labeled 'Value' and the x-axis labeled 'Time', showcasing significant ups and downs in the data
Free with trial A striking 3D render illustrating a significant financial or business decline. The image features a minimalist bar chart with three decreasing blue-grey bars, symbolizing a negative trend or falling performance. A prominent, jagged red arrow sharply points downwards across the chart, emphatically conveying concepts of loss, recession, crisis, or market downturn. Set against a vibrant yellow background, this clean and modern graphic is ideal for presentations, reports, articles, or educational materials discussing economic challenges, poor statistics, or business risks. Illustrating decrease illustrations Financial Decline Bar Chart with Red Down Arrow. A striking 3D render illustrating a significant financial or business decline. The image features a minimalist bar chart with three decreasing blue-grey bars, symbolizing a negative trend or falling performance. A prominent, jagged red arrow sharply points downwards across the chart, emphatically conveying concepts of loss, recession, crisis, or market downturn. Set against a vibrant yellow background, this clean and modern graphic is ideal for presentations, reports, articles, or educational materials discussing economic challenges, poor statistics, or business risks.
Free with trial A stark red arrow dramatically descends across a series of blue bars, illustrating a significant downward trend. Illustrating decrease illustrations Red arrow shows sharp decline on blue bar graph. A stark red arrow dramatically descends across a series of blue bars, illustrating a significant downward trend
Free with trial A comprehensive collection of cartoon-style vector icons illustrating key financial and economic concepts. This set includes symbols for market decline, payment processing, bull and bear market dynamics, investment analysis, global currencies, financial balance, and rising interest rates. Ideal for use in business presentations, financial reports, banking websites, educational materials, or any project related to economics and investment. Illustrating decrease vectors Financial and Economic Icons Set. A comprehensive collection of cartoon-style vector icons illustrating key financial and economic concepts. This set includes symbols for market decline, payment processing, bull and bear market dynamics, investment analysis, global currencies, financial balance, and rising interest rates. Ideal for use in business presentations, financial reports, banking websites, educational materials, or any project related to economics and investment.
Free with trial Abstract 3d bar charts illustrating data visualization, financial statistics, and business analysis, presenting growth and decline trends in a report format. Illustrating decrease illustrations Business data visualization showing 3d bar graphs. Abstract 3d bar charts illustrating data visualization, financial statistics, and business analysis, presenting growth and decline trends in a report format
Free with trial A 3D rendering of an open cardboard box marked 'IMPORT' with the word 'TARIFFS' prominently displayed above. This image is ideal for illustrating concepts related to international trade, import duties, customs, global economics, and the impact of tariffs on imported goods. The clean, simple design makes it versatile for various applications. Illustrating decrease illustrations Import Tariffs: Cardboard Box with Tariffs Word and Import Stamp. A 3D rendering of an open cardboard box marked 'IMPORT' with the word 'TARIFFS' prominently displayed above. This image is ideal for illustrating concepts related to international trade, import duties, customs, global economics, and the impact of tariffs on imported goods. The clean, simple design makes it versatile for various applications.
Free with trial This image showcases three gold bars resting on a screen displaying a dynamic stock market chart, generated by AI. The scene is visually striking, suggesting the relationship between gold as an investment and market trends. The high-resolution image is perfect for illustrating financial articles o. Illustrating decrease illustrations Gold Bars & Stock Market Chart. This image showcases three gold bars resting on a screen displaying a dynamic stock market chart, generated by AI. The scene is visually striking, suggesting the relationship between gold as an investment and market trends. The high-resolution image is perfect for illustrating financial articles o
Free with trial Three stacks of coins, each topped with a wooden block featuring a downward-pointing arrow, illustrating a concept of financial loss, economic downturn, or decreasing value against a blue background. Illustrating decrease illustrations Decreasing stacks of coins with down arrows symbolizing financial decline. Three stacks of coins, each topped with a wooden block featuring a downward-pointing arrow, illustrating a concept of financial loss, economic downturn, or decreasing value against a blue background
Free with trial This image presents a compelling visual representation of a global economic downturn. A prominent, three-dimensional white arrow dramatically plunges downward, superimposed on a world map rendered in dark, somber tones. The map serves as a backdrop to several red bar graphs, illustrating a decline in various economic indicators across different regions of the globe. The overall color scheme reinforces a sense of crisis and uncertainty. The arrow's sharp descent visually emphasizes the severity of the economic drop. Numerical data and graphical representations are included, further supporting the downward economic trend. Illustrating decrease illustrations Global Economic Downturn Visualized with 3D Arrow and Charts. This image presents a compelling visual representation of a global economic downturn. A prominent, three-dimensional white arrow dramatically plunges downward, superimposed on a world map rendered in dark, somber tones. The map serves as a backdrop to several red bar graphs, illustrating a decline in various economic indicators across different regions of the globe. The overall color scheme reinforces a sense of crisis and uncertainty. The arrow's sharp descent visually emphasizes the severity of the economic drop. Numerical data and graphical representations are included, further supporting the downward economic trend.
Free with trial The image depicts a downward trending red arrow over a series of stacked gold coins, illustrating a financial decline or loss of wealth. Illustrating decrease illustrations Financial decline illustrated by descending coin stacks and downward arrow. The image depicts a downward trending red arrow over a series of stacked gold coins, illustrating a financial decline or loss of wealth
Free with trial Abstract 3D render of a financial growth chart. The image features a series of vertical bars, some in teal and others in orange, representing data points on a graph. The bars increase in height towards the right, suggesting positive growth or progress. The chart is set against a dark background with a subtle grid pattern and a reflective surface, adding depth and visual interest. Suitable for illustrating financial reports, market analysis, or business trends. Illustrating decrease illustrations Abstract Financial Growth Chart. Abstract 3D render of a financial growth chart. The image features a series of vertical bars, some in teal and others in orange, representing data points on a graph. The bars increase in height towards the right, suggesting positive growth or progress. The chart is set against a dark background with a subtle grid pattern and a reflective surface, adding depth and visual interest. Suitable for illustrating financial reports, market analysis, or business trends.
Free with trial A 3D rendering depicting a stone dollar sign symbol being broken apart by a downward trending red graph. The scene suggests economic downturn, financial crisis, or market instability. The image is ideal for illustrating articles, reports, or presentations related to finance, economics, and investment. The neutral color palette provides versatility for various design applications. Illustrating decrease illustrations Stone Dollar Sign Crumbling with Falling Stock Market Graph. A 3D rendering depicting a stone dollar sign symbol being broken apart by a downward trending red graph. The scene suggests economic downturn, financial crisis, or market instability. The image is ideal for illustrating articles, reports, or presentations related to finance, economics, and investment. The neutral color palette provides versatility for various design applications.
Free with trial A collage of various hand-drawn charts and graphs in shades of blue, illustrating business growth, data analysis, and financial trends. The collection includes bar charts, line graphs, and pie charts, all rendered with a sketchy, artistic style. These visuals are perfect for presentations, reports, or any project requiring a dynamic and informative representation of data and progress. Illustrating decrease illustrations Hand-Drawn Business Growth Charts and Graphs Collection. A collage of various hand-drawn charts and graphs in shades of blue, illustrating business growth, data analysis, and financial trends. The collection includes bar charts, line graphs, and pie charts, all rendered with a sketchy, artistic style. These visuals are perfect for presentations, reports, or any project requiring a dynamic and informative representation of data and progress.
Free with trial A close-up shot captures a pair of hands using red-handled scissors to cut through a white piece of paper with the bold black word "JOBS" printed on it. Set against a clean, light blue background, this powerful visual metaphor symbolizes job loss, unemployment, layoffs, and economic recession. It's an ideal image for illustrating articles, reports, or presentations related to the struggling job market, corporate downsizing, financial insecurity, career challenges, and the broader economic impact of job cuts. Illustrating decrease illustrations Cutting Jobs: Symbol of Unemployment and Economic Crisis. A close-up shot captures a pair of hands using red-handled scissors to cut through a white piece of paper with the bold black word "JOBS" printed on it. Set against a clean, light blue background, this powerful visual metaphor symbolizes job loss, unemployment, layoffs, and economic recession. It's an ideal image for illustrating articles, reports, or presentations related to the struggling job market, corporate downsizing, financial insecurity, career challenges, and the broader economic impact of job cuts.
Free with trial A 3D bar chart with two red bars and one taller green bar, topped by a percentage symbol in a circle. Illustrating decrease illustrations 3d bar chart illustrating percentage growth and decline. A 3D bar chart with two red bars and one taller green bar, topped by a percentage symbol in a circle
Free with trial A minimalist set of hand-drawn icons featuring a dynamic arrow indicating movement or progress and a line graph displaying data trends, perfect for illustrating concepts of growth, analysis, and chang. Illustrating decrease vectors Arrow and graph icons set isolated on transparent background. A minimalist set of hand-drawn icons featuring a dynamic arrow indicating movement or progress and a line graph displaying data trends, perfect for illustrating concepts of growth, analysis, and chang
Free with trial A vibrant red arrow graph dramatically depicts a downward trend, ideal for illustrating concepts of decline, loss, recession, or negative growth. The transparent background allows for seamless integration into various designs, presentations, and reports. This vector graphic is perfect for financial reports, presentations, websites, and social media posts. Illustrating decrease illustrations Red Downward Trending Arrow Graph on Transparent Background. A vibrant red arrow graph dramatically depicts a downward trend, ideal for illustrating concepts of decline, loss, recession, or negative growth. The transparent background allows for seamless integration into various designs, presentations, and reports. This vector graphic is perfect for financial reports, presentations, websites, and social media posts.
Free with trial Two bar graphs, one green showing upward growth and one red showing downward decline, against a white background. Illustrating decrease illustrations Rising and falling bar graphs illustrating financial trends. Two bar graphs, one green showing upward growth and one red showing downward decline, against a white background
Free with trial A striking visual depicting a golden coin with intricate patterns standing upright against a dark, reflective background. A vibrant, glowing red arrow dramatically points downwards towards the coin, symbolizing financial decline, market downturn, or a significant loss in value. This powerful image effectively conveys concepts like investment risk, economic crisis, depreciation of assets, and falling prices. Ideal for illustrating articles, reports, or presentations on financial challenges, stock market crashes, investment warnings, and economic trends. Illustrating decrease illustrations Golden Coin and Red Downward Arrow: Financial Decline Concept. A striking visual depicting a golden coin with intricate patterns standing upright against a dark, reflective background. A vibrant, glowing red arrow dramatically points downwards towards the coin, symbolizing financial decline, market downturn, or a significant loss in value. This powerful image effectively conveys concepts like investment risk, economic crisis, depreciation of assets, and falling prices. Ideal for illustrating articles, reports, or presentations on financial challenges, stock market crashes, investment warnings, and economic trends.
Free with trial Four distinct icons show curved arrows pointing upwards and downwards, some with a percentage symbol, representing financial growth and decline. Illustrating decrease illustrations Financial arrows illustrating percentage changes up and down. Four distinct icons show curved arrows pointing upwards and downwards, some with a percentage symbol, representing financial growth and decline
Free with trial A simple bar chart illustrating data trends with predominantly green bars indicating positive performance and one red bar suggesting a negative outcome, isolated on white. Illustrating decrease illustrations Bar chart with green and red bars isolated on white background. A simple bar chart illustrating data trends with predominantly green bars indicating positive performance and one red bar suggesting a negative outcome, isolated on white
Free with trial Rows of white plastic grocery containers decreasing step-by-step in size on a wooden table, illustrating shrinkflation and reduced purchasing power in consumer products. Illustrating decrease illustrations Grocery Items Gradually Shrinking in Size Concept for Shrinkflation. Rows of white plastic grocery containers decreasing step-by-step in size on a wooden table. Rows of white plastic grocery containers decreasing step-by-step in size on a wooden table, illustrating shrinkflation and reduced purchasing power in consumer products
Free with trial The image shows a stock market crash represented by a downward-sloping line graph against a backdrop of a galaxy filled with stars and nebulous clouds. the line graph, rendered in a light purple hue, indicates a significant decline, culminating in a sharp drop represented by an arrow pointing downwards. the background galaxy adds a dramatic and symbolic layer, suggesting a cosmic scale of economic downturn. Illustrating decrease illustrations Stock market crash in a galaxy background. the image shows a stock market crash represented by a downward-sloping line graph against a backdrop of a galaxy filled with stars and nebulous clouds. the line graph, rendered in a light purple hue, indicates a significant decline, culminating in a sharp drop represented by an arrow pointing downwards. the background galaxy adds a dramatic and symbolic layer, suggesting a cosmic scale of economic downturn.
Free with trial A 3D rendered bar chart illustrates a decreasing trend. The bars, colored in a gradient from yellow to purple, represent data points that are diminishing in value. Placed on a simple gray base, the chart is isolated against a white background. This image is suitable for illustrating concepts related to business, finance, statistics, and economic downturns. Illustrating decrease illustrations 3D Bar Chart Decreasing Trend. A 3D rendered bar chart illustrates a decreasing trend. The bars, colored in a gradient from yellow to purple, represent data points that are diminishing in value. Placed on a simple gray base, the chart is isolated against a white background. This image is suitable for illustrating concepts related to business, finance, statistics, and economic downturns.
Free with trial A visual representation of negative financial performance, illustrating a significant downward trend with a red arrow pointing downwards, indicating a loss or decline in value. Illustrating decrease illustrations Red graph showing a downward trend isolated on white background. A visual representation of negative financial performance, illustrating a significant downward trend with a red arrow pointing downwards, indicating a loss or decline in value
Free with trial A minimalist dark gray bar chart on a white background displays varying heights, illustrating data fluctuations and trends. Illustrating decrease illustrations Simple bar chart showing increasing and decreasing data trends. A minimalist dark gray bar chart on a white background displays varying heights, illustrating data fluctuations and trends
Free with trial A clean and modern digital illustration of a financial candlestick chart, displaying market trends and stock performance. The graph features blue candlesticks indicating price movements over time, accompanied by a solid blue line graph and subtle dashed trend lines. Set against a crisp white background with a clear grid, this visualization is ideal for illustrating concepts related to finance, investment, business analytics, economic forecasts, and data reporting. It conveys growth, volatility, and strategic decision-making in the stock market. Illustrating decrease illustrations Financial Candlestick Chart with Trend Line on White Background. A clean and modern digital illustration of a financial candlestick chart, displaying market trends and stock performance. The graph features blue candlesticks indicating price movements over time, accompanied by a solid blue line graph and subtle dashed trend lines. Set against a crisp white background with a clear grid, this visualization is ideal for illustrating concepts related to finance, investment, business analytics, economic forecasts, and data reporting. It conveys growth, volatility, and strategic decision-making in the stock market.
Free with trial Conceptual image of shrinkflation with two differently sized nut packages on a supermarket shelf, illustrating reduced product quantity while prices remain stable in a shopping cart scenario. Illustrating decrease illustrations Shrinkflation Concept Showing Tiny Grocery Items on Supermarket Shelf. Conceptual image of shrinkflation with two differently sized nut packages on a supermarket shelf, illustrating reduced product quantity while prices remain stable in a shopping cart scenario
Free with trial A comprehensive set of line icons illustrating various e-commerce, retail, and shopping concepts, including payment, discounts, returns, and logistics. Rendered by Ai, this collection provides essential visual tools for web and app interfaces related to buying and selling. Illustrating decrease illustrations E-commerce and Shopping Cart Icon Set. A comprehensive set of line icons illustrating various e-commerce, retail, and shopping concepts, including payment, discounts, returns, and logistics. Rendered by Ai, this collection provides essential visual tools for web and app interfaces related to buying and selling
Free with trial The image features a red neon arrow pointing downwards, reflected on a dark, glossy surface. the background is a deep blue-gray, creating a stark contrast with the bright red of the arrow. the reflection is slightly blurred, adding depth to the image. the arrow appears to be floating, emphasizing its modern and minimalist design. the overall composition is clean and visually striking. Illustrating decrease illustrations Red neon arrow pointing downwards reflection. the image features a red neon arrow pointing downwards, reflected on a dark, glossy surface. the background is a deep blue-gray, creating a stark contrast with the bright red of the arrow. the reflection is slightly blurred, adding depth to the image. the arrow appears to be floating, emphasizing its modern and minimalist design. the overall composition is clean and visually striking.
Free with trial Shopping cart with a downward arrow, bar graph indicating loss, and sad face illustrating declining sales or performance. Ideal for business, ecommerce, market decline, economic loss, analytics. Illustrating decrease vectors Declining Sales Concept with Shopping Cart, Downward Arrow, Bar Graph, and Sad Face. Shopping cart with a downward arrow, bar graph indicating loss, and sad face illustrating declining sales or performance. Ideal for business, ecommerce, market decline, economic loss, analytics
Free with trial Financial trading chart displaying red bearish candlestick patterns and decreasing stock values, illustrating a market downturn, economic loss, and recession risk. Illustrating decrease illustrations Candlestick chart showing stock market financial recession and loss. Financial trading chart displaying red bearish candlestick patterns and decreasing stock values, illustrating a market downturn, economic loss, and recession risk
Free with trial Stock showing diverse collection of black and white for financial data analysis charts and graphs keywords: financial, data, analysis, charts. Illustrating decrease illustrations Diverse Collection of Black and White for Financial Data Analysis Charts and Graphs Keywords: financial, data
Free with trial The image displays a financial trend chart superimposed on a modern office setting. the chart depicts a declining trend, indicated by a downward-sloping line with an arrow pointing downwards. the background features a blurred office environment with windows, a plant, and furniture, creating a sense of realism and context for the financial data. the overall composition suggests a reflection or projection of financial performance within a contemporary workspace. Illustrating decrease illustrations Financial decline chart in modern office space. the image displays a financial trend chart superimposed on a modern office setting. the chart depicts a declining trend, indicated by a downward-sloping line with an arrow pointing downwards. the background features a blurred office environment with windows, a plant, and furniture, creating a sense of realism and context for the financial data. the overall composition suggests a reflection or projection of financial performance within a contemporary workspace.
Free with trial A bar graph with descending blue, yellow, and red bars, accompanied by a downward-pointing arrow, symbolizes economic decline or negative trends on a clean white background. Illustrating decrease illustrations Colorful Bar Graph with Downward Arrow Illustrating Economic Decline. A bar graph with descending blue, yellow, and red bars, accompanied by a downward-pointing arrow, symbolizes economic decline or negative trends on a clean white background
Free with trial A symbolic representation of financial growth, illustrating the concept of zero percent interest with a plant sprouting from a coin-filled jar. Illustrating decrease illustrations A small plant grows from a jar filled with coins, displaying 0 interest. A symbolic representation of financial growth, illustrating the concept of zero percent interest with a plant sprouting from a coin-filled jar
Free with trial A 3D rendered image of a red arrow pointing downwards, suggesting a negative trend or decline. The arrow has a feathered fletching and casts a shadow on a white background, emphasizing the downward direction. The image is clean and minimalist, perfect for illustrating concepts of loss, decline, or. Illustrating decrease illustrations Red Arrow Downward Trend. A 3D rendered image of a red arrow pointing downwards, suggesting a negative trend or decline. The arrow has a feathered fletching and casts a shadow on a white background, emphasizing the downward direction. The image is clean and minimalist, perfect for illustrating concepts of loss, decline, or
Free with trial The image shows a neon pink graph descending sharply against a dark blue, grid-patterned background. the graph starts high on the left, then plummets downwards with some zigzags before leveling out near the bottom. an arrow at the end of the line points downwards, emphasizing the decline. the overall effect is a visual representation of a significant drop or loss. Illustrating decrease illustrations Descending neon graph on a dark blue background. the image shows a neon pink graph descending sharply against a dark blue, grid-patterned background. the graph starts high on the left, then plummets downwards with some zigzags before leveling out near the bottom. an arrow at the end of the line points downwards, emphasizing the decline. the overall effect is a visual representation of a significant drop or loss.
Free with trial The image features a neon white line graph depicting a downward trend, suggesting a decline in value or performance. the graph is set against a dark background, creating a stark contrast that emphasizes the neon light. the presence of shimmering particles around the line adds a sense of movement. a reflective surface below mirrors the graph, enhancing the visual impact and creating a sense of depth. Illustrating decrease illustrations Neon downward trend line with reflection effect. the image features a neon white line graph depicting a downward trend, suggesting a decline in value or performance. the graph is set against a dark background, creating a stark contrast that emphasizes the neon light. the presence of shimmering particles around the line adds a sense of movement. a reflective surface below mirrors the graph, enhancing the visual impact and creating a sense of depth.
Free with trial Closeup of a hand holding vibrant blue graph, illustrating data trends and analysis ,Generative ai. Illustrating decrease illustrations Hand holding a blue graph, data analysis, trends, and performance insights closeup. Closeup of a hand holding vibrant blue graph, illustrating data trends and analysis ,Generative ai
Free with trial A graphic illustrating declining gas prices, featuring a fuel pump and a downward trending red line graph, isolated on a white background. Illustrating decrease illustrations Falling gas prices graph with fuel pump isolated on white background. A graphic illustrating declining gas prices, featuring a fuel pump and a downward trending red line graph, isolated on a white background
Free with trial This image displays a man holding house icons with financial symbols above, illustrating real estate investment. Perfect for conveying property market, financial growth, and home ownership concepts. Ideal for finance and investment related projects. Illustrating decrease illustrations Real estate investment concept with houses and financial symbols on hand. This image displays a man holding house icons with financial symbols above, illustrating real estate investment. Perfect for conveying property market, financial growth, and home ownership concepts. Ideal for finance and investment related projects
Free with trial A visual representation of opposing forces, illustrating concepts such as growth versus decline, positive versus negative trends, or upward and downward movement in various contexts like finance or pe. Illustrating decrease illustrations Red down arrow and green up arrow isolated on white background. A visual representation of opposing forces, illustrating concepts such as growth versus decline, positive versus negative trends, or upward and downward movement in various contexts like finance or pe
Free with trial Abstract stock market chart with red and green candlesticks illustrating financial data and trading trends. Perfect for representing economic analysis, investment strategies, or business reporting. Illustrating decrease illustrations Dynamic Stock Market Chart Displaying Fluctuating Trends and Analytics. Abstract stock market chart with red and green candlesticks illustrating financial data and trading trends. Perfect for representing economic analysis, investment strategies, or business reporting
Free with trial A financial graph depicting a downward trend with a red arrow, blue bar chart, and white line graph on a dark blue grid background. Ideal for illustrating market decline, revenue loss, or negative performance in business, finance, and economic presentations. Illustrating decrease illustrations Declining Financial Graph Red Arrow and Bar Chart on Dark Grid Background. A financial graph depicting a downward trend with a red arrow, blue bar chart, and white line graph on a dark blue grid background. Ideal for illustrating market decline, revenue loss, or negative performance in business, finance, and economic presentations.