Free with trial A 3D rendering of a bar chart featuring three colorful columns: blue, orange, and green, increasing in height from left to right. Two prominent red downward arrows are positioned above the tallest green bar, clearly indicating a decline, decrease, or negative trend. The minimalist design on a clean white background makes it ideal for illustrating business performance, financial reports, economic downturns, sales drops, or any data visualization requiring a clear representation of a negative change or warning. Perfect for presentations, infographics, and analytical content. Illustrating decrease vectors 3D Bar Chart with Red Downward Arrows Showing Decline. A 3D rendering of a bar chart featuring three colorful columns: blue, orange, and green, increasing in height from left to right. Two prominent red downward arrows are positioned above the tallest green bar, clearly indicating a decline, decrease, or negative trend. The minimalist design on a clean white background makes it ideal for illustrating business performance, financial reports, economic downturns, sales drops, or any data visualization requiring a clear representation of a negative change or warning. Perfect for presentations, infographics, and analytical content.
Free with trial Photo of handwritten charts illustrating inflation and potential recession. Graphs show rising prices and economic downturn concerns. Financial crisis concept depicted with, business. Illustrating decrease illustrations Photo of handwritten charts illustrating inflation and potential recession. Graphs show rising prices and economic downturn
Free with trial A person's open palm supports a glowing neon graph illustrating the relationship between cost and quality with upward and downward arrows. Illustrating decrease illustrations Hand holding glowing cost quality graph palm open. A person's open palm supports a glowing neon graph illustrating the relationship between cost and quality with upward and downward arrows
Free with trial Orange Minus Sign in Magnifying Glass Illustrating Reduction. Illustrating decrease vectors Orange Minus Sign in Magnifying Glass Illustrating Reduction
Free with trial Set of alpha transparent business and finance icons drawn in white chalk, illustrating net asset value rising and falling alongside a market chart and Indian currency notation. Illustrating decrease vectors Sketch of mutual fund NAV increase and decrease icons with Indian rupee symbol alpha transparent. Set of alpha transparent business and finance icons drawn in white chalk, illustrating net asset value rising and falling alongside a market chart and Indian currency notation.
Free with trial A hand-drawn bar chart shows a downward trend with a line graph indicating a significant decrease in value over time. Illustrating decrease vectors Downturn graph illustrating declining trends and financial loss. A hand-drawn bar chart shows a downward trend with a line graph indicating a significant decrease in value over time
Free with trial A clean, minimalist graphic featuring two black circles side-by-side against a white background. The left circle contains a prominent white plus symbol, representing addition, increase, or positive aspects. The right circle displays a white minus symbol, signifying subtraction, decrease, or negative aspects. This versatile image is ideal for illustrating concepts of choice, comparison, opposites, data manipulation, or user interface elements. Illustrating decrease illustrations Plus and Minus Symbols in Black Circles. A clean, minimalist graphic featuring two black circles side-by-side against a white background. The left circle contains a prominent white plus symbol, representing addition, increase, or positive aspects. The right circle displays a white minus symbol, signifying subtraction, decrease, or negative aspects. This versatile image is ideal for illustrating concepts of choice, comparison, opposites, data manipulation, or user interface elements.
Free with trial A vibrant, pixelated pink arrow points downwards, set against a dark, textured background with subtle horizontal grey lines. This retro 8-bit style graphic symbolizes decrease, decline, download, or a negative trend. Ideal for illustrating financial data, market downturns, digital alerts, gaming interfaces, or any concept requiring a clear downward direction indicator. Its bold color and distinct pixel art aesthetic make it a versatile design element for technology, business, or creative projects. Illustrating decrease illustrations Pixel Art Down Arrow on Dark Background. A vibrant, pixelated pink arrow points downwards, set against a dark, textured background with subtle horizontal grey lines. This retro 8-bit style graphic symbolizes decrease, decline, download, or a negative trend. Ideal for illustrating financial data, market downturns, digital alerts, gaming interfaces, or any concept requiring a clear downward direction indicator. Its bold color and distinct pixel art aesthetic make it a versatile design element for technology, business, or creative projects.
Free with trial A bold red zigzag arrow points downward, illustrating decline or decrease effectively. Illustrating decrease vectors Red zigzag arrow pointing downward on white background. A bold red zigzag arrow points downward, illustrating decline or decrease effectively.
Free with trial This image features a clear financial chart on a plain white background, illustrating a significant downward trend. A bold red line with an arrow points sharply downwards, symbolizing decline, loss, or a crisis. A grey line, possibly representing historical data or another metric, also shows a general downward movement. This visual effectively conveys concepts of economic recession, market crash, poor business performance, or financial distress. It's ideal for presentations, reports, news articles, or any content discussing negative economic indicators, investment risks, or strategic challenges. Illustrating decrease vectors Financial Chart Illustrating Economic Decline and Market Downturn. This image features a clear financial chart on a plain white background, illustrating a significant downward trend. A bold red line with an arrow points sharply downwards, symbolizing decline, loss, or a crisis. A grey line, possibly representing historical data or another metric, also shows a general downward movement. This visual effectively conveys concepts of economic recession, market crash, poor business performance, or financial distress. It's ideal for presentations, reports, news articles, or any content discussing negative economic indicators, investment risks, or strategic challenges.
Free with trial A 3D render illustrating a concept of financial decline and economic recession. The image features a red bar chart with progressively shorter bars, indicating a downward trend. A bold, red arrow follows this negative trajectory, pointing sharply downwards. Set against a clean, neutral gray background, this graphic powerfully symbolizes concepts like business failure, stock market crash, investment loss, sales decrease, and economic crisis. It's a perfect visual for presentations, reports, and articles discussing financial downturns, poor performance, and negative growth. Illustrating decrease illustrations Financial Decline Graph with Red Arrow Down. A 3D render illustrating a concept of financial decline and economic recession. The image features a red bar chart with progressively shorter bars, indicating a downward trend. A bold, red arrow follows this negative trajectory, pointing sharply downwards. Set against a clean, neutral gray background, this graphic powerfully symbolizes concepts like business failure, stock market crash, investment loss, sales decrease, and economic crisis. It's a perfect visual for presentations, reports, and articles discussing financial downturns, poor performance, and negative growth.
Free with trial Digital Transformation in Real Estate Market with Laptop and House Icon Illustrating Decrease in Property Value Represented by Percent Symbol Sigmoid. Illustrating decrease illustrations A modern workspace with a laptop and digital house icon, showcasing the decline in property value with a percent symbol. Digital Transformation in Real Estate Market with Laptop and House Icon Illustrating Decrease in Property Value Represented by Percent Symbol Sigmoid
Free with trial An isolated vector illustration featuring two prominent, stylized arrows on a clean white background. One arrow, colored in shades of red and pink, points diagonally upwards and to the right, symbolizing growth, increase, or positive trends. The other arrow, rendered in blue and cyan tones, points diagonally downwards and to the left, representing decline, decrease, or negative movement. Both arrows have a modern, slightly textured or sketchy appearance, making them ideal for infographics, business presentations, financial reports, or conceptual designs illustrating contrasting directions, market changes, or comparative data. Illustrating decrease illustrations Growth and Decline Arrows with Sketchy Style. An isolated vector illustration featuring two prominent, stylized arrows on a clean white background. One arrow, colored in shades of red and pink, points diagonally upwards and to the right, symbolizing growth, increase, or positive trends. The other arrow, rendered in blue and cyan tones, points diagonally downwards and to the left, representing decline, decrease, or negative movement. Both arrows have a modern, slightly textured or sketchy appearance, making them ideal for infographics, business presentations, financial reports, or conceptual designs illustrating contrasting directions, market changes, or comparative data.
Free with trial This image depicts a bar graph with a clear downward trend. Blue bars decrease in height from left to right, representing a decline in value. A bold red arrow overlays the bars, visually emphasizing the negative trend. A blue line also shows a downward trend. The image conveys a sense of loss, recession, or negative performance and is suitable for illustrating financial or economic concepts. Illustrating decrease illustrations Declining Bar Graph with Downward Trend Lines. This image depicts a bar graph with a clear downward trend. Blue bars decrease in height from left to right, representing a decline in value. A bold red arrow overlays the bars, visually emphasizing the negative trend. A blue line also shows a downward trend. The image conveys a sense of loss, recession, or negative performance and is suitable for illustrating financial or economic concepts.
Free with trial This image depicts a visual representation of financial or business growth and decline using a series of ascending and descending three-dimensional bar charts, where the left side shows smaller bars gradually increasing in height, transitioning through a central flat bar, and shifting to taller bars on the right side that progressively decrease, all set against a plain white background to. Illustrating decrease illustrations Growth and progress concept with ascending and descending bar charts illustrating business success and financial improvement over. This image depicts a visual representation of financial or business growth and decline using a series of ascending and descending three-dimensional bar charts, where the left side shows smaller bars gradually increasing in height, transitioning through a central flat bar, and shifting to taller bars on the right side that progressively decrease, all set against a plain white background to
Free with trial The image depicts a marketing funnel divided into three distinct stages: Awareness, Consideration, and Conversion. At the top of the funnel, labeled 'Awareness', it represents the initial stage where potential customers become aware of a product or service. The middle section, labeled 'Consideration', illustrates the phase where customers evaluate the product or service, comparing it with others. Illustrating decrease vectors Marketing funnel illustrating awareness, consideration, and conversion. The image depicts a marketing funnel divided into three distinct stages: Awareness, Consideration, and Conversion. At the top of the funnel, labeled 'Awareness', it represents the initial stage where potential customers become aware of a product or service. The middle section, labeled 'Consideration', illustrates the phase where customers evaluate the product or service, comparing it with others.
Free with trial A collection of nine simple, solid black icons on a white background, illustrating concepts of decline, loss, and negative trends using various charts like bar graphs, line graphs, and pie charts with downward pointing arrows. Illustrating decrease vectors Set of black icons representing financial decrease and downward trends. A collection of nine simple, solid black icons on a white background, illustrating concepts of decline, loss, and negative trends using various charts like bar graphs, line graphs, and pie charts with downward pointing arrows
Free with trial Black icon illustrating a downward sloping graph with an arrow indicating decline on a white background. Illustrating decrease illustrations Black icon showing a downward sloping graph with an arrow chart decline. Black icon illustrating a downward sloping graph with an arrow indicating decline on a white background
Free with trial A modern vector illustration of a line graph showing a clear decline, emphasized by a red downtrend arrow. Ideal for financial reports, business presentations, or data visualization projects illustrating negative trends or decreases. This graphic effectively communicates a downward movement in statistics, vector design Generative AI. Illustrating decrease vectors Declining Line Graph with Red Downtrend Arrow, vector design Generative AI. A modern vector illustration of a line graph showing a clear decline, emphasized by a red downtrend arrow. Ideal for financial reports, business presentations, or data visualization projects illustrating negative trends or decreases. This graphic effectively communicates a downward movement in statistics, vector design Generative AI
Free with trial A bright yellow neon arrow points downward on a brick wall, casting light on the floor and creating a dramatic effect, perfect for illustrating direction or warning. Illustrating decrease illustrations Neon Arrow Sign on Brick Wall. A bright yellow neon arrow points downward on a brick wall, casting light on the floor and creating a dramatic effect, perfect for illustrating direction or warning
Free with trial This vector illustration features a set of two minimalist graphs depicting a significant decline. Each graph includes a downward-sloping line chart with an accompanying filled area, clearly indicating a negative trend. One version is presented in black on a white background, while the other is white on a black background, offering versatile usage. This icon is ideal for illustrating concepts of business loss, economic recession, market downturns, financial crisis, poor performance, or any data showing a decrease. Perfect for presentations, reports, infographics, and web design. Illustrating decrease vectors Declining Business Graph Icon Set - Negative Trend Chart. This vector illustration features a set of two minimalist graphs depicting a significant decline. Each graph includes a downward-sloping line chart with an accompanying filled area, clearly indicating a negative trend. One version is presented in black on a white background, while the other is white on a black background, offering versatile usage. This icon is ideal for illustrating concepts of business loss, economic recession, market downturns, financial crisis, poor performance, or any data showing a decrease. Perfect for presentations, reports, infographics, and web design.
Free with trial A graphic illustrating a stress zone with a downward trending chart and arrow. Clear details and vibrant color. Illustrating decrease illustrations Stress zone graphic with downward trending chart and arrow anxiety pressure. A graphic illustrating a stress zone with a downward trending chart and arrow. Clear details and vibrant color
Free with trial Green Circle with White Minus Sign Illustrating Subtraction and Removal Operations. Illustrating decrease illustrations Green Circle with White Minus Sign Illustrating Subtraction and Removal Operations
Free with trial A pair of minimalist line graphs illustrating a downward trend, presented in a high-contrast black on white and white on black design. The arrow at the end clearly indicates a decline, representing concepts like loss, decrease, negative growth, or recession. Ideal for financial reports, business presentations, economic news, data visualization, or any content requiring a clear symbol for falling statistics or poor performance. Illustrating decrease vectors Downward Trend Graph Icon Set - Black and White Decline Chart. A pair of minimalist line graphs illustrating a downward trend, presented in a high-contrast black on white and white on black design. The arrow at the end clearly indicates a decline, representing concepts like loss, decrease, negative growth, or recession. Ideal for financial reports, business presentations, economic news, data visualization, or any content requiring a clear symbol for falling statistics or poor performance.
Free with trial Green bar graph illustrating continuous growth or progress. Illustrating decrease illustrations Green bar graph illustrating continuous growth or progress.
Free with trial A 3D bar graph illustrating a downward trend with a green arrow, featuring a heart icon with a minus sign, on a white background. Illustrating decrease illustrations 3D bar graph with a downward trending green arrow and a heart icon with a minus sign chart. A 3D bar graph illustrating a downward trend with a green arrow, featuring a heart icon with a minus sign, on a white background
Free with trial A simple graphic illustrating a housing market downturn. Illustrating decrease illustrations Real Estate Market Decline Vector Icon. A simple graphic illustrating a housing market downturn
Free with trial A simple line graph with an orange shaded area showing inflow and outflow dynamics with labeled axes and curves. Illustrating decrease illustrations Upward and Downward Sloping Curves Illustrating Inflow and Outflow Dynamics graph chart. A simple line graph with an orange shaded area showing inflow and outflow dynamics with labeled axes and curves
Free with trial This image visually represents a financial decline or economic downturn. Several stacks of shiny gold coins are prominently featured, symbolizing wealth and financial assets. A large, bold red arrow points downwards, directly indicating a decrease or loss. The composition suggests a conceptual representation of falling stock prices, economic recession, or financial crisis. It's ideal for illustrating concepts related to investment losses, market crashes, or financial instability. Illustrating decrease illustrations Financial Downturn: Stacks of Gold Coins with Red Downward Arrow. This image visually represents a financial decline or economic downturn. Several stacks of shiny gold coins are prominently featured, symbolizing wealth and financial assets. A large, bold red arrow points downwards, directly indicating a decrease or loss. The composition suggests a conceptual representation of falling stock prices, economic recession, or financial crisis. It's ideal for illustrating concepts related to investment losses, market crashes, or financial instability.
Free with trial The image displays a green line graph illustrating a sharp decline. the graph is set against a backdrop of a stylized forest scene, also rendered in shades of green. the overall impression is one of environmental or economic downturn, with the forest possibly symbolizing natural resources or a green economy. the graph's dramatic downward trajectory emphasizes the severity of the decline being depicted. Illustrating decrease illustrations Green decline graph with forest background. the image displays a green line graph illustrating a sharp decline. the graph is set against a backdrop of a stylized forest scene, also rendered in shades of green. the overall impression is one of environmental or economic downturn, with the forest possibly symbolizing natural resources or a green economy. the graph's dramatic downward trajectory emphasizes the severity of the decline being depicted.
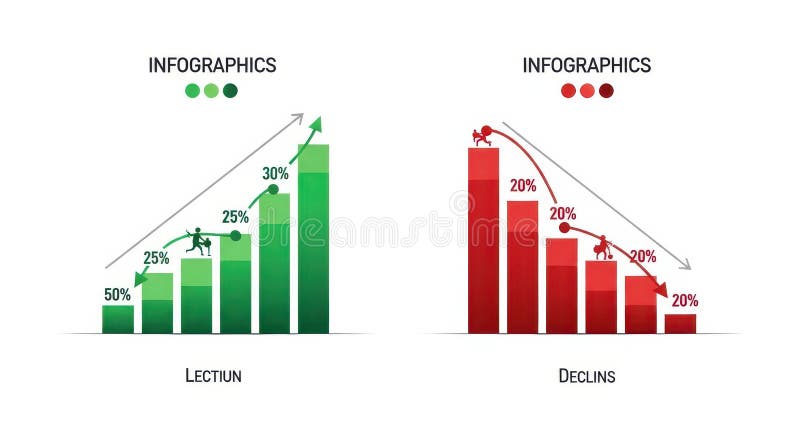
Free with trial The image displays two infographics side by side. the left infographic, titled "lection," depicts a green bar graph showing growth, starting at 50% and increasing to 30% with a figure climbing the bars. an upward-pointing arrow indicates positive growth. the right infographic, titled "declins," shows a red bar graph illustrating decline, starting at 20% and decreasing to 20% with a figure falling down the bars. a downward-pointing arrow indicates negative growth. Illustrating decrease illustrations Infographics showing growth and decline charts. the image displays two infographics side by side. the left infographic, titled "lection," depicts a green bar graph showing growth, starting at 50% and increasing to 30% with a figure climbing the bars. an upward-pointing arrow indicates positive growth. the right infographic, titled "declins," shows a red bar graph illustrating decline, starting at 20% and decreasing to 20% with a figure falling down the bars. a downward-pointing arrow indicates negative growth.
Free with trial Four vibrant lines undulating on a dark dashboard, illustrating progress over time while emphasizing key data points with distinct circles for enhanced clarity and analysis. Illustrating decrease vectors Four vibrant lines undulating on a dark dashboard, illustrating progress over time while emphasizing key data points
Free with trial A red line graph with data points illustrating a downward trend over time, suggesting a decrease in measured values. Illustrating decrease illustrations Declining Trend in Data Analysis Representation. a red line graph with data points illustrating a downward trend over time, suggesting a decrease in measured values
Free with trial A neon red line graph displayed on a black board shows a downward trend, reflected on a glossy surface in a modern room, illustrating financial loss. Illustrating decrease illustrations Red Graph on Black Board Showing Downward Trend. A neon red line graph displayed on a black board shows a downward trend, reflected on a glossy surface in a modern room, illustrating financial loss
Free with trial Black and white icon showing particles falling down a slope with arrows indicating decline. Illustrating decrease illustrations Black and white icon illustrating deleveraging with falling particles and arrows debt reduction. Black and white icon showing particles falling down a slope with arrows indicating decline
Free with trial Colorful line graph illustrating growth and decline over time, with variously colored data points on a dark background, visualizing financial performance and trends. Illustrating decrease vectors Colorful line graph illustrating growth and decline over time, with variously colored data points on a dark background
Free with trial Colorful bar chart illustrating a gradual decrease against a transparent background, highlighting a decline in data and signaling a negative financial trend or recession. Illustrating decrease vectors Bar chart gradually decreasing with transparent background. Colorful bar chart illustrating a gradual decrease against a transparent background, highlighting a decline in data and signaling a negative financial trend or recession
Free with trial A businessman gestures towards a downward-trending red arrow on a graph, illustrating concepts of financial decline, market downturn, economic recession, investment loss, and business failure. The image is clean, using a white background, and ideal for presentations or articles related to financial crisis and negative trends, generated by AI. Illustrating decrease illustrations Businessman showing decreasing red graph arrow down. A businessman gestures towards a downward-trending red arrow on a graph, illustrating concepts of financial decline, market downturn, economic recession, investment loss, and business failure. The image is clean, using a white background, and ideal for presentations or articles related to financial crisis and negative trends, generated by AI.
Free with trial A modern flat design concept illustrating business analytics and sales performance. The scene features a laptop and smartphone displaying a dashboard with various charts, graphs, and statistics for a Q3 report. A world map with a magnifying glass signifies global market analysis and regional breakdown. Additional elements like a checklist and growth decrease icons represent strategic planning, auditing, and financial review. This versatile vector illustration is perfect for presentations, marketing materials, and web design related to finance, data visualization, and business intelligence. Illustrating decrease illustrations Business Analytics and Sales Performance Report Dashboard. A modern flat design concept illustrating business analytics and sales performance. The scene features a laptop and smartphone displaying a dashboard with various charts, graphs, and statistics for a Q3 report. A world map with a magnifying glass signifies global market analysis and regional breakdown. Additional elements like a checklist and growth decrease icons represent strategic planning, auditing, and financial review. This versatile vector illustration is perfect for presentations, marketing materials, and web design related to finance, data visualization, and business intelligence.
Free with trial A sharp red arrow points downwards, illustrating a significant decrease or failure. This visual metaphor is commonly used to represent economic recession, stock market losses, or declining performance. Illustrating decrease illustrations Red downward trend arrow symbolizing financial decline and market downturn. A sharp red arrow points downwards, illustrating a significant decrease or failure. This visual metaphor is commonly used to represent economic recession, stock market losses, or declining performance
Free with trial Colorful bar graph with stacked segments illustrating growth and data analysis. Illustrating decrease vectors Colorful bar graph with stacked segments illustrating growth and data analysis
Free with trial The image depicts a bar graph displayed on an easel, illustrating a downward trend over time. The bars start high on the left and progressively decrease in height towards the right, with a red arrow emphasizing the decline. The graph's y-axis appears to measure an unspecified metric, while the x-axis represents a timeline. Illustrating decrease illustrations Graph showing decline over time. The image depicts a bar graph displayed on an easel, illustrating a downward trend over time. The bars start high on the left and progressively decrease in height towards the right, with a red arrow emphasizing the decline. The graph's y-axis appears to measure an unspecified metric, while the x-axis represents a timeline
Free with trial Cracked gold dollar coin illustrating economic failure debt and financial crisis. Illustrating decrease vectors Cracked gold dollar coin illustrating economic failure debt and financial crisis
Free with trial A suited man observes a declining stock market chart on a large screen in a dimly lit office setting. Great for illustrating finance and business concepts. Illustrating decrease illustrations Man Viewing Falling Stock Market Chart on Screen in Office. A suited man observes a declining stock market chart on a large screen in a dimly lit office setting. Great for illustrating finance and business concepts
Free with trial Falling bar chart with up and right arrows illustrating declining business trends. Illustrating decrease vectors Falling bar chart with up and right arrows illustrating declining business trends
Free with trial A snarling brown bear symbolizes a bear market, with a declining stock chart and red candlestick graph, illustrating financial downturn and investment losses against a dark red background. Illustrating decrease illustrations Bear Market Snarl: Stock Chart Downtrend, Candlestick Graph Plunge. A snarling brown bear symbolizes a bear market, with a declining stock chart and red candlestick graph, illustrating financial downturn and investment losses against a dark red background
Free with trial A simple bar chart with a falling line, symbolizing financial decline, economic downturn, decreased profits, market loss, or negative business results. Ideal for illustrating risks, challenges, crisis situations, and economic analysis. Illustrating decrease vectors Declining financial chart icon with downward trend showing loss, decrease and negative business performance. A simple bar chart with a falling line, symbolizing financial decline, economic downturn, decreased profits, market loss, or negative business results. Ideal for illustrating risks, challenges, crisis situations, and economic analysis.
Free with trial Business data is visually represented in black and white through various charts and graphs illustrating growth analysis and strategic planning for financial reporting showing a clear picture of market. Illustrating decrease vectors Black and white business data visualization with charts and graphs showing growth and analysis for financial reporting and. Business data is visually represented in black and white through various charts and graphs illustrating growth analysis and strategic planning for financial reporting showing a clear picture of market
Free with trial Graphs set with line charts, bar charts, and scatter plots illustrating upward and downward trends with arrows and data points. Illustrating decrease vectors Graphs set with line charts, bar charts, and scatter plots illustrating upward and
Free with trial Simple line graph illustrating a negative trend, representing a decrease or decline in data. Perfect for presentations, reports, or website design. Illustrating decrease vectors Downward Trending Line Graph, Showing Negative Growth or Decline. Simple line graph illustrating a negative trend, representing a decrease or decline in data. Perfect for presentations, reports, or website design.
Free with trial A flat, cartoon-style line graph on a white grid background shows a green upward-pointing arrow representing growth and a red downward-pointing arrow indicating decline, with a red dollar sign placed atop the green arrow to symbolize financial gain, illustrating contrasting economic trends in a simplified, visually engaging manner ideal for business, finance, and investment-related content that. Illustrating decrease illustrations Upward and downward financial trend with green and red arrows on grid graph. A flat, cartoon-style line graph on a white grid background shows a green upward-pointing arrow representing growth and a red downward-pointing arrow indicating decline, with a red dollar sign placed atop the green arrow to symbolize financial gain, illustrating contrasting economic trends in a simplified, visually engaging manner ideal for business, finance, and investment-related content that
Free with trial A vibrant red, three-dimensional zigzag arrow sharply points downwards and to the right, set against a transparent background. This striking graphic effectively symbolizes decline, loss, and negative trends across various sectors. It is ideal for illustrating financial downturns, market crashes, economic recessions, falling stock prices, or any situation depicting a decrease in performance. Perfect for business presentations, financial reports, infographics, and news articles requiring a clear visual representation of a downward trajectory or crisis. Illustrating decrease illustrations Red Downward Zigzag Arrow on Transparent Background. A vibrant red, three-dimensional zigzag arrow sharply points downwards and to the right, set against a transparent background. This striking graphic effectively symbolizes decline, loss, and negative trends across various sectors. It is ideal for illustrating financial downturns, market crashes, economic recessions, falling stock prices, or any situation depicting a decrease in performance. Perfect for business presentations, financial reports, infographics, and news articles requiring a clear visual representation of a downward trajectory or crisis.
Free with trial A minimalist black icon depicting an arrow that features a distinct wavy, oscillating curve before straightening and pointing downwards. This graphic symbolizes a fluctuating decline, an unstable downward trend, or a challenging path with variations. Ideal for illustrating concepts such as market volatility, data fluctuations, difficult progress, or any process involving an unstable decrease. Isolated on a white background for versatile use in web, print, and presentations. Generated by AI. Illustrating decrease vectors Black Wavy Down Arrow Icon. A minimalist black icon depicting an arrow that features a distinct wavy, oscillating curve before straightening and pointing downwards. This graphic symbolizes a fluctuating decline, an unstable downward trend, or a challenging path with variations. Ideal for illustrating concepts such as market volatility, data fluctuations, difficult progress, or any process involving an unstable decrease. Isolated on a white background for versatile use in web, print, and presentations. Generated by AI
Free with trial A minimalist vector icon illustrating a downward trend within a house. Illustrating decrease vectors House Price Decline Vector Icon. A minimalist vector icon illustrating a downward trend within a house
Free with trial A striking 3D rendering showcases a red bar chart dramatically illustrating an economic downturn and financial decline. The downward trending bar chart, emphasized by a prominent red color and a downward-pointing arrow, conveys a sense of decrease and loss within business, finance, and the global economy. This graphic effectively represents concepts such as recession, a bearish market, and. Illustrating decrease illustrations Red bar chart depicting economic downturn or financial decline business and investment concerns. A striking 3D rendering showcases a red bar chart dramatically illustrating an economic downturn and financial decline. The downward trending bar chart, emphasized by a prominent red color and a downward-pointing arrow, conveys a sense of decrease and loss within business, finance, and the global economy. This graphic effectively represents concepts such as recession, a bearish market, and
Free with trial This image depicts a bar and line chart illustrating a significant decline in values. The bars represent discrete data points that decrease progressively, while the line chart overlays the bars, emphasizing the downward trend. The chart uses a blue color scheme for both the bars and the line, with a clear visual representation of a negative progression. The overall design is minimalistic and. Illustrating decrease vectors Downward trend chart showing a decline in values over time. This image depicts a bar and line chart illustrating a significant decline in values. The bars represent discrete data points that decrease progressively, while the line chart overlays the bars, emphasizing the downward trend. The chart uses a blue color scheme for both the bars and the line, with a clear visual representation of a negative progression. The overall design is minimalistic and
Free with trial A minimalist black line graph icon on a clean white background, clearly illustrating a downward trend. The zigzagging line culminates in a sharp arrow pointing downwards, symbolizing decline, decrease, or negative performance. This versatile vector illustration is ideal for representing financial losses, economic downturns, sales drops, market crashes, or any data indicating a negative trajectory. Perfect for business reports, presentations, websites, apps, and infographics requiring a clear visual indicator of reduction or poor results. Illustrating decrease vectors Downward Trend Graph with Arrow Icon. A minimalist black line graph icon on a clean white background, clearly illustrating a downward trend. The zigzagging line culminates in a sharp arrow pointing downwards, symbolizing decline, decrease, or negative performance. This versatile vector illustration is ideal for representing financial losses, economic downturns, sales drops, market crashes, or any data indicating a negative trajectory. Perfect for business reports, presentations, websites, apps, and infographics requiring a clear visual indicator of reduction or poor results.
Free with trial A striking visual representation of a downward trend, featuring a prominent red arrow superimposed over a stack of industrial barrels. The arrow's sharp descent conveys a sense of decrease, loss, or negative movement, making it ideal for illustrating concepts related to economic downturns, stock market drops, or declining production. The industrial setting of the barrels adds a layer of context,. Illustrating decrease illustrations Red arrow pointing down over stacked barrels symbolizing decline. A striking visual representation of a downward trend, featuring a prominent red arrow superimposed over a stack of industrial barrels. The arrow's sharp descent conveys a sense of decrease, loss, or negative movement, making it ideal for illustrating concepts related to economic downturns, stock market drops, or declining production. The industrial setting of the barrels adds a layer of context,
Free with trial A collection of business-related icons illustrating various aspects of business, including target achievement, growth, decline, and organizational structure. Illustrating decrease vectors Vector art of a set of business icons, , representing target achievement, growth, decline, and structure in a business or. A collection of business-related icons illustrating various aspects of business, including target achievement, growth, decline, and organizational structure
Free with trial Conceptual image of a stock market crash. A red arrow falls down on gray steps, symbolizing financial crisis and recession. Perfect for illustrating business and economic downturns. Illustrating decrease illustrations Stock market crash concept with red arrow falling down on gray steps financial crisis and recession 3d. Conceptual image of a stock market crash. A red arrow falls down on gray steps, symbolizing financial crisis and recession. Perfect for illustrating business and economic downturns.
Free with trial A line graph illustrating a fluctuating trend over a period of time. The graph shows an overall upward trend with several peaks and troughs. Illustrating decrease illustrations Graph showing fluctuating trend over time. A line graph illustrating a fluctuating trend over a period of time. The graph shows an overall upward trend with several peaks and troughs
Free with trial A bar chart displayed on an easel, illustrating a negative trend. The bars, a mix of blue and grey, show a progressive decrease in value. A prominent red arrow curves downwards across the chart, signifying a decline or loss. The presentation suggests a financial report or business analysis with unfavorable results. Illustrating decrease illustrations Bar chart showing a downward trend with a red arrow indicating decline. A bar chart displayed on an easel, illustrating a negative trend. The bars, a mix of blue and grey, show a progressive decrease in value. A prominent red arrow curves downwards across the chart, signifying a decline or loss. The presentation suggests a financial report or business analysis with unfavorable results
Free with trial A red downward-pointing graph illustrating a loss, with the word 'LOSS' clearly indicated. Illustrating decrease illustrations Graph showing downward trend indicating loss. A red downward-pointing graph illustrating a loss, with the word 'LOSS' clearly indicated
Free with trial A green percentage symbol with a downward-pointing arrow signifies a drop or decrease. Isolated, it is ideal for illustrating financial losses, rate reductions, or business downturns. It represents negative trends. Illustrating decrease illustrations Green percentage sign with arrow down isolated on white background. for finance, rate, or business use cases. A green percentage symbol with a downward-pointing arrow signifies a drop or decrease. Isolated, it is ideal for illustrating financial losses, rate reductions, or business downturns. It represents negative trends
Free with trial Declining Bar Graph with Downward Trend Arrow Illustrating Economic Loss, Financial Issues, and Market Crash. Illustrating decrease vectors Declining Bar Graph with Downward Trend Arrow Illustrating Economic Loss, Financial Issues, and Market Crash
Free with trial 3D pie chart illustrating data segments with percentage values, alongside a bar graph in the background, showcasing financial or business data. Illustrating decrease illustrations 3D pie chart illustrating data segments with percentage values, alongside a bar graph in the background, showcasing financial or
Free with trial A minimalist line icon illustrating the concept of reducing salt intake for a healthier lifestyle. Illustrating decrease vectors Low Sodium Diet and Healthy Eating Vector Icon. A minimalist line icon illustrating the concept of reducing salt intake for a healthier lifestyle
Free with trial A versatile collection of flat vector icons illustrating concepts of decline, decrease, and loss. This set features various graphics, including downward-pointing arrows, negative trend line graphs, and falling bar charts in multiple colors. These symbols are perfect for representing financial crisis, economic recession, stock market crash, business failure, or any form of reduction. Ideal for use in infographics, presentations, financial reports, websites, and data visualization projects, these modern icons effectively communicate negative trends and downturns. Isolated on a white background for easy integration into any design. Illustrating decrease illustrations Financial Decline and Recession Vector Icon Set. A versatile collection of flat vector icons illustrating concepts of decline, decrease, and loss. This set features various graphics, including downward-pointing arrows, negative trend line graphs, and falling bar charts in multiple colors. These symbols are perfect for representing financial crisis, economic recession, stock market crash, business failure, or any form of reduction. Ideal for use in infographics, presentations, financial reports, websites, and data visualization projects, these modern icons effectively communicate negative trends and downturns. Isolated on a white background for easy integration into any design.
Free with trial A colorful permanent weight loss chart illustrating phases, plateaus, and breakthroughs. Illustrating decrease illustrations A colorful permanent weight loss chart illustrating phases, plateaus, and breakthroughs
Free with trial A clear and modern icon illustrating the action of removing an item from an online shopping cart. Illustrating decrease vectors Ecommerce Icon for Removing an Item from a Cart. A clear and modern icon illustrating the action of removing an item from an online shopping cart
Free with trial A three-dimensional bar graph is depicted against a white background, illustrating a clear downward trend. The bars, transitioning from blue at the highest point to red at the lowest, decrease in height from left to right, visually representing a decline or loss. Illustrating decrease illustrations 3D bar graph showing a downward trend with red and blue bars chart data. A three-dimensional bar graph is depicted against a white background, illustrating a clear downward trend. The bars, transitioning from blue at the highest point to red at the lowest, decrease in height from left to right, visually representing a decline or loss
Free with trial A smartphone screen showcases a modern fintech application featuring a blue and white interface with a declining stock market chart in the top left corner, accompanied by various performance graphs and analytical tools including a portfolio dashboard with spending insights, pie charts, and bar graphs illustrating investment distributions, all designed for comprehensive financial data analysis and. Illustrating decrease illustrations Mobile phone screen displaying fintech app with stock market charts and financial dashboard analytics. A smartphone screen showcases a modern fintech application featuring a blue and white interface with a declining stock market chart in the top left corner, accompanied by various performance graphs and analytical tools including a portfolio dashboard with spending insights, pie charts, and bar graphs illustrating investment distributions, all designed for comprehensive financial data analysis and
Free with trial Dramatic red arrow pointing down symbolizes financial loss, market downturn, or economic recession. Perfect for illustrating concepts of decline, risk, and negative trends in business or finance. Ideal for presentations on economics, investments, and market analysis. Illustrating decrease vectors Red downward arrow indicating financial decline or economic downturn concept. Dramatic red arrow pointing down symbolizes financial loss, market downturn, or economic recession. Perfect for illustrating concepts of decline, risk, and negative trends in business or finance. Ideal for presentations on economics, investments, and market analysis
Free with trial A bar graph illustrating a decline in values with an orange downward arrow indicating loss. Illustrating decrease illustrations Graph showing decline and loss with orange bars and arrow. A bar graph illustrating a decline in values with an orange downward arrow indicating loss
Free with trial Gray bar chart with red line graph and downward arrow, illustrating decline, decrease, loss, and negative trend. Illustrating decrease vectors Bar chart with downward red arrow, symbolizing decline. Gray bar chart with red line graph and downward arrow, illustrating decline, decrease, loss, and negative trend
Free with trial A clean and informative energy report summary displaying winter usage data. The graphic shows a 15% decrease in energy consumption compared to the previous year, indicated by a green checkmark. Ideal for illustrating energy efficiency, sustainability, or cost savings. Illustrating decrease illustrations Energy Report Summary with Winter Usage Statistics. A clean and informative energy report summary displaying winter usage data. The graphic shows a 15% decrease in energy consumption compared to the previous year, indicated by a green checkmark. Ideal for illustrating energy efficiency, sustainability, or cost savings
Free with trial The image depicts a candlestick chart, commonly used in financial trading to represent price movements. The chart includes various colored candlesticks: green, red, orange, and gray. Green candlesticks typically indicate a price increase, while red candlesticks indicate a price decrease. The chart shows a series of these candlesticks over a period, providing insights into market trends and. Illustrating decrease illustrations Detailed candlestick chart illustrating market trends. The image depicts a candlestick chart, commonly used in financial trading to represent price movements. The image depicts a candlestick chart, commonly used in financial trading to represent price movements. The chart includes various colored candlesticks: green, red, orange, and gray. Green candlesticks typically indicate a price increase, while red candlesticks indicate a price decrease. The chart shows a series of these candlesticks over a period, providing insights into market trends and