Free with trial Business man with floating icon show uptrend of business. Income decrease graph illustrations Business man with floating icon show uptrend of business
Free with trial Bankrupt businesswoman put head on table near chart demonstrating crisis fall of stock market. Bankrupt woman investor upset by bad news about stock price decline or fed rate cut for lending. Income decrease graph vectors Bankrupt businesswoman put head on table near chart demonstrating crisis fall of stock market
Free with trial A 3D rendered illustration depicting business growth. The image showcases two upward-trending arrow charts, one in gold and the other in blue, representing positive trends, progress, and success. The charts are set against a clean, light background, emphasizing the upward movement and potential for financial gain. Suitable for illustrating economic growth, investment strategies, and business performance. Income decrease graph illustrations Growth Chart with Arrows. A 3D rendered illustration depicting business growth. The image showcases two upward-trending arrow charts, one in gold and the other in blue, representing positive trends, progress, and success. The charts are set against a clean, light background, emphasizing the upward movement and potential for financial gain. Suitable for illustrating economic growth, investment strategies, and business performance.
Free with trial Dollar sign up and down arrow icon logo sign vector outline in black and white color. Income decrease graph vectors Dollar sign up and down arrow icon logo sign vector outline
Free with trial Stacked coins increase in height with wooden blocks spelling "COST," beside a red arrow pointing left, symbolizing cost reduction or decreasing expenses. Income decrease graph illustrations Coins increase in height with wooden blocks spelling \'COST,\' beside a red arrow pointing left, cost reduction. Stacked coins increase in height with wooden blocks spelling "COST," beside a red arrow pointing left, symbolizing cost reduction or decreasing expenses.
Free with trial Dollar sign up and down arrow icon Vector symbol or sign set collection in black and white outline. Income decrease graph vectors Dollar sign up and down arrow icon mark in filled style. Dollar sign up and down arrow icon Vector symbol or sign set collection in black and white outline
Free with trial Metallic percentage symbol resting atop financial charts. Evokes concepts of interest, discounts, growth, or decline. Great for business, finance, or sales themes. Income decrease graph illustrations Metallic percentage symbol resting atop financial charts. Evokes concepts of interest, discounts, growth, or decline. Great for
Free with trial Three pink dollar signs are shown on a pink background. The dollar signs are positioned in a row, with the middle one slightly higher than the other two. Income decrease graph illustrations Three pink dollar signs are shown on a pink background
Free with trial Three coin stacks on yellow background represent decline. Stacks reduce in size indicating financial loss or decreasing trends. Concept of budget crisis economic, downturn visualized. Income decrease graph illustrations Three coin stacks on yellow background represent decline. Stacks reduce in size indicating financial loss or decreasing trends.
Free with trial Photo of handwritten charts illustrating inflation and potential recession. Graphs show rising prices and economic downturn concerns. Financial crisis concept depicted with, business. Income decrease graph illustrations Photo of handwritten charts illustrating inflation and potential recession. Graphs show rising prices and economic downturn
Free with trial Deflation line icon. Economic crisis sign. Vector illustration. Income decrease graph vectors Deflation line icon. Economic crisis sign
Free with trial A graphic illustration depicting the fluctuating value of digital currency, shown with a price performance chart and coins. this visual represents market ups and downs and financial trends. Income decrease graph vectors Stylized illustration showing digital currency market volatility and virtual coin price trends on financial growth chart. A graphic illustration depicting the. a graphic illustration depicting the fluctuating value of digital currency, shown with a price performance chart and coins. this visual represents market ups and downs and financial trends
Free with trial Percentage sign icon, related to accounting, ideal for financial, tax, or business-related designs. Income decrease graph vectors Professional Percentage Sign Icon for Accounting Purposes. Percentage sign icon, related to accounting, ideal for financial, tax, or business-related designs.
Free with trial Percentage sign icon, related to accounting, ideal for financial, tax, or business-related designs. Income decrease graph vectors Professional Percentage Sign Icon for Accounting Purposes. Percentage sign icon, related to accounting, ideal for financial, tax, or business-related designs.
Free with trial Economy crisis icon logo sign vector outline in black and white color. Income decrease graph vectors Economy crisis icon symbol set collection. Economy crisis simple vector sign bundle. Economy crisis icon logo sign vector outline in black and white color
Free with trial Lower price. Text effect design with modern colors and 3D font look. Income decrease graph vectors Lower price. Text effect with modern colors and 3D font look
Free with trial Lower price. Text effect design with modern colors and 3D font look. Income decrease graph vectors Lower price. Text effect with modern colors and 3D font look
Free with trial Lower price. Text effect design with modern colors and 3D font look. Income decrease graph vectors Lower price. Text effect with modern colors and 3D font look
Free with trial A jar filled with stacked coins, symbolizing savings and financial growth in a modern, blurred background, Generative AI. Income decrease graph illustrations A jar filled with stacked coins, symbolizing savings and financial growth in a modern, blurred background
Free with trial This illustration portrays money circulation with arrows around a dollar coin, symbolizing financial flow and economic activity in a dynamic system. Income decrease graph vectors Vector art of illustration depicting money circulation with arrows around a dollar coin, representing financial flow and economic. This illustration portrays money circulation with arrows around a dollar coin, symbolizing financial flow and economic activity in a dynamic system
Free with trial Lower price. Text effect design with modern colors and 3D font look. Income decrease graph illustrations Lower price. Text effect with modern colors and 3D font look
Free with trial Icon of a splash of poured liquid on the surface. Icon of flowing drop, wave, splash, splash of nature isolated on white background. Dripping liquid. Water spill. A drop of rain and a drop of sweat. Income decrease graph vectors A large splash of spilled liquid on the surface. Icon of a splash of poured liquid on the surface. Icon of flowing drop, wave, splash, splash of nature isolated on white background. Dripping liquid. Water spill. A drop of rain and a drop of sweat
Free with trial Interest growth icon vector logo set collection for web app ui. Income decrease graph vectors Interest Growth Icon Showing Financial Increase, Investment Success, and Economic Trends. Interest growth icon vector logo set collection for web app ui
Free with trial Financial profit decreasing. Money loss concept. Stacked golden coins and red arrow moving downward indicate financial decline. Economic recession shown with falling revenue. Income decrease graph illustrations Decreasing financial profit concept with red arrow trending down and stack of golden coins on white background. Financial profit decreasing. Money loss concept. Stacked golden coins and red arrow moving downward indicate financial decline. Economic recession shown with falling revenue
Free with trial Downward arrow and dollar coin sign, financial challenges, economic fluctuations, navigating complexities of financial. Ideal for conveying concepts of financial loss. 3D render illustration. Income decrease graph illustrations Financial Challenges and Economic Fluctuations, Downward Arrow and Dollar Sign Icon. 3D render. Downward arrow and dollar coin sign, financial challenges, economic fluctuations, navigating complexities of financial. Ideal for conveying concepts of financial loss. 3D render illustration
Free with trial An upward trend in finance represented by stacks of coins and a red arrow, symbolizing growth and prosperity, Generative AI. Income decrease graph illustrations Stack of coins with a red downward arrow, illustrating the effect of falling interest rates on savings. An upward trend in finance represented by stacks of coins and a red arrow, symbolizing growth and prosperity, Generative AI.
Free with trial Interest growth icon logo sign vector outline in black and white color. Income decrease graph vectors Financial Growth Icon Illustrating Investment Gains, Economic Expansion, and Profit Increase. Interest growth icon logo sign vector outline in black and white color
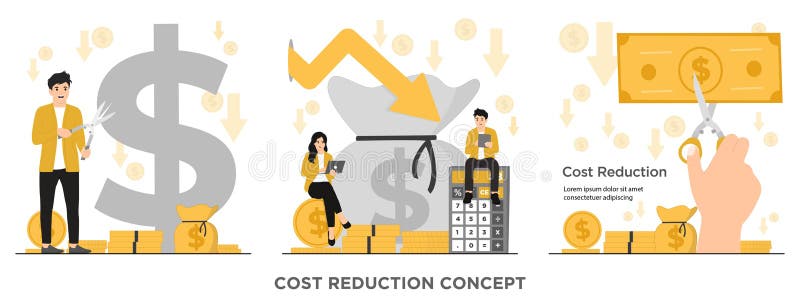
Free with trial Cost Reduction Vector Illustration featuring Decreasing Expenses, Price Minimization, and Falling Profit Rates in Business with a Flat Background. Income decrease graph vectors Cost Reduction Vector Illustration featuring Decreasing Expenses, Price Minimization, and Falling Profit Rates in Business
Free with trial Cost Reduction Vector Illustration featuring Decreasing Expenses, Price Minimization, and Falling Profit Rates in Business with a Flat Background. Income decrease graph vectors Cost Reduction Vector Illustration featuring Decreasing Expenses, Price Minimization, and Falling Profit Rates in Business
Free with trial Cost Reduction Vector Illustration featuring Decreasing Expenses, Price Minimization, and Falling Profit Rates in Business with a Flat Background. Income decrease graph vectors Cost Reduction Vector Illustration featuring Decreasing Expenses, Price Minimization, and Falling Profit Rates in Business
Free with trial Cost Reduction Vector Illustration featuring Decreasing Expenses, Price Minimization, and Falling Profit Rates in Business with a Flat Background. Income decrease graph vectors Cost Reduction Vector Illustration featuring Decreasing Expenses, Price Minimization, and Falling Profit Rates in Business
Free with trial Cost Reduction Vector Illustration featuring Decreasing Expenses, Price Minimization, and Falling Profit Rates in Business with a Flat Background. Income decrease graph vectors Cost Reduction Vector Illustration featuring Decreasing Expenses, Price Minimization, and Falling Profit Rates in Business
Free with trial Cost Reduction Vector Illustration featuring Decreasing Expenses, Price Minimization, and Falling Profit Rates in Business with a Flat Background. Income decrease graph vectors Cost Reduction Vector Illustration featuring Decreasing Expenses, Price Minimization, and Falling Profit Rates in Business
Free with trial Cost Reduction Vector Illustration featuring Decreasing Expenses, Price Minimization, and Falling Profit Rates in Business with a Flat Background. Income decrease graph vectors Cost Reduction Vector Illustration featuring Decreasing Expenses, Price Minimization, and Falling Profit Rates in Business
Free with trial Cost Reduction Vector Illustration featuring Decreasing Expenses, Price Minimization, and Falling Profit Rates in Business with a Flat Background. Income decrease graph vectors Cost Reduction Vector Illustration featuring Decreasing Expenses, Price Minimization, and Falling Profit Rates in Business
Free with trial Vector illustration depicting financial challenges and savings strategies. Scenes show individuals interacting with money-saving tools, analyzing graphs, and managing expenses. Income decrease graph vectors Financial Challenges and Savings Solutions. Vector illustration depicting financial challenges and savings strategies. Scenes show individuals interacting with money-saving tools, analyzing graphs, and managing expenses.
Free with trial Businessman sitting on coin stack with laptop, downturn arrow points at worried man. Financial loss and economic downturn concept. Investment risk management vector illustration. Income decrease graph vectors Businessman sitting on coin stack with laptop, downturn arrow points at worried man. Financial loss and economic
Free with trial Reduction chart icon vector icon on white background. EPS10. Income decrease graph vectors Reduction chartline in Thin line black color. flat simple vector symbols illustration. Reduction chart icon vector icon on white background. EPS10
Free with trial Reduction chart icon vector icon on white background. EPS10. Income decrease graph vectors Reduction chartline in Thin line black color. flat simple vector symbols illustration. Reduction chart icon vector icon on white background. EPS10
Free with trial Reduction chart icon vector icon on white background. EPS10. Income decrease graph vectors Reduction chartline in Thin line black color. flat simple vector symbols illustration. Reduction chart icon vector icon on white background. EPS10
Free with trial Reduction chart icon vector icon on white background. EPS10. Income decrease graph vectors Reduction chartline in Thin line black color. flat simple vector symbols illustration. Reduction chart icon vector icon on white background. EPS10
Free with trial Reduction chart icon vector icon on white background. EPS10. Income decrease graph vectors Reduction chartline in Thin line black color. flat simple vector symbols illustration. Reduction chart icon vector icon on white background. EPS10
Free with trial Reduction chart icon vector icon on white background. EPS10. Income decrease graph vectors Reduction chartline in Thin line black color. flat simple vector symbols illustration. Reduction chart icon vector icon on white background. EPS10
Free with trial Reduction chart icon vector icon on white background. EPS10. Income decrease graph vectors Reduction chartline in Thin line black color. flat simple vector symbols illustration. Reduction chart icon vector icon on white background. EPS10
Free with trial Reduction chart icon vector icon on white background. EPS10. Income decrease graph vectors Reduction chartline in Thin line black color. flat simple vector symbols illustration. Reduction chart icon vector icon on white background. EPS10
Free with trial Reduction chart icon vector icon on white background. EPS10. Income decrease graph vectors Reduction chartline in Thin line black color. flat simple vector symbols illustration. Reduction chart icon vector icon on white background. EPS10
Free with trial Reduction chart icon vector icon on white background. EPS10. Income decrease graph vectors Reduction chartline in Thin line black color. flat simple vector symbols illustration. Reduction chart icon vector icon on white background. EPS10
Free with trial Simple set of isometric flat icons for finance 3. Contains such symbols as Objective, Decision, Time is Money and Decrease. Income decrease graph vectors Simple set of isometric flat icons for finance 3
Free with trial Horizontal collage poster of business people woman man lost money budget isolated on drawing background. Income decrease graph illustrations Horizontal collage poster of business people woman man lost money budget isolated on drawing background
Free with trial Reduction chart icon vector icon on white background. EPS10. Income decrease graph vectors Reduction chartline in Thin line black color. flat simple vector symbols illustration. Reduction chart icon vector icon on white background. EPS10
Free with trial Reduction chart icon vector icon on white background. EPS10. Income decrease graph vectors Reduction chartline in Thin line black color. flat simple vector symbols illustration. Reduction chart icon vector icon on white background. EPS10
Free with trial Discover the power of cost reduction and optimization with our flat vector illustration. Cut costs and boost your business's efficiency today!. Income decrease graph vectors Flat vector costs reduction costs cut costs optimization business concept illustration. Discover the power of cost reduction and optimization with our flat vector illustration. Cut costs and boost your business's efficiency today!
Free with trial Reduction chart icon vector icon on white background. EPS10. Income decrease graph vectors Reduction chartline in Thin line black color. flat simple vector symbols illustration. Reduction chart icon vector icon on white background. EPS10
Free with trial Cost reduction icon web design logo set collection in flat vector. Income decrease graph vectors Cost Reduction Icon Illustrating Business Efficiency Strategies, Budget Management Solutions, and Expense Reduction Programs for. Cost reduction icon web design logo set collection in flat vector
Free with trial Problem of bankruptcy for girl lost savings due to financial crisis, sitting near falling economic chart. Girl is bankruptcy fighter after being fired from job and losing investments. Income decrease graph vectors Problem of bankruptcy for girl lost savings due to financial crisis, sitting near falling chart. Problem of bankruptcy for girl lost savings due to financial crisis, sitting near falling economic chart. Girl is bankruptcy fighter after being fired from job and losing investments.
Free with trial Calculator, coin, dollar sign, green arrows, up, down. Income decrease graph vectors Calculator, coin, dollar sign
Free with trial Discount card line icons set. Marketing and advertising on Internet. Promotions and special offer, loyalty program. Gift and cashback. Cartoon flat vector illustrations isolated on white background. Income decrease graph vectors Discount card line icons set
Free with trial This image shows a cityscape with a downward red arrow indicating economic decline. Vector illustration design using ai tool. Income decrease graph vectors Recession design. This image shows a cityscape with a downward red arrow indicating economic decline. Vector illustration design using ai tool.
Free with trial A hand-drawn chart on a napkin depicts a market downturn, alongside cash and coins. This image, generated by AI, symbolizes economic uncertainty and the informal nature of financial planning. It visually represents potential anxieties surrounding investments and personal finances. Income decrease graph illustrations Napkin Market Crash. A hand-drawn chart on a napkin depicts a market downturn, alongside cash and coins. This image, generated by AI, symbolizes economic uncertainty and the informal nature of financial planning. It visually represents potential anxieties surrounding investments and personal finances.
Free with trial This image shows a financial report with bar graphs and numerical data, generated by AI, suggesting business performance or investment analysis. The document rests on a wooden desk, with coins blurred in the background, hinting at financial matters. Income decrease graph illustrations Financial Report Analysis. This image shows a financial report with bar graphs and numerical data, generated by AI, suggesting business performance or investment analysis. The document rests on a wooden desk, with coins blurred in the background, hinting at financial matters.
Free with trial Dollar Vector illustration on a transparent background. Premium quality symmbols. Line Color vector icons for concept and graphic design. Income decrease graph illustrations Dollar coin money down business. Dollar Vector illustration on a transparent background. Premium quality symmbols. Line Color vector icons for concept and graphic design
Free with trial A simple illustration depicting flat business growth. A horizontal arrow points to the right, indicating stagnation or no significant increase. The chart is clean and minimalist, suitable for presentations, reports, and articles discussing economic challenges or business performance. The image can be used to represent a lack of progress, a plateau in growth, or a need for strategic change. Income decrease graph illustrations Flat Business Growth Chart. A simple illustration depicting flat business growth. A horizontal arrow points to the right, indicating stagnation or no significant increase. The chart is clean and minimalist, suitable for presentations, reports, and articles discussing economic challenges or business performance. The image can be used to represent a lack of progress, a plateau in growth, or a need for strategic change.
Free with trial A visual representation of data, showcasing trends and comparisons through a green bar chart. This graphic illustrates statistical information and growth patterns effectively. Income decrease graph illustrations Bar chart data analysis on. A visual representation of data, showcasing trends and comparisons through a green bar chart. This graphic illustrates statistical information and growth patterns effectively
Free with trial Profit growth icon logo sign vector outline in black and white color. Income decrease graph vectors Profit growth icon logo set vector. profit growth icon logo sign vector outline in black and white color
Free with trial Red arrows pointing downward at dollar banknotes and coins illustrate decreasing value, highlighting themes of devaluation, financial crisis, and economic downturn. Income decrease graph vectors Red arrows pointing downward at dollar banknotes and coins illustrate decreasing value, highlighting themes of
Free with trial Woman looking worried near bar chart with declining arrows, broken piggy bank, and shattered coin, on light abstract background. Concept of economic failure. Vector illustration. Income decrease graph vectors Financial crisis with broken piggy bank. Vector illustration. Woman looking worried near bar chart with declining arrows, broken piggy bank, and shattered coin, on light abstract background. Concept of economic failure. Vector illustration
Free with trial This vibrant illustration depicts financial growth, showcasing a dramatic upward trend after an initial decline. The 3D bar chart and upward arrow, generated by AI, symbolize overcoming challenges and achieving significant financial success. The gold coin further emphasizes the positive outcome. Income decrease graph illustrations AI-Generated Financial Growth Chart. This vibrant illustration depicts financial growth, showcasing a dramatic upward trend after an initial decline. The 3D bar chart and upward arrow, generated by AI, symbolize overcoming challenges and achieving significant financial success. The gold coin further emphasizes the positive outcome.
Free with trial Golden coins stack and up arrow. Flat vector icon isolated on white. Economy, finance, money symbol. Currency pictogram. Vector illustration. Income decrease graph vectors Golden coin sign dollar vector growth vector. golden coins stack and up arrow. Flat vector icon isolated on white. Economy, finance, money symbol. Currency pictogram. Vector illustration
Free with trial Economic Loss icon vector logo set collection or bundle pack group. Income decrease graph vectors Economic Loss icon Flat vector set outline. Economic Loss icon vector logo set collection or bundle pack group
Free with trial Economic Loss icon set in thin line outline style and linear vector sign. Income decrease graph vectors Economic Loss icon set vector illustration. Economic Loss icon set in thin line outline style and linear vector sign
Free with trial Economic Loss icon vector line logo mark or symbol set collection outline style. Income decrease graph vectors Economic Loss icon black and white vector sign. Economic Loss icon vector line logo mark or symbol set collection outline style
Free with trial Reduction chart icon vector logo set collection for web app ui. Income decrease graph vectors Reduction chart icon Thin line illustration set. Reduction chart icon vector logo set collection for web app ui
Free with trial Bankruptcy and inflation business, man in depression. Vector of crisis finance bankruptcy, business economy inflation illustration. Income decrease graph illustrations Bankruptcy and inflation business, man in depression
Free with trial Statistic Up icon outline collection or set in black and white. Income decrease graph vectors Statistic Up icon Line Art Logo set. Statistic Up icon outline collection or set in black and white
Free with trial Economic Loss icon outline collection or set in black and white. Income decrease graph vectors Economic Loss icon Line Art Logo set. Economic Loss icon outline collection or set in black and white
Free with trial Economic Loss icon Black line art vector in black and white outline set collection sign. Income decrease graph vectors Economic Loss icon Black line art vector logo set. Economic Loss icon Black line art vector in black and white outline set collection sign
Free with trial Economic Loss icon linear logo mark set collection in black and white for web. Income decrease graph vectors Economic Loss linear logo mark in black and white. Economic Loss icon linear logo mark set collection in black and white for web
Free with trial Dollar arrow up and down icon vector. USD growth and decline concept. Income decrease graph vectors Dollar arrow up and down icon. USD growth and decline concept
Free with trial A stack of coins with a green arrow pointing down. The coins are stacked on top of each other, with the bottom coin being the largest. Concept of decline or decrease, as the arrow points downward. Income decrease graph illustrations A stack of coins with a green arrow pointing down
Free with trial Economic Loss icon set in thin line outline style and linear vector sign. Income decrease graph vectors Economic Loss icon design in filled and outlined style. Economic Loss icon set in thin line outline style and linear vector sign