Free with trial Dollar up and down icon on circle line. USD currency arrow increase and decrease sign symbol vector. Income decrease graph vectors Dollar up and down icon on circle line. USD currency arrow increase and decrease sign symbol
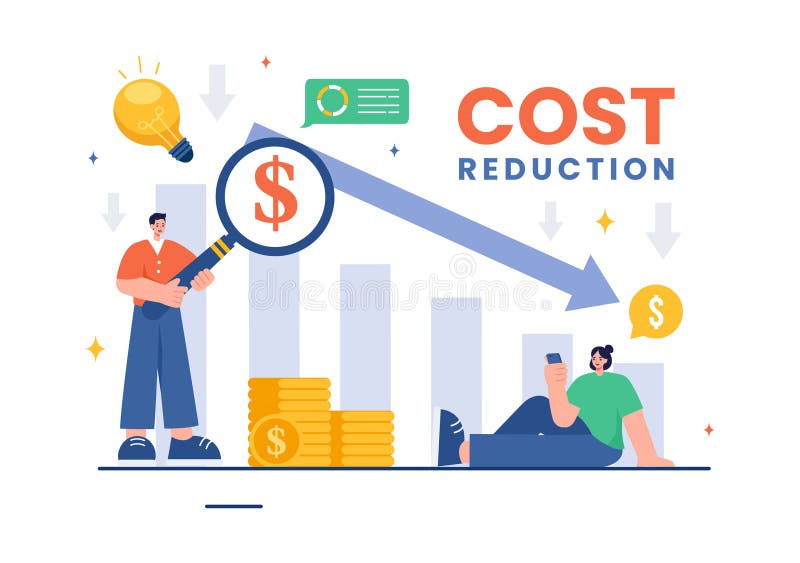
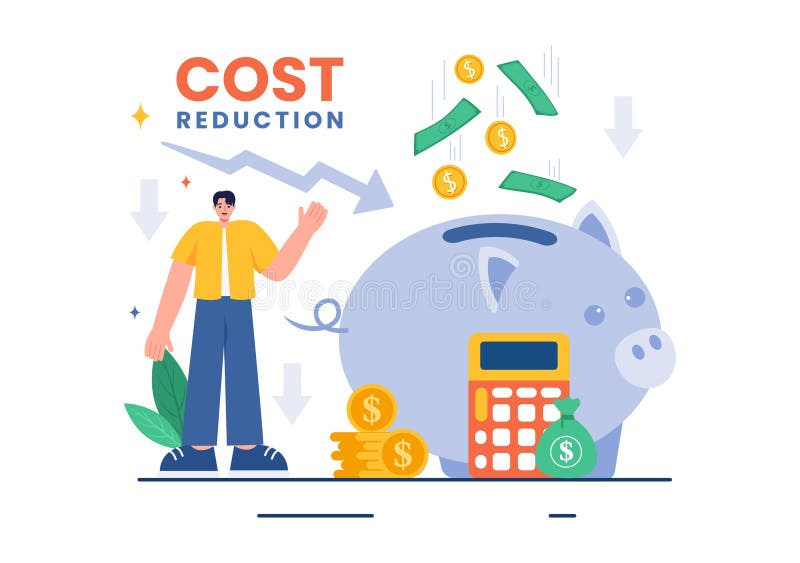
Free with trial Cost Reduction Vector Illustration depicting Decrease, Price Minimization, or Falling Profit Rates in Business, in a Flat Style Cartoon Background. Income decrease graph vectors Cost Reduction Vector Illustration depicting Decrease, Price Minimization, or Falling Profit Rates in Business, in a Flat Style
Free with trial Cost Reduction Vector Illustration depicting Decrease, Price Minimization, or Falling Profit Rates in Business, in a Flat Style Cartoon Background. Income decrease graph vectors Cost Reduction Vector Illustration depicting Decrease, Price Minimization, or Falling Profit Rates in Business, in a Flat Style
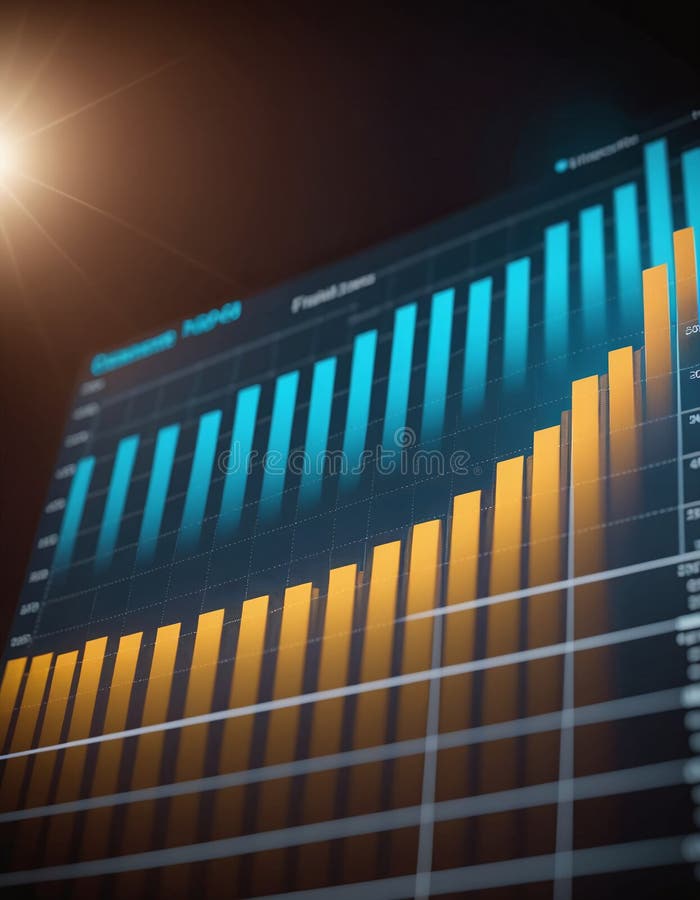
Free with trial Percentage sign on the stack of coin bar chart and red graph trending downward with blur wall background on table. Economy recession crisis, inflation, stagflation, business and financial loss concept. Income decrease graph illustrations Percentage sign on the stack of coin bar chart and red graph trending downward with blur wall background on table.
Free with trial Dollar up and down icon on black circle. USD currency arrow increase and decrease sign symbol vector. Income decrease graph vectors Dollar up and down icon on black circle. USD currency arrow increase and decrease sign symbol
Free with trial Increase and decrease dollar arrow icon. USD up and down sign symbol vector. Income decrease graph vectors Increase and decrease dollar arrow icon. USD up and down sign symbol
Free with trial Drawn down arrow trend graph depicting financial decline and economic downturn. Income decrease graph vectors Drawn down arrow trend graph depicting financial decline and economic downturn
Free with trial Icon dollar money decrease or down, inflation currency, finance and economy. Editable file. Income decrease graph vectors Icon dollar money decrease or down, inflation currency
Free with trial Icon dollar money decrease or down, inflation currency, finance and economy. Editable file. Income decrease graph vectors Icon dollar money decrease or down, inflation currency
Free with trial Bar graph with downward trend, arrows indicating loss, and coins falling. Ideal for finance, economics, business, investment, budgeting revenue loss and decline concepts. Simple flat metaphor. Income decrease graph illustrations Revenue Decline Illustration with Bar Graph, Arrows, and Falling Coins Symbolizing Financial Loss. Bar graph with downward trend, arrows indicating loss, and coins falling. Ideal for finance, economics, business, investment, budgeting revenue loss and decline concepts. Simple flat metaphor
Free with trial Percent growth and decline icon on black circle. Increase and decrease percentage arrow sign symbol vector. Income decrease graph vectors Percent growth and decline icon on black circle. Increase and decrease percentage arrow sign symbol
Free with trial Dollar arrow up and down icon vector. USD currency increase and decrease concept. Income decrease graph vectors Dollar arrow up and down icon. USD currency increase and decrease concept
Free with trial A red arrow chart illustrates an economic recession and financial downturn. The arrow points downward, signifying a decline in the economy. The graph shows a decrease in financial value. Income decrease graph illustrations Simple Presentation of Red Arrow Depicting Economic Recession and Financial Downturn. A red arrow chart illustrates an economic recession and financial downturn. The arrow points downward, signifying a decline in the economy. The graph shows a decrease in financial value.
Free with trial Dollar arrow up and down outline icon vector. USD increase and decrease sign symbol. Income decrease graph vectors Dollar arrow up and down outline icon. USD increase and decrease sign symbol
Free with trial Declining graph showing a financial or business downturn, with bar chart and arrow down. Income decrease graph vectors Declining graph showing a financial or business downturn, with bar chart and arrow down
Free with trial Dollar arrow up and down icon. USD currency increase and decrease sign symbol vector. Income decrease graph vectors Dollar arrow up and down icon. USD currency increase and decrease sign symbol
Free with trial Dollar up and down icon vector. USD currency arrow increase and decrease sign symbol. Income decrease graph vectors Dollar up and down icon. USD currency arrow increase and decrease sign symbol
Free with trial Crystal magic ball and businessman hands with graph up or down inside. Oracle sphere. Investment forecast. Stock exchange volatility. Economy prediction. Financial growth prognosis. Vector concept. Income decrease graph vectors Crystal magic ball and businessman hands with graph up or down inside. Investment forecast. Stock exchange volatility. Economy. Crystal magic ball and businessman hands with graph up or down inside. Oracle sphere. Investment forecast. Stock exchange volatility. Economy prediction. Financial growth prognosis. Vector concept
Free with trial Up and down trend with arrows and graph isolated on dark background. Falling and rising graph with buy and sell buttons. Stock exchange concept. Trader profit and loss. Vector illustration. Income decrease graph vectors Up and down trend with arrows and graph isolated on dark background. Falling and rising graph with buy and sell buttons. Stock
Free with trial Young women calculate rising monthly expenses and decreasing income. Financial Instability concept. trend modern vector flat illustration. Income decrease graph vectors Young women calculate rising monthly expenses and decreasing income. Financial Instability concept.
Free with trial Description: This image depicts an empty shopping cart in a dimly lit room, symbolizing a home finance crisis and a decrease in spending. The empty cart serves as a visual representation of financial struggles and the impact it has on household budgets. The dark atmosphere conveys a sense of uncertainty and stress related to financial difficulties. This photo highlights the importance of budgeting and managing expenses during tough times. Income decrease graph illustrations Home finance crisis: Empty cart charting decrease in spending. Description: This image depicts an empty shopping cart in a dimly lit room, symbolizing a home finance crisis and a decrease in spending. The empty cart serves as a visual representation of financial struggles and the impact it has on household budgets. The dark atmosphere conveys a sense of uncertainty and stress related to financial difficulties. This photo highlights the importance of budgeting and managing expenses during tough times.
Free with trial Description: This image depicts an empty shopping cart in a dimly lit room, symbolizing a home finance crisis and a decrease in spending. The empty cart serves as a visual representation of financial struggles and the impact it has on household budgets. The dark atmosphere conveys a sense of uncertainty and stress related to financial difficulties. This photo highlights the importance of budgeting and managing expenses during tough times. Income decrease graph illustrations Home finance crisis: Empty cart charting decrease in spending. Description: This image depicts an empty shopping cart in a dimly lit room, symbolizing a home finance crisis and a decrease in spending. The empty cart serves as a visual representation of financial struggles and the impact it has on household budgets. The dark atmosphere conveys a sense of uncertainty and stress related to financial difficulties. This photo highlights the importance of budgeting and managing expenses during tough times.
Free with trial Concrete blocks form a downward arrow graph. Business concept of decline, crisis, or falling market trend. Financial data visualization. Income decrease graph illustrations Concrete blocks form a downward arrow graph. Business concept of decline, crisis, or falling market trend
Free with trial Dollar arrow up and down outline icon on black circle. USD increase and decrease sign symbol vector. Income decrease graph vectors Dollar arrow up and down outline icon on black circle. USD increase and decrease sign symbol
Free with trial Up and down dollar arrow outline icon on black circle. Increase and decrease USD sign symbol vector. Income decrease graph vectors Up and down dollar arrow outline icon on black circle. Increase and decrease USD sign symbol
Free with trial Up and down dollar arrow outline icon on circle line. Increase and decrease USD sign symbol vector. Income decrease graph vectors Up and down dollar arrow outline icon on circle line. Increase and decrease USD sign symbol
Free with trial Business and financial concept. Bar graph with a drop-down arrow to show low cost on black background. Income decrease graph vectors Business and financial concept. Bar graph with drop-down arrow to show low cost on black background
Free with trial Business and financial concept. Bar graph with a drop-down arrow to show low cost on black background. Income decrease graph vectors Business and financial concept. Bar graph with drop-down arrow to show low cost on black background
Free with trial A illustration depicting a downward trending bar graph alongside a piggy bank symbolizing a decline in savings and economic downturn The visual clearly communicates financial instability and potential investment losses Ideal for articles on financial news economic forecasts and personal finance. Income decrease graph illustrations Declining Financial Graph with Piggy Bank Illustrating Economic Downturn and Savings Loss AI generated. A illustration depicting a downward trending bar graph alongside a piggy bank symbolizing a decline in savings and economic downturn The visual clearly communicates financial instability and potential investment losses Ideal for articles on financial news economic forecasts and personal finance
Free with trial Illustration of a graph showing the growth of the indian rupee in the stock market. the image represents investment, financial analysis and currency exchange rates in the indian economy. the graph shows an upward trend. Income decrease graph illustrations Indian rupee stock market investment graph chart financial growth and currency exchange rate analysis. illustration of a graph showing the growth of the indian rupee in the stock market. the image represents investment, financial analysis and currency exchange rates in the indian economy. the graph shows an upward trend.
Free with trial Business and financial concept. Bar graph with green upper and red lower arrow to show low cost and high quality on black background. Income decrease graph vectors Business and financial concept. Bar graph with green upper and red lower arrow to show low cost and high quality on black
Free with trial Up and down trend with graph isolated on dark background. Falling and rising graph. Stock exchange concept. Trader profit and loss. Vector illustration. Income decrease graph vectors Up and down trend with graph isolated on dark background. Falling and rising graph. Stock exchange concept. Trader profit and loss
Free with trial An upward trending stock market graph shows business finance investment growth and success. The red arrow indicates positive data analysis and economic trending up. A strong future ahead!. Income decrease graph illustrations Stock market growth chart business finance investment graph arrow up trending data analysis success economy. An upward trending stock market graph shows business finance investment growth and success. The red arrow indicates positive data analysis and economic trending up. A strong future ahead!
Free with trial Declining financial graph with downward arrow on rusty metal texture. Economic crisis concept and recession visual for business trend analysis. Income decrease graph illustrations Declining financial graph with downward arrow on rusty metal texture. Economic crisis concept and recession visua
Free with trial Businessman runs on a green arrow graph rising on a stack of coins. Business growth, wealth creation, financial planning, investment goal, corporate development, economic achievement, profit and loss. Income decrease graph vectors Businessman runs on a green arrow graph rising on a stack of coins. Business growth, wealth creation, financial planning
Free with trial Up and down graphic trend isolated on dark background. Falling and rising graph with buy and sell buttons. Stock exchange concept. Trader profit and loss. Vector illustration. Income decrease graph vectors Up and down graphic trend isolated on dark background. Falling and rising graph with buy and sell buttons. Stock exchange concept
Free with trial Illustration of economic crisis, financial background. Stacks gold coins, US dollars with falling financial graph chart, global economic recession. Stock market crash, investment risk. Income decrease graph illustrations Illustration of economic crisis, financial background. Stacks gold coins, US dollars with falling financial graph chart, global
Free with trial Businessman runs and holds coins on a green arrow graph rising on a stack of coins to coin slot. Growth, wealth create, financial, investment goal, corporate develop, economic, profit and loss. Income decrease graph vectors Businessman runs and holds coins on a green arrow graph rising on a stack of coins to coin slot. Growth, wealth create, financial
Free with trial Businessman runs on a red arrow decrease down on a stack of coins. Business down, wealth creation, financial planning, investment goal, corporate development, economic achievement, profit and loss. Income decrease graph vectors Businessman runs on a red arrow decrease down on a stack of coins. Business down, wealth creation, financial planning, investment
Free with trial A red arrow graph down on a stack of coins. Concepts of business growth, wealth creation, financial planning, investment goal, success, corporate development, economic achievement, profit and loss. Income decrease graph vectors A red arrow graph down on a stack of coins. Concepts of business growth, wealth creation, financial planning, investment goal
Free with trial An arrow graph rising on a stack of coins. Concepts of business growth, wealth creation, financial planning, investment goal, success, corporate development, economic achievement, profit and loss. Income decrease graph vectors An arrow graph rising on a stack of coins. Concepts of business growth, wealth creation, financial planning, investment goal
Free with trial A set of hand-drawn financial graph and chart icons. These icons are suitable for business analysis, investment strategies, and economic growth presentations. Income decrease graph vectors Vector art of hand drawn financial graph and chart icons for business analysis, investment, and economic growth in vector format. A set of hand-drawn financial graph and chart icons. These icons are suitable for business analysis, investment strategies, and economic growth presentations
Free with trial Close-up graphic of financial market graph with dynamic lines. Represents investment volatility, uncertainty, stock price fluctuations. Concept of business success, growth failure in. Income decrease graph illustrations Close-up graphic of financial market graph with dynamic lines. Represents investment volatility, uncertainty, stock price
Free with trial A businessman holds a coin, runs to stack of money bar chart with green graph up. Extend investment in Bull Economy, economic success, financial management, capital market performance, and profit. Income decrease graph vectors A businessman holds a coin, runs to stack of money bar chart with green graph up. Extend investment in Bull Economy, economic
Free with trial Stacks of coins with red stock market graph in background, depicting economic downturn, financial loss, and market crash concept AI Image. stock photo concept. Income decrease graph illustrations Stacks of coins with red stock market graph in background, depicting economic downturn, financial loss, and market crash concept
Free with trial Graph or block diagram shows the increase or decrease of shares, which means financial loss or gain -. Income decrease graph illustrations Graph or block diagram shows the increase or decrease of shares, which means financial loss or gain
Free with trial A businessman holds a coin, runs away from stack of money bar chart with red graph down. Withdraw capital in business recession, economic strategy, financial, market performance, and loss management. Income decrease graph vectors A businessman holds a coin, runs away from stack of money bar chart with red graph down. Withdraw capital in business recession
Free with trial A businessman holds banknotes, runs to stack of money bar chart with green graph up. Extend investment in Bull Economy, economic success, financial management, capital market performance, and profit. Income decrease graph vectors A businessman holds banknotes, runs to stack of money bar chart with green graph up. Extend investment in Bull Economy, economic
Free with trial Concept of economic collapse by falling graph, chart, highlighting global recession fueled by inflation, stock market crash, financial crisis, falling income, GDP decline, capital reduction. Income decrease graph illustrations Concept of economic collapse by falling graph, chart, highlighting global recession fueled by inflation, stock market crash
Free with trial A businessman holds a coin, runs on stack of money bar chart with green graph up. Extend investment in Bull Economy, economic success, financial management, capital market performance, and profit. Income decrease graph vectors A businessman holds a coin, runs on stack of money bar chart with green graph up. Extend investment in Bull Economy, economic
Free with trial A businessman holds banknotes, runs on stack of money bar chart with green graph up. Extend investment in Bull Economy, economic success, financial management, capital market performance, and profit. Income decrease graph vectors A businessman holds banknotes, runs on stack of money bar chart with green graph up. Extend investment in Bull Economy, economic
Free with trial This AI-generated image depicts a calculator displaying "TAX-2025" alongside a bar graph, illustrating potential tax revenue projections for the year. The graph, generated by AI, shows a projected decrease in tax revenue over time. This visualization is helpful for financial planning and forecastin. Income decrease graph illustrations Tax Projections 2025. This AI-generated image depicts a calculator displaying "TAX-2025" alongside a bar graph, illustrating potential tax revenue projections for the year. The graph, generated by AI, shows a projected decrease in tax revenue over time. This visualization is helpful for financial planning and forecastin
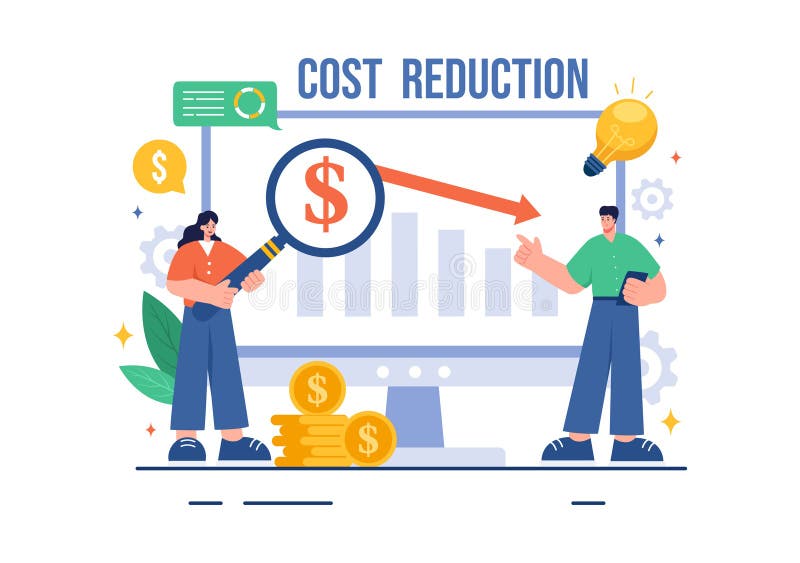
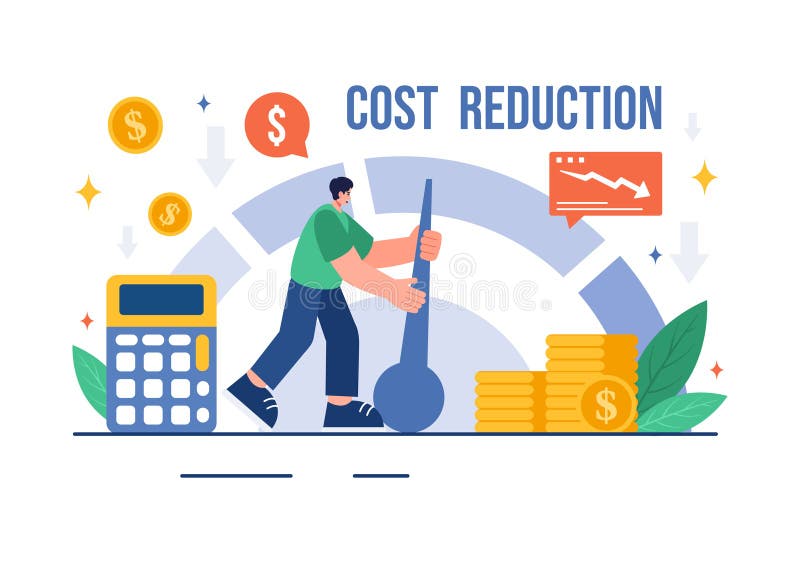
Free with trial Cost Reduction Vector Illustration depicting Decrease, Price Minimization, or Falling Profit Rates in Business, in a Flat Style Cartoon Background. Income decrease graph vectors Cost Reduction Vector Illustration depicting Decrease, Price Minimization, or Falling Profit Rates in Business, in a Flat Style
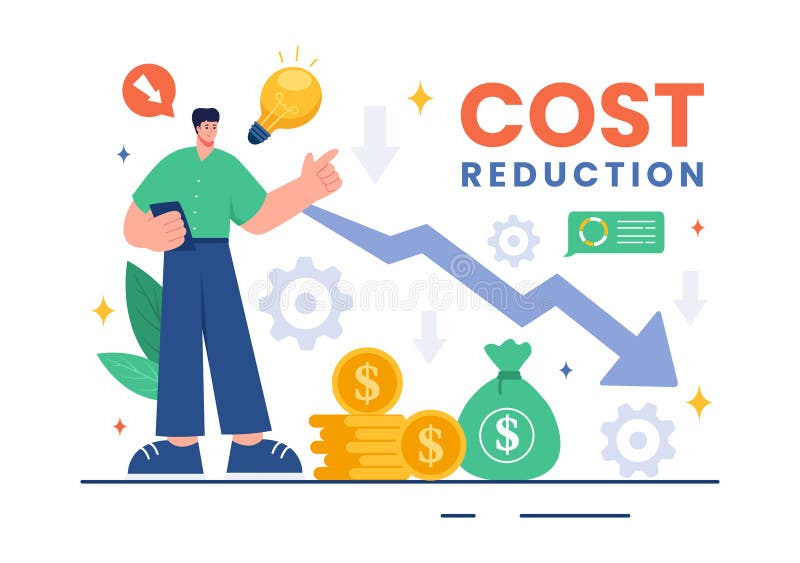
Free with trial Cost Reduction Vector Illustration depicting Decrease, Price Minimization, or Falling Profit Rates in Business, in a Flat Style Cartoon Background. Income decrease graph vectors Cost Reduction Vector Illustration depicting Decrease, Price Minimization, or Falling Profit Rates in Business, in a Flat Style
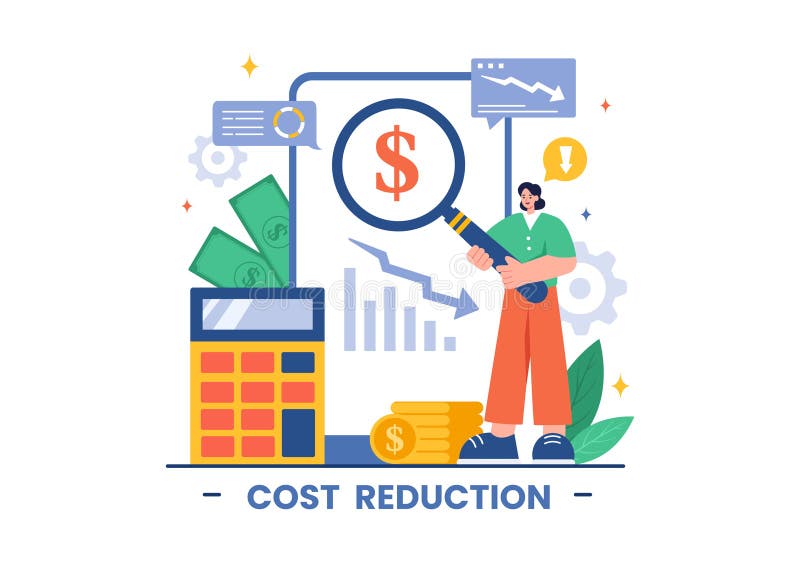
Free with trial Cost Reduction Vector Illustration depicting Decrease, Price Minimization, or Falling Profit Rates in Business, in a Flat Style Cartoon Background. Income decrease graph vectors Cost Reduction Vector Illustration depicting Decrease, Price Minimization, or Falling Profit Rates in Business, in a Flat Style
Free with trial Cost Reduction Vector Illustration depicting Decrease, Price Minimization, or Falling Profit Rates in Business, in a Flat Style Cartoon Background. Income decrease graph vectors Cost Reduction Vector Illustration depicting Decrease, Price Minimization, or Falling Profit Rates in Business, in a Flat Style
Free with trial Cost Reduction Vector Illustration depicting Decrease, Price Minimization, or Falling Profit Rates in Business, in a Flat Style Cartoon Background. Income decrease graph vectors Cost Reduction Vector Illustration depicting Decrease, Price Minimization, or Falling Profit Rates in Business, in a Flat Style
Free with trial Cost Reduction Vector Illustration depicting Decrease, Price Minimization, or Falling Profit Rates in Business, in a Flat Style Cartoon Background. Income decrease graph vectors Cost Reduction Vector Illustration depicting Decrease, Price Minimization, or Falling Profit Rates in Business, in a Flat Style
Free with trial Cost Reduction Vector Illustration depicting Decrease, Price Minimization, or Falling Profit Rates in Business, in a Flat Style Cartoon Background. Income decrease graph vectors Cost Reduction Vector Illustration depicting Decrease, Price Minimization, or Falling Profit Rates in Business, in a Flat Style
Free with trial Cost Reduction Vector Illustration depicting Decrease, Price Minimization, or Falling Profit Rates in Business, in a Flat Style Cartoon Background. Income decrease graph vectors Cost Reduction Vector Illustration depicting Decrease, Price Minimization, or Falling Profit Rates in Business, in a Flat Style
Free with trial Cost Reduction Vector Illustration depicting Decrease, Price Minimization, or Falling Profit Rates in Business, in a Flat Style Cartoon Background. Income decrease graph vectors Cost Reduction Vector Illustration depicting Decrease, Price Minimization, or Falling Profit Rates in Business, in a Flat Style
Free with trial Cost Reduction Vector Illustration depicting Decrease, Price Minimization, or Falling Profit Rates in Business, in a Flat Style Cartoon Background. Income decrease graph vectors Cost Reduction Vector Illustration depicting Decrease, Price Minimization, or Falling Profit Rates in Business, in a Flat Style
Free with trial Cost Reduction Vector Illustration depicting Decrease, Price Minimization, or Falling Profit Rates in Business, in a Flat Style Cartoon Background. Income decrease graph vectors Cost Reduction Vector Illustration depicting Decrease, Price Minimization, or Falling Profit Rates in Business, in a Flat Style
Free with trial Concept of economic collapse by falling graph, chart, highlighting global recession fueled by inflation, stock market crash, financial crisis, falling income, GDP decline, capital reduction. Income decrease graph illustrations Concept of economic collapse by falling graph, chart, highlighting global recession fueled by inflation, stock market crash
Free with trial An image of the dollar rate cut. Money symbol with arrow stretched down, profit reduction, income, economy and income, icons for business concepts. generative ai. Income decrease graph illustrations An image of the dollar rate cut. Money symbol with arrow stretched down, profit reduction, income, economy and income, icons for
Free with trial An image of the dollar rate cut. Money symbol with arrow stretched down, profit reduction, income, economy and income, icons for business concepts. generative ai. Income decrease graph illustrations An image of the dollar rate cut. Money symbol with arrow stretched down, profit reduction, income, economy and income, icons for
Free with trial An image of the dollar rate cut. Money symbol with arrow stretched down, profit reduction, income, economy and income, icons for business concepts. generative ai. Income decrease graph illustrations An image of the dollar rate cut. Money symbol with arrow stretched down, profit reduction, income, economy and income, icons for
Free with trial Unsuccessful investments cause negative emotions in woman standing among declining charts. Girl had bad luck and lost income or investments due to crisis and lack of financial analysis. Income decrease graph vectors Unsuccessful investments cause negative emotions in woman standing among declining charts
Free with trial Consumer purchasing power and consumption down color line icon, vector economic crisis and inflation. Finance and business recession, bankruptcy outline symbol with shopping cart and down arrow graph. Income decrease graph vectors Consumer purchasing power down color line icon. Consumer purchasing power and consumption down color line icon, vector economic crisis and inflation. Finance and business recession, bankruptcy outline symbol with shopping cart and down arrow graph
Free with trial Flat graphic showing a dollar coin with arrows illustrating market fluctuation and volatility, styled as flat cartoon icon. Income decrease graph vectors Investment Fluctuation Illustration Showing Increase and Decrease of Capital. Flat graphic showing a dollar coin with arrows illustrating market fluctuation and volatility, styled as flat cartoon icon.
Free with trial Red arrow going down stock icon on white background. Bankruptcy, financial market crash icon for your web site design, logo, app, UI. graph chart down trend symbol. chart going down sign. Income decrease graph vectors Red arrow going down stock icon on white background. Bankruptcy, financial market crash icon for your web site. Red arrow going down stock icon on white background. Bankruptcy, financial market crash icon for your web site design, logo, app, UI. graph chart down trend symbol.chart going down sign.
Free with trial An illustrative bar chart depicts a clear financial decline, with five orange bars progressively decreasing in height from left to right. Each bar is topped with a black-outlined money bag containing a dollar sign, symbolizing diminishing wealth, income, or investment. This simple, flat design icon effectively conveys concepts of financial loss, economic downturn, decreasing profits, or budget cuts, suitable for business reports, presentations, and articles on market trends or investment risks. Income decrease graph vectors Financial Decline Bar Chart with Money Bags. An illustrative bar chart depicts a clear financial decline, with five orange bars progressively decreasing in height from left to right. Each bar is topped with a black-outlined money bag containing a dollar sign, symbolizing diminishing wealth, income, or investment. This simple, flat design icon effectively conveys concepts of financial loss, economic downturn, decreasing profits, or budget cuts, suitable for business reports, presentations, and articles on market trends or investment risks.
Free with trial Business charts, data visualization, financial analysis, progress tracking, statistics, graphs, analysis, charts bar in line, orange. Income decrease graph vectors Collection of diverse orange bar charts and line graph against a white background. Business charts, data visualization, financial analysis, progress tracking. Business charts, data visualization, financial analysis, progress tracking, statistics, graphs, analysis, charts bar in line, orange
Free with trial Set of circular dollar currency icons with up and down arrows representing profit, loss, exchange and rate changes flat and glyph styles in black, red and green for business and finance use. Income decrease graph vectors Money Currency Icons With Up And Down Arrows Showing Increase And Decrease Financial Trends. Set of circular dollar currency icons with up and down arrows representing profit, loss, exchange and rate changes flat and glyph styles in black, red and green for business and finance use.
Free with trial Gold coins with arrows and graphs pointing up or down. Financial growth. Market decline. Crisis and recession. Statistics chart. Finance success. Increase or decrease cash infographic. Vector concept. Income decrease graph vectors Gold coins with arrows and graphs pointing up or down. Financial growth. Market decline. Crisis and recession. Statistics chart
Free with trial A 3D render depicts a series of translucent blue glass bars arranged in ascending order, representing a bar chart. A large, sharp blue glass arrow points downwards, diagonally crossing the bars and indicating a sharp decline or negative trend. The composition is set against a light gray, subtly textured background, emphasizing the abstract and conceptual nature of the graphic. Income decrease graph illustrations Blue Glass Bar Chart with Downward Arrow Symbolizing Financial Decline graph. A 3D render depicts a series of translucent blue glass bars arranged in ascending order, representing a bar chart. A large, sharp blue glass arrow points downwards, diagonally crossing the bars and indicating a sharp decline or negative trend. The composition is set against a light gray, subtly textured background, emphasizing the abstract and conceptual nature of the graphic
Free with trial Red 3d arrow going down stock icon on white background. Bankruptcy, financial market crash icon for your web site design, logo, app, UI. graph chart downtrend symbol. chart going down sign. Income decrease graph vectors Red 3d arrow going down stock icon on white background. Bankruptcy, financial market crash icon for your web site design
Free with trial Reduce costs concept, business and company to keep cost low, cut spending or expense deduction in budget plan, businessman breaking the graph cost. Income decrease graph vectors Reduce costs concept
Free with trial Red 3d arrow going down stock icon on white background. Bankruptcy, financial market crash icon for your web site design, logo, app, UI. graph chart downtrend symbol. chart going down sign. Income decrease graph vectors Red 3d arrow going down stock icon on white background. Bankruptcy, financial market crash icon for your web site design, logo. Red 3d arrow going down stock icon on white background. Bankruptcy, financial market crash icon for your web site design, logo, app, UI. graph chart downtrend symbol.chart going down sign.
Free with trial Red 3d arrow going down stock icon on white background. Bankruptcy, financial market crash icon for your web site design, logo, app, UI. graph chart downtrend symbol. chart going down sign. Income decrease graph vectors Red 3d arrow going down stock icon on white background. Bankruptcy, financial market crash icon for your web site design