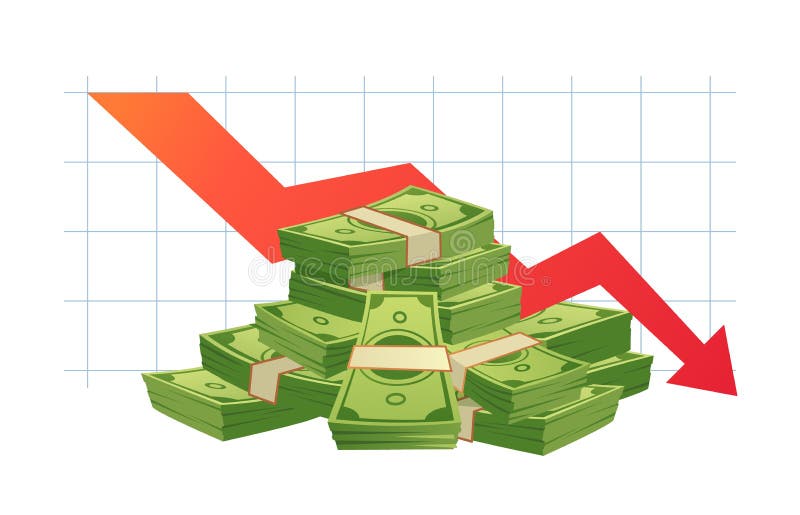
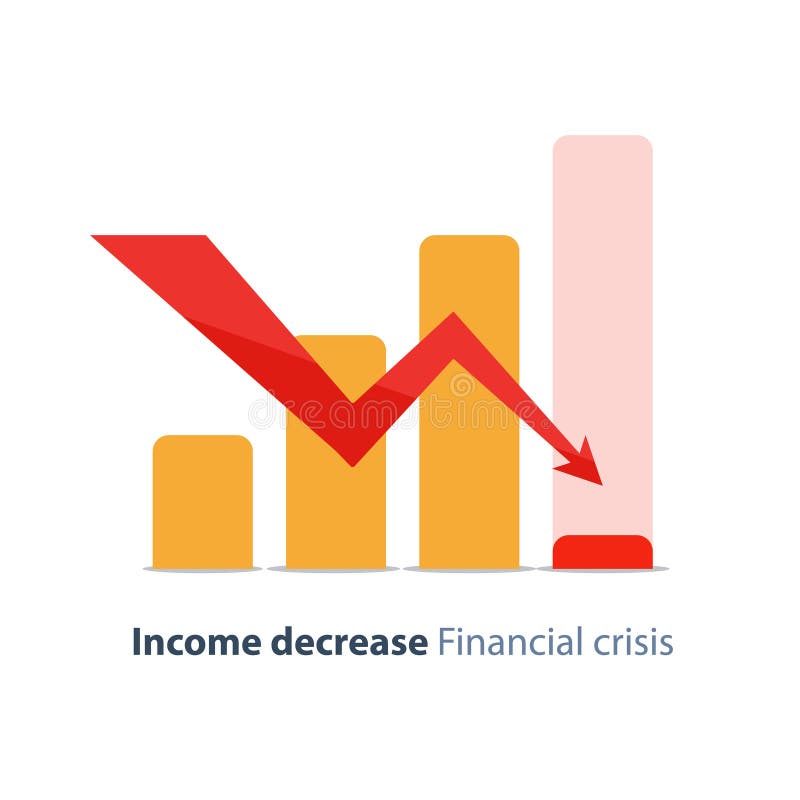
Free with trial Cash loss graph. Finance inflation schedule, money loss and decrease in income. Trader loss data, budget losses graph or investment bankruptcies isolated vector illustration. Income decrease graph vectors Cash loss graph. Finance inflation schedule, money loss and decrease in income vector illustration. Cash loss graph. Finance inflation schedule, money loss and decrease in income. Trader loss data, budget losses graph or investment bankruptcies isolated vector illustration
Free with trial Up and down graph chart icon. Growth increase and decrease sign. Graph or diagram with arrow going up and down. Vector illustration. Income decrease graph illustrations Up and down graph chart icon. Growth increase and decrease sign. Graph or diagram with arrow going up and down. Vector
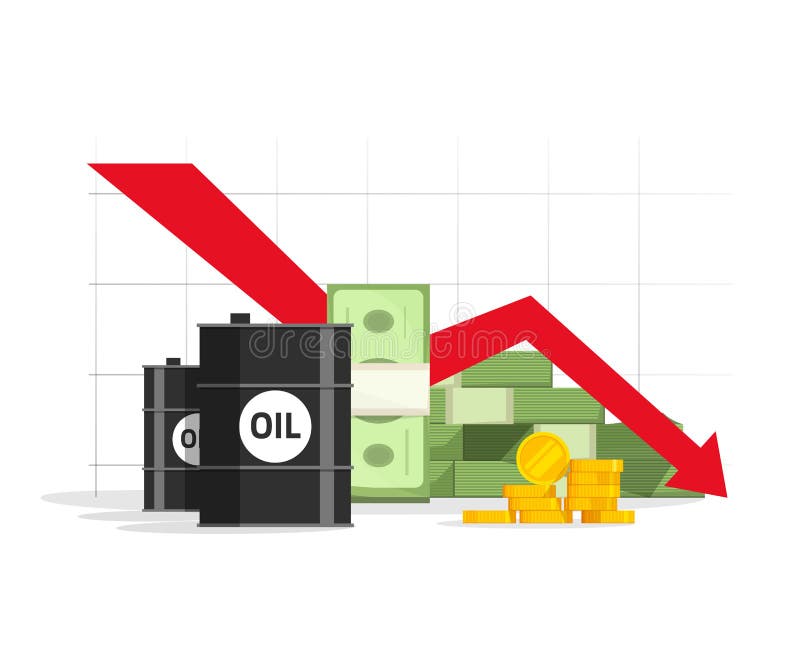
Free with trial Oil, money cash and gold with down arrow graph vector illustration, concept economy crisis, low budget, price decrease, stock market financial data, negative income. Income decrease graph vectors Concept of economy crisis, low budget, price decrease, stock market financial data, negative income. Oil, money cash and gold with down arrow graph vector illustration, concept economy crisis, low budget, price decrease, stock market financial data, negative income
Free with trial A graph showing a positive decrease. Income decrease graph illustrations Graph postively decreasing. A graph showing a positive decrease
Free with trial A graph showing a negative decrease. Income decrease graph illustrations Graph negatively decreasing. A graph showing a negative decrease
Free with trial Up and down graph chart icon. Growth increase and decrease sign. Graph or diagram with arrow going up and down. Vector illustration. Income decrease graph vectors Up and down graph chart icon. Growth increase and decrease sign. Graph or diagram with arrow going up and down. Vector
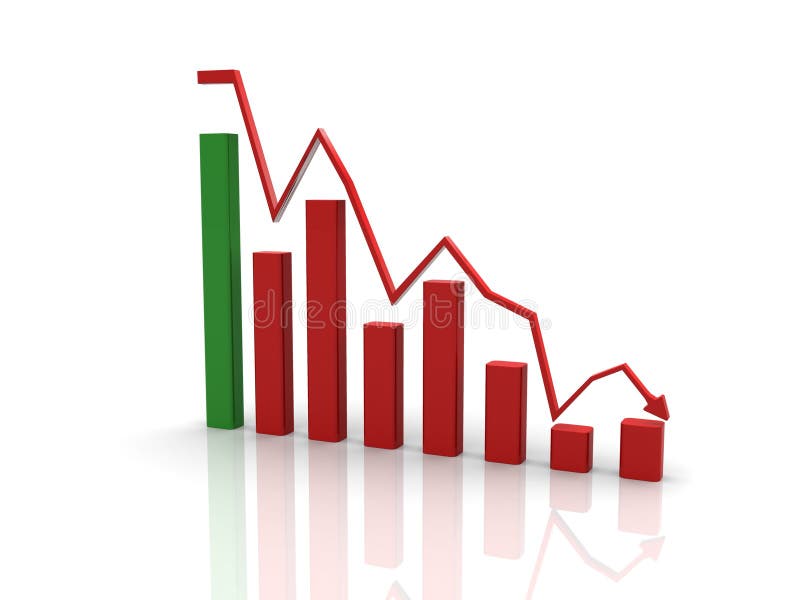
Free with trial Graph showing decrease in profits or earnings in 3D on white background. Income decrease graph illustrations Decrease
Free with trial Graph showing decrease in profits or earnings in 3D. Income decrease graph illustrations Column graph 3d. Graph showing decrease in profits or earnings in 3D
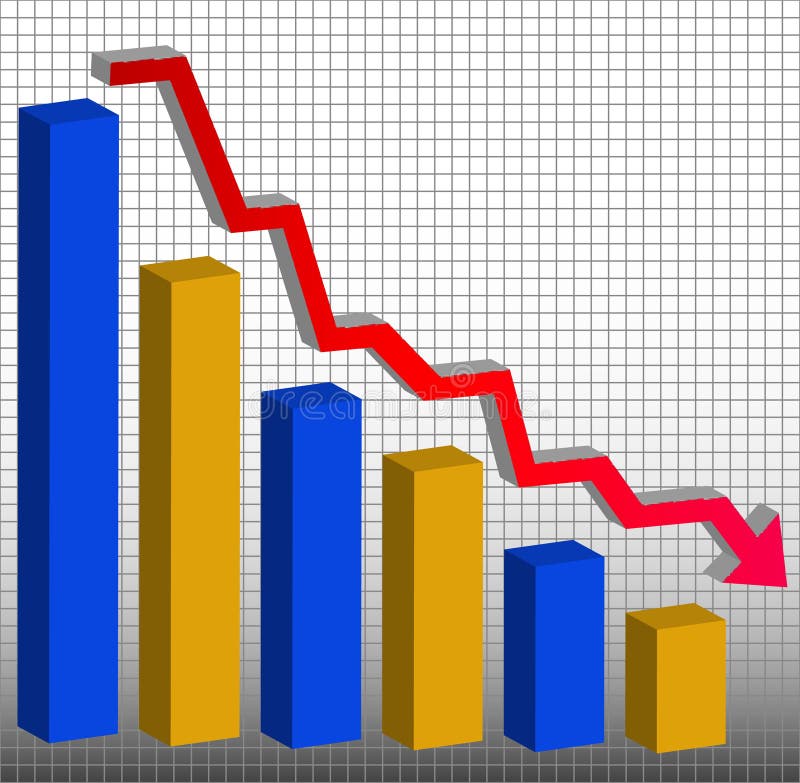
Free with trial Graph showing decrease in profits or earnings in 3D - vector. Income decrease graph vectors Decreasing bar graph. Graph showing decrease in profits or earnings in 3D - vector
Free with trial Laptop financial loss. Screen dollar decrease. Business decline graph. Vector economy illustration. EPS 10. Income decrease graph vectors Laptop financial loss. Screen dollar decrease. Business decline graph. Vector economy illustration.
Free with trial Economic stagnation graph gold coins illustration. Income decrease graph illustrations Economic stagnation graph gold coins
Free with trial Graph showing decrease in profits or earnings in 3D. Income decrease graph illustrations Column graph 3d. Graph showing decrease in profits or earnings in 3D
Free with trial Graph showing decrease in profits or earnings in 3D on white background. Income decrease graph illustrations DECREASING BAR GRAPH in 3d. Graph showing decrease in profits or earnings in 3D on white background
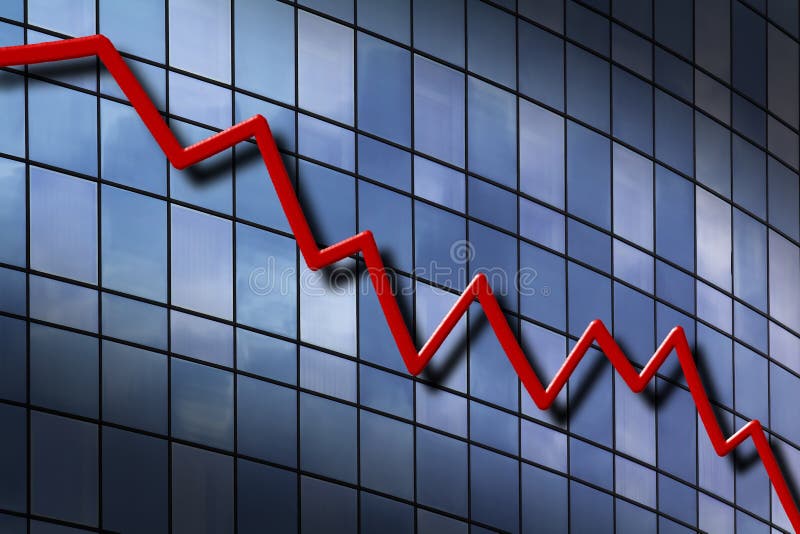
Free with trial Yellow business trend line graph shows financial decline, revenue decrease with white arrow pointing downward, market fall concept. Income decrease graph illustrations Yellow business trend line graph shows financial decline, revenue decrease with white arrow pointing downward
Free with trial Business failure. Down trend graph and try to rebound , Vector Illustration. Income decrease graph vectors Business failure.Down trend graph and try to rebound
Free with trial Profit decrease fall arrow and percent icon. Vector GDP profit loss arrow down symbol. Income decrease graph vectors Profit decrease fall arrow and percent icon. Vector GDP profit loss arrow down
Free with trial Decline and decrease of GDP Gross domestic product - failure and breakdown of economy and finances leading to financial crisis and trouble. Vector illustration of graph, chart and diagram. Income decrease graph illustrations Decline of GDP in EU. Decline and decrease of GDP Gross domestic product - failure and breakdown of economy and finances leading to financial crisis and trouble. Vector illustration of graph, chart and diagram
Free with trial Up and down graph chart icon. Growth increase and decrease sign. Graph or diagram with arrow going up and down. Vector illustration. Income decrease graph vectors Up and down graph chart icon. Growth increase and decrease sign. Graph or diagram with arrow going up and down. Vector
Free with trial Business crisis concept. money fall down with arrow decrease symbol. economy stretching rising drop, global lost bankrupt. cost declining reduction or loss of income with stack pile dollar coins, bankruptcy, decreasing, recession, decline, inflation, low, lower, failure, falling, crash, risk, rise, investment, currency, pricing, profit, cut, finance, price, rate, graphic, diagram, chart, stock, exchange, economic, financial, world, market, element, shape, background, design, icon, vector, illustration. Income decrease graph vectors Business crisis concept. money fall down with arrow decrease symbol. economy stretching rising drop, global lost bankrupt. cost
Free with trial Computer generated design. Stylized graph background with arrows pointing to US dollar bill. Image could be used to communicate deficit or surplus. Income decrease graph illustrations Stretch Money Down. Computer generated design. Stylized graph background with arrows pointing to US dollar bill. Image could be used to communicate deficit or surplus.
Free with trial 3D graph showing decrease in profits or earnings. Income decrease graph illustrations Down Trend Chart. 3D graph showing decrease in profits or earnings.
Free with trial Bar graph showing a downward trend, business decline, economic decrease, market analysis, financial chart. Income decrease graph vectors Bar chart with downward trend arrow business decline graph. Bar graph showing a downward trend, business decline, economic decrease, market analysis, financial chart
Free with trial Decreasing graph and pension word on blackboard background. Income decrease graph vectors Pension Down Blackboard. Decreasing graph and pension word on blackboard background
Free with trial Cost reduction web banner or landing page set. Idea of financial and marketing strategy. Cost and income balance. Spending and cost optimization. Flat illustration vector. Income decrease graph vectors Cost reduction web banner or landing page set. Idea of financial
Free with trial An illustration featuring bags of money and coins set against blue charts or graphs with arrows pointing up and down to represent making and losing money. Income decrease graph illustrations Making and Losing Money
Free with trial Graph going down and up sign with green and red arrows vector. Bar chart symbol icon with arrow moving down and sales bar chart with arrow moving up. Income decrease graph vectors Graph going down and up sign with green and red arrows vector. Bar chart symbol icon with arrow moving down and sales bar chart
Free with trial Red dollar sign with arrow down. Concept bankruptcy, financial collapse, depression, failure, money crisis. Computer generated image. Income decrease graph illustrations Red dollar sign with arrow down.
Free with trial Chart made of dollar symbols vector illustration. Income decrease graph vectors Chart
Free with trial Business work icon set 4, vector eps10. Income decrease graph vectors Business work icon set 4, vector eps10
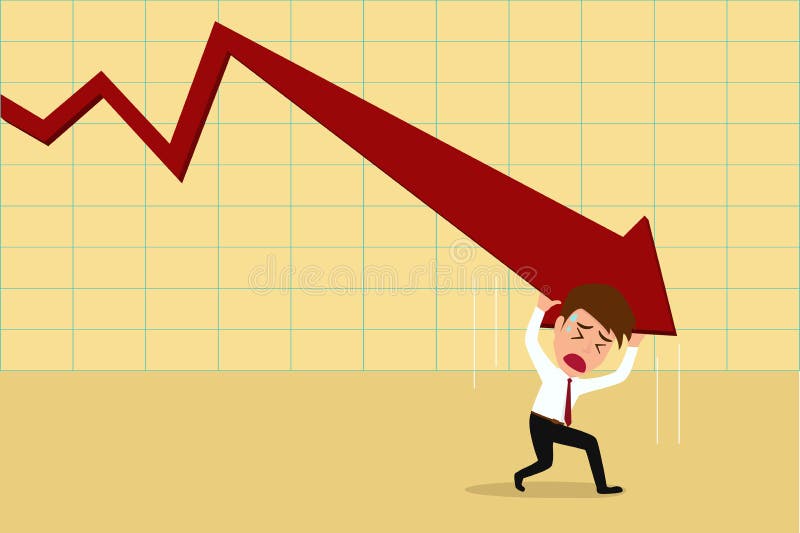
Free with trial Two businessmen desperately hold a falling arrow graph with flying money bills, symbolizing inflation, crisis, and business failure, isolated on white background vector illustration. Income decrease graph vectors Businessmen struggle with falling financial graph. Two businessmen desperately hold a falling arrow graph with flying money bills, symbolizing inflation, crisis, and business failure, isolated on white background vector illustration
Free with trial Colorful business chart vector illustration. Income decrease graph vectors Chart illustration. Colorful business chart vector illustration
Free with trial Red dollar sign with arrow down breaking floor. Concept bankruptcy, financial collapse, depression, failure, money crisis. Computer generated image. Income decrease graph illustrations Red dollar sign with arrow down breaking floor.
Free with trial Financial chart of revenue and loss. Income decrease graph vectors Profit Revenue Chart. Financial chart of revenue and loss
Free with trial Decline graph line outline icon isolated on white. Vector illustration. Income decrease graph vectors Decline graph line outline icon
Free with trial Financial chart of revenue and loss. Income decrease graph vectors Profit Revenue Chart. Financial chart of revenue and loss
Free with trial 3D Illustration of business chart up and down. Income decrease graph illustrations Chart up and down
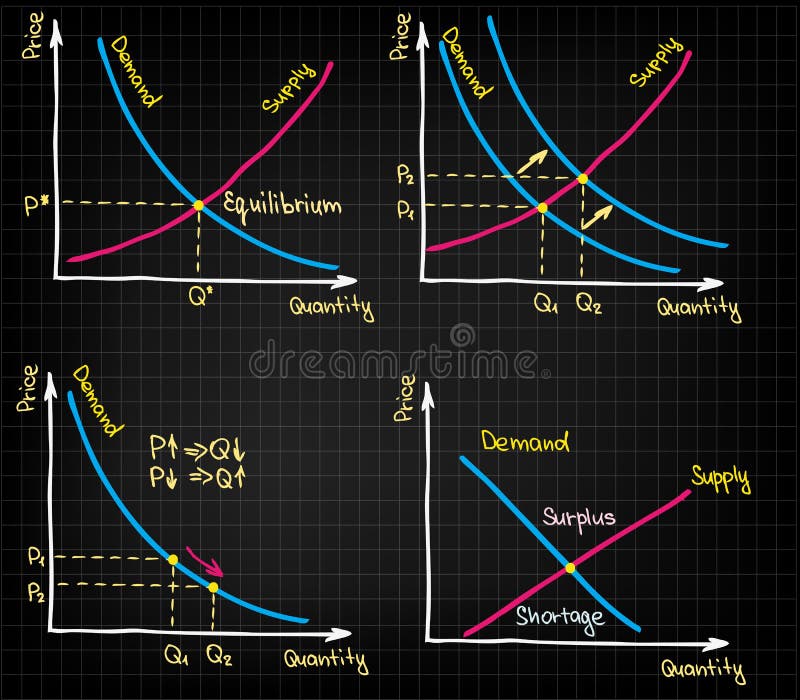
Free with trial Sketched charts and graphs of supply and demand. Income decrease graph vectors Demand Supply Charts. Sketched charts and graphs of supply and demand
Free with trial Tax Graph Down : A Tax Graph Down represents a decrease in tax revenue or a financial decline. Income decrease graph vectors Tax Graph Down
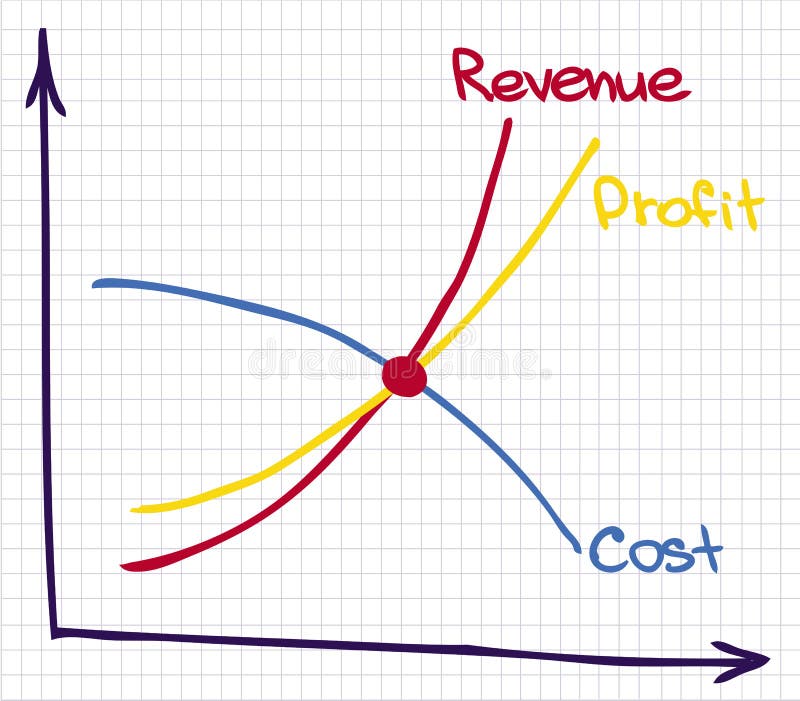
Free with trial Financial chart of revenue and loss. Income decrease graph vectors Profit Revenue Cost Chart. Financial chart of revenue and loss
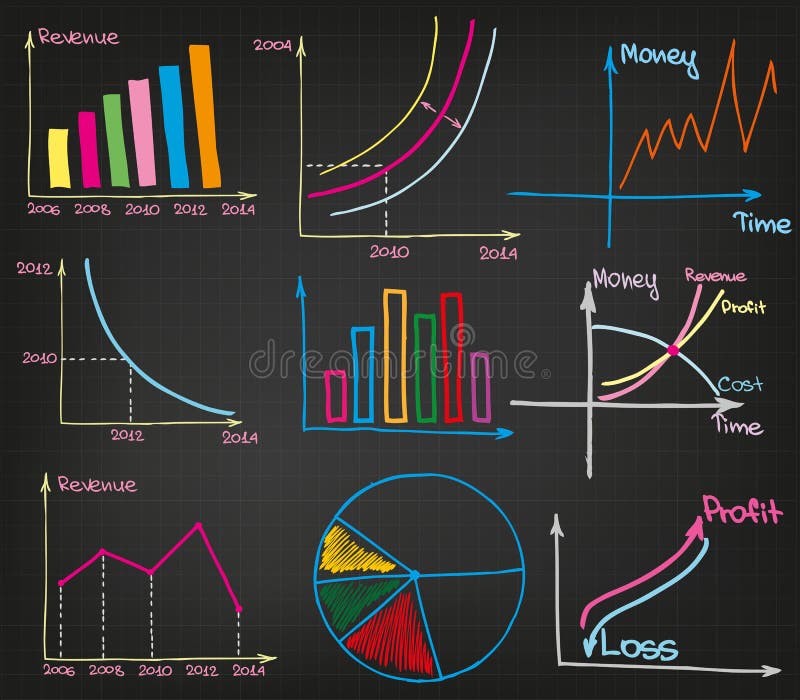
Free with trial Different kinds of set for business charts. Income decrease graph vectors Profit Charts. Different kinds of set for business charts
Free with trial Economic downturn, financial stress, investment failure, business loss, market decline, risk. Line graph shows downward trend. Financial stress and economic downturn. Income decrease graph illustrations Financial Loss Concept with Declining Line Graph, Sad Face, and Coin Symbol. Economic downturn, financial stress, investment failure, business loss, market. Economic downturn, financial stress, investment failure, business loss, market decline, risk. Line graph shows downward trend. Financial stress and economic downturn
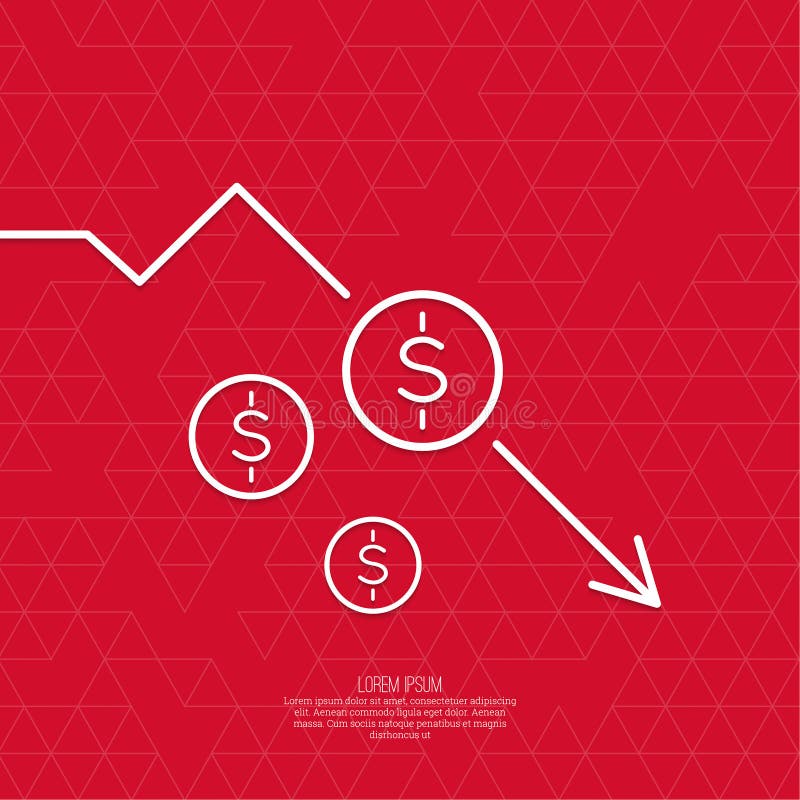
Free with trial The graph shows the fall and profits decline. Loss of points Currency. Falling through asset outflows. Red background. dollar symbol. minimal. Outline. Income decrease graph vectors Loss of points Currency
Free with trial Business of the analyst with shooters and infographics. Income decrease graph vectors Business analytics. Business of the analyst with shooters and infographics
Free with trial Reduced rate, decline icon, eps 10 file, easy to edit. Income decrease graph illustrations Reduced rate, decline icon
Free with trial This illustration depicts a financial concept with a bar graph showing a downward trend, alternating between green (profit) and red (loss) bars. A red line graph with an arrow indicates a significant decline. To the right, a stack of documents represents a profit and loss statement, with 'Profit' and 'Loss' clearly labeled. This visual is ideal for representing financial performance, business challenges, economic downturns, or the need for strategic adjustments. Income decrease graph vectors Declining Profit and Loss Statement with Downward Trend Graph. This illustration depicts a financial concept with a bar graph showing a downward trend, alternating between green (profit) and red (loss) bars. A red line graph with an arrow indicates a significant decline. To the right, a stack of documents represents a profit and loss statement, with 'Profit' and 'Loss' clearly labeled. This visual is ideal for representing financial performance, business challenges, economic downturns, or the need for strategic adjustments.
Free with trial Businessman looking at chart showing economic recession. business concept. Income decrease graph vectors Businessman looking at chart showing economic recession
Free with trial The business concept of both crisis and recovery. Income decrease graph illustrations The business concept of both crisis and recovery
Free with trial Creative vector illustration of revenue, profit, expenses diagram showing infographic isolated on transparent background. Art design business planning template. Abstract concept graphic element. Income decrease graph vectors Creative vector illustration of revenue, profit, expenses diagram showing infographic isolated on transparent background
Free with trial A dollar bill connected to a bar graph resembling a sound wave with an arrow. Clear details and vibrant colors. Income decrease graph illustrations Dollar Bill and Sound Wave Bar Graph with Arrow money finance. A dollar bill connected to a bar graph resembling a sound wave with an arrow. Clear details and vibrant colors
Free with trial Creative vector illustration of revenue, profit, expenses diagram showing infographic isolated on transparent background. Art design business planning template. Abstract concept graphic element. Income decrease graph vectors Creative vector illustration of revenue, profit, expenses diagram showing infographic isolated on transparent background
Free with trial Simple glyph style icons designed on a 32x32 pixel grid and redesigned on a 16x16 pixel grid for maximum sharpness at small sizes. Income decrease graph vectors Savings & Finance | Granite Icons. Simple glyph style icons designed on a 32x32 pixel grid and redesigned on a 16x16 pixel grid for maximum sharpness at small sizes.
Free with trial Income decrease graph, financial crisis rate, revenue decline chart, economy downturn, investment risk, fund management, budget deficit, vector illustration, flat icon. Income decrease graph vectors Budget deficit, income decrease, economy decline, financial crisis, investment risk. Income decrease graph, financial crisis rate, revenue decline chart, economy downturn, investment risk, fund management, budget deficit, vector illustration, flat icon
Free with trial A 3D rendered icon depicting a blue document with a raised bar graph. The bar graph features alternating blue, orange, and yellow bars of varying heights. White lines and a circular orange and white element are also present on the blue document surface. The icon is isolated on a white background. Income decrease graph vectors 3 D blue document icon with orange and blue bar graph and white lines image. A 3D rendered icon depicting a blue document with a raised bar graph. The bar graph features alternating blue, orange, and yellow bars of varying heights. White lines and a circular orange and white element are also present on the blue document surface. The icon is isolated on a white background
Free with trial Income decrease graph, financial crisis rate, revenue decline chart, economy downturn, investment risk, fund management, budget deficit, vector illustration, flat icon. Income decrease graph vectors Budget deficit, income decrease, economy decline, financial crisis, investment risk. Income decrease graph, financial crisis rate, revenue decline chart, economy downturn, investment risk, fund management, budget deficit, vector illustration, flat icon
Free with trial Income decrease graph, financial crisis rate, revenue decline chart, economy downturn, investment risk, fund management, budget deficit, vector illustration, flat icon. Income decrease graph vectors Budget deficit, income decrease, economy decline, financial crisis, investment risk. Income decrease graph, financial crisis rate, revenue decline chart, economy downturn, investment risk, fund management, budget deficit, vector illustration, flat icon
Free with trial Income decrease graph, financial crisis rate, revenue decline chart, economy downturn, investment risk, fund management, budget deficit, vector illustration, flat icon. Income decrease graph vectors Budget deficit, income decrease, economy decline, financial crisis, investment risk. Income decrease graph, financial crisis rate, revenue decline chart, economy downturn, investment risk, fund management, budget deficit, vector illustration, flat icon
Free with trial Financial arrows up and down. Financial growth and decline. Graph with green and red arrows. Finance diagram, graphic charts icon set. Income decrease graph vectors Financial arrows up and down. Financial growth and decline. Graph with green and red arrows. Finance diagram, graphic charts icon
Free with trial Broken piggy bank. Losing money. Decrease in income graph. Investment risks and financial instability. Stack of coins and dollars. Income decrease graph vectors Broken piggy bank. Losing money. Decrease in income graph. Investment risks and financial instability.
Free with trial Cash loss graph. Finance inflation schedule, money loss and decrease in income. Trader loss data, budget losses graph or investment bankruptcies isolated vector illustration. Income decrease graph vectors Cash loss graph. Finance inflation schedule, money loss and decrease in income vector illustration. Cash loss graph. Finance inflation schedule, money loss and decrease in income. Trader loss data, budget losses graph or investment bankruptcies isolated vector illustration
Free with trial Fall down chart. Finance crisis, business problem and economy drop. Down arrow graph, loss and decrease income. Profit declining vector set. Crisis economy, arrow down, problem decrease illustration. Income decrease graph vectors Fall down chart. Finance crisis, business problem and economy drop. Down arrow graph, loss and decrease income. Profit declining
Free with trial Frozen graph showing a downward trend. Cold economy concept, financial crisis, declining business, and cold market conditions. Income decrease graph illustrations Frozen graph showing a downward trend. Cold economy concept, financial crisis, declining business
Free with trial Decline stage concept set. Finance crisis with falling down graph and income decrease. Idea of bancruptcy and business risk. Money loss. Income decrease graph vectors Decline stage concept set. Finance crisis with falling down graph and income decrease. Idea of bancruptcy and business risk. Money
Free with trial Decline stage concept set. Finance crisis with falling down graph and income decrease. Idea of bancruptcy and business risk. Money loss. Income decrease graph vectors Decline stage concept set. Finance crisis with falling down graph and income decrease. Idea of bancruptcy and business risk. Money
Free with trial Decline stage concept set. Finance crisis with falling down graph and income decrease. Idea of bancruptcy and business risk, set flat vector modern illustration. Income decrease graph vectors Decline stage concept set. Finance crisis with falling down graph and income decrease. Idea of bancruptcy and business risk, set
Free with trial A clear glass jar labeled 'savings' tips over, spilling gold and silver coins onto a reflective surface, with a red downward trending graph in the background symbolizing financial loss or economic decline. Income decrease graph illustrations Glass jar labeled savings spilling coins with downward trending graph. A clear glass jar labeled 'savings' tips over, spilling gold and silver coins onto a reflective surface, with a red downward trending graph in the background symbolizing financial loss or economic decline
Free with trial Down payment, cash loan, credit approval, income growth, investment dividends, decrease and increase graph, refinance, cost calculating, interest rate, stock market, vector line icon set, thin stroke. Income decrease graph vectors Down payment, refinance loan, credit approval, investment dividends, decrease and increase graph, cost calculating, interest rate. Down payment, cash loan, credit approval, income growth, investment dividends, decrease and increase graph, refinance, cost calculating, interest rate, stock market, vector line icon set, thin stroke
Free with trial Down payment, cash loan, credit approval, income growth, investment dividends, decrease and increase graph, refinance, cost calculating, interest rate, stock market, vector line icon set, thin stroke. Income decrease graph vectors Down payment, refinance loan, credit approval, investment dividends, decrease and increase graph, cost calculating, interest rate. Down payment, cash loan, credit approval, income growth, investment dividends, decrease and increase graph, refinance, cost calculating, interest rate, stock market, vector line icon set, thin stroke
Free with trial Cash loss graph. Finance inflation schedule, money loss and decrease in income. Trader loss data, budget losses graph or investment bankruptcies isolated vector illustration. Income decrease graph vectors Money loss and decrease in income. Trader loss data, budget losses graph or
Free with trial A businessman is shown stacking coins on a wooden desk, with a prominent red downward arrow graph overlaying the image, symbolizing a financial crisis, economic recession, or market downturn. A calculator and scattered coins are also visible, emphasizing financial concepts. Income decrease graph illustrations Businessman stacking coins with a red downward arrow graph indicating financial crisis and economic recession. A businessman is shown stacking coins on a wooden desk, with a prominent red downward arrow graph overlaying the image, symbolizing a financial crisis, economic recession, or market downturn. A calculator and scattered coins are also visible, emphasizing financial concepts
Free with trial Business profit loss, financial crisis, profit decrease, economic or market fall, marketing income down arrow stock graph concept vector flat illustration template. Income decrease graph illustrations Business profit loss, financial crisis, profit decrease, economic or market fall, marketing income down arrow stock graph concept
Free with trial A hand uses a stylus to draw a glowing bar graph. The graph illustrates increasing income and decreasing expenses, symbolizing financial management and growth. Income decrease graph illustrations Hand drawing a financial graph showing income growth and expense decrease. A hand uses a stylus to draw a glowing bar graph. The graph illustrates increasing income and decreasing expenses, symbolizing financial management and growth
Free with trial Cash loss graph. Finance inflation schedule, money loss and decrease in income. Trader loss data, budget losses graph or investment bankruptcies isolated vector illustration. Income decrease graph vectors Cash loss graph. Finance inflation schedule, money loss and decrease in income. Trader loss data, budget losses graph or
Free with trial Graph going down and up sign with green and red arrows vector. Bar chart symbol icon with arrow moving down and sales bar chart with arrow moving up. Income decrease graph vectors Graph going down and up sign with green and red arrows vector. Bar chart symbol icon with arrow moving down and sales bar chart
Free with trial An illustration set of Coin stacks with down-arrow Graph as a symbol for the decrease in its Value Exchange. Income decrease graph vectors Coin Graph Down Value Exchange Decrease. An illustration set of Coin stacks with down-arrow Graph as a symbol for the decrease in its Value Exchange.
Free with trial Income fall. Business recession and financial losses vector illustration, arrow down money budget low, stocks reduction and expenses costs concept, profitability crisis graph downward. Income decrease graph vectors Income fall graph downward. Income fall. Business recession and financial losses vector illustration, arrow down money budget low, stocks reduction and expenses costs concept, profitability crisis graph downward
Free with trial Economic decrease graph gold coins illustration. Income decrease graph vectors Economic decrease graph gold coins
Free with trial Illustration of global stock market data. The graphic includes a world map background bar charts and a line graph. Represents finance investment and trading, trends across international. Income decrease graph illustrations Illustration of global stock market data. The graphic includes a world map background bar charts and a line graph. Represents
Free with trial Graph of money loss. Low cost dollars. Crisis of economy with decrease sales and revenue. Icon of reduction of market and economic down. Financial bankruptcy. Infographic of inflation. Vector. Income decrease graph vectors Graph of money loss. Low cost dollars. Crisis of economy with decrease sales and revenue. Icon of reduction of market and economic
Free with trial Cost low and loss. Decrease revenue. Crisis of economy. Icon of money inflation. Graph of financial investment with arrow down. Reduction of business. Bankruptcy of company or lack of budget. Vector. Income decrease graph vectors Cost low and loss. Decrease revenue. Crisis of economy. Icon of money inflation. Graph of financial investment with arrow down.