Free with trial A visual representation of economic downturn and falling interest rates, with stacks of coins decreasing in height and a downward trending arrow indicating a decline in financial value and market performance. Income decrease graph illustrations Decreasing interest rates and economic recession represented by stacked coins and a downward arrow with percentage symbols. A visual representation of economic downturn and falling interest rates, with stacks of coins decreasing in height and a downward trending arrow indicating a decline in financial value and market performance
Free with trial Cost reduction icon vector logo set collection or bundle pack group. Income decrease graph vectors Cost reduction icon Isolated flat vector in outline. Cost reduction icon vector logo set collection or bundle pack group
Free with trial This conceptual studio photograph shows coins stacked in an increasing bar chart format with upward and downward arrows, ideal for illustrating financial reports, banking services, and investment risks. Income decrease graph illustrations Silver coin stacks with green and red arrows showing market volatility studio photo. This conceptual studio photograph shows coins stacked in an increasing bar chart format with upward and downward arrows, ideal for illustrating financial reports, banking services, and investment risks
Free with trial Businessman looking at a stock market chart showing financial crisis and falling profits. Income decrease graph illustrations Businessman thinking about business decline and financial loss. Businessman looking at a stock market chart showing financial crisis and falling profits
Free with trial Percent down and up icon on black circle. Percentage downward and upward arrow sign. Decline and growth symbol vector. Income decrease graph vectors Percent down and up icon on black circle. Percentage downward and upward arrow sign. Decline and growth symbol
Free with trial Red world map overlay on wet surface with vertical bar charts. Global finance data analysis. Economic recession risk market crash. Stock market decline information visualization. Income decrease graph illustrations Red world map overlay on wet surface with vertical bar charts. Global finance data analysis. Economic recession risk, market. Red world map overlay on wet surface with vertical bar charts. Global finance data analysis. Economic recession risk market crash. Stock market decline information visualization.
Free with trial Arrow down and up percent outline icon on black circle. Percentage downward and upward arrows sign symbol vector. Income decrease graph vectors Arrow down and up percent outline icon on black circle. Percentage downward and upward arrows sign symbol
Free with trial A clean, minimalist vector illustration of a bar chart featuring three distinct columns. The columns are colored in vibrant orange, teal, and yellow, representing different data points or categories. The chart is set against a white background with a dark blue axis line, making it ideal for presentations, reports, and infographics focused on data visualization, business growth, or financial analysis. Income decrease graph vectors Simple Bar Chart with Three Columns. A clean, minimalist vector illustration of a bar chart featuring three distinct columns. The columns are colored in vibrant orange, teal, and yellow, representing different data points or categories. The chart is set against a white background with a dark blue axis line, making it ideal for presentations, reports, and infographics focused on data visualization, business growth, or financial analysis.
Free with trial Bar Chart with growth green arrow and Bar Chart with falling red arrow, 3D rendering isolated on white background. Income decrease graph illustrations Bar Chart with growth green arrow and Bar Chart with falling red arrow, 3D rendering
Free with trial Percent up and down icon on circle line. Percentage upward and downward sign. Growth and decline symbol vector. Income decrease graph vectors Percent up and down icon on circle line. Percentage upward and downward sign. Growth and decline symbol
Free with trial Bar Chart with growth red arrow and crash in the end, 3D rendering isolated on white background. Income decrease graph illustrations Bar Chart with growth red arrow and crash in the end, 3D rendering
Free with trial A hand-drawn illustration featuring a large percentage symbol at the center, surrounded by various financial and business-related doodles. Icons include bar charts, pie charts, stacks of coins, a calculator, dollar signs, and numerous arrows indicating direction, flow, or change. The style is simple, black and white line art, suitable for representing concepts like finance, economics, growth, discounts, and business analysis. Income decrease graph illustrations Doodle Financial Icons and Percentage Symbol. A hand-drawn illustration featuring a large percentage symbol at the center, surrounded by various financial and business-related doodles. Icons include bar charts, pie charts, stacks of coins, a calculator, dollar signs, and numerous arrows indicating direction, flow, or change. The style is simple, black and white line art, suitable for representing concepts like finance, economics, growth, discounts, and business analysis.
Free with trial A comprehensive set of line icons illustrating investment attraction and market notifications. Icons feature money magnets, growth sprouts, piggy banks with brain symbols, and various notification bells for price alerts. Ideal for stock trading applications, investment advice blogs, and financial education materials that focus on wealth accumulation, strategy building, and staying. Income decrease graph vectors Financial Attraction and Market Alert Icon Set. A comprehensive set of line icons illustrating investment attraction and market notifications. Icons feature money magnets, growth sprouts, piggy banks with brain symbols, and various notification bells for price alerts. Ideal for stock trading applications, investment advice blogs, and financial education materials that focus on wealth accumulation, strategy building, and staying
Free with trial Housing Market and Policy Trends: House with Person Inside and Graphs Going Up and Down with an Arrow Thin Line Icon, Vector Illustration for Real Estate and Socioeconomic Analysis Graphic. Income decrease graph vectors Housing Market and Policy Trends: House with Person Inside and Graphs Going Up and Down with an Arrow Thin Line Icon, Vector
Free with trial Illustration of a growing budget efficiency with a simple money bag closing tightly, a stylized downward-pointing cost arrow, and a stream of saved coins. Vector flat icon design on a white background for a cost control illustration --chaos 30 --ar 16:9 --v 7 Job ID: 35adf769-e45b-43cf-a8e7-0b2af69479b3. Income decrease graph illustrations Money Bag Downward Arrow, Financial Crisis, Economic Downturn, Falling Value. Illustration of a growing budget efficiency with a simple money bag closing tightly, a stylized downward-pointing cost arrow, and a stream of saved coins. Vector flat icon design on a white background for a cost control illustration --chaos 30 --ar 16:9 --v 7 Job ID: 35adf769-e45b-43cf-a8e7-0b2af69479b3
Free with trial Hand drawing a yellow downward trend chart on a black chalkboard depicting financial decline economic downturn or business losses. Illustrating concept of falling sales and decreasing profits. Income decrease graph illustrations Hand Drawn Yellow Downward Trend Chart on Black Chalkboard Depicting Financial Decline. Hand drawing a yellow downward trend chart on a black chalkboard depicting financial decline economic downturn or business losses. Illustrating concept of falling sales and decreasing profits
Free with trial Simple set of isometric line icons for finance 3. Contains such symbols as Objective, Decision, Time is Money and Decrease. Income decrease graph vectors Simple set of isometric line icons for finance 3
Free with trial Financial decline downward arrow trend business target. Income decrease graph vectors RED Financial decline downward arrow trend business icon. Financial decline downward arrow trend business target
Free with trial US Dollar Exchange Chart Illustration Falling. Income decrease graph illustrations US Dollar Exchange Chart Illustration Falling
Free with trial A stark red downward arrow dominates this compelling graphic, set against a pristine white background. This impactful 3D render visualizes a decreasing trend, effectively representing economic downturns and financial losses. The image's concise nature makes it ideal for illustrating negative market performance, business losses, or budget reduction. Use this conceptual illustration to depict. Income decrease graph illustrations Declining trend represented by a red arrow on a white background depicting economic downturn or financial losses. A stark red downward arrow dominates this compelling graphic, set against a pristine white background. This impactful 3D render visualizes a decreasing trend, effectively representing economic downturns and financial losses. The image's concise nature makes it ideal for illustrating negative market performance, business losses, or budget reduction. Use this conceptual illustration to depict
Free with trial A series of six stacks of shiny gold coins are arranged in a descending staircase formation against a white background. The stacks vary in height, with the tallest on the left and the shortest on the right, creating a visual representation of a downward trend or decrease. Each coin appears to be identical, featuring a laurel wreath design and a numeral. Income decrease graph illustrations Staircase of Gold Coins Decreasing in Height on a White Background money finance. A series of six stacks of shiny gold coins are arranged in a descending staircase formation against a white background. The stacks vary in height, with the tallest on the left and the shortest on the right, creating a visual representation of a downward trend or decrease. Each coin appears to be identical, featuring a laurel wreath design and a numeral
Free with trial Currency Devaluation Concept with Stock Market Chart and Green Note. Income decrease graph illustrations Currency Devaluation Concept with Stock Market Chart and Green Note
Free with trial Piggy bank, stethoscope, financial charts, healthcare costs, saving money, artistic wallpaper background Generative AI. Income decrease graph illustrations Piggy bank, stethoscope, financial charts, healthcare costs, saving money
Free with trial This illustration, generated by AI, depicts a modern workspace with a computer displaying financial charts and graphs, surrounded by icons representing money, calculations, and productivity. It symbolizes financial analysis and data-driven decision-making. Income decrease graph illustrations AI-Generated Financial Data Visualization. This illustration, generated by AI, depicts a modern workspace with a computer displaying financial charts and graphs, surrounded by icons representing money, calculations, and productivity. It symbolizes financial analysis and data-driven decision-making.
Free with trial A series of five stacks of gold coins are arranged in a declining sequence from left to right, symbolizing a financial downturn or loss. The coins are shiny and appear to be of uniform size and design. The arrangement creates a visual representation of a downward trend, suitable for concepts related to finance, economy, or investment. The image is set against a clean white background. Income decrease graph illustrations Declining Stack of Gold Coins Representing Financial Loss or Downturn image photo. A series of five stacks of gold coins are arranged in a declining sequence from left to right, symbolizing a financial downturn or loss. The coins are shiny and appear to be of uniform size and design. The arrangement creates a visual representation of a downward trend, suitable for concepts related to finance, economy, or investment. The image is set against a clean white background
Free with trial Financial arrows up icon vector on white background. Income decrease graph vectors Financial arrows up icon vector
Free with trial Japanese Yen Exchange Chart Illustration Falling. Income decrease graph illustrations Japanese Yen Exchange Chart Illustration Falling
Free with trial Tax on wooden cube from stack block with percent and rise arrow, Real estate property investment concept. Asset management, Interest rates, inflation, loan mortgage, increase tax. 3d render. Income decrease graph illustrations Tax on wooden cube from stack block with percent and rise arrow
Free with trial Financial growth and decline icon set with stacked coins and arrows design. Income decrease graph illustrations Financial growth and decline icon set with stacked coins and arrows
Free with trial Reduction chart icon Vector symbol or sign set collection in black and white outline. Income decrease graph vectors Reduction chart icon flat line symbol set. Reduction chart icon Vector symbol or sign set collection in black and white outline
Free with trial US Dollar Exchange Rate Chart Illustration Forecast. Income decrease graph illustrations US Dollar Exchange Rate Chart Illustration Forecast
Free with trial Decreasing coin stacks on wood with green bokeh background, for finance concepts. Income decrease graph illustrations Progression of Financial Growth with Stacked Coins. Decreasing coin stacks on wood with green bokeh background, for finance concepts
Free with trial Percent up and down icon on black circle. Percentage upward and downward sign. Growth and decline symbol vector. Income decrease graph vectors Percent up and down icon on black circle. Percentage upward and downward sign. Growth and decline symbol
Free with trial Percent up and down icon on black circle. Percentage upward and downward sign. Growth and decline symbol vector. Income decrease graph vectors Percent up and down icon on black circle. Percentage upward and downward sign. Growth and decline symbol
Free with trial This illustration represents retail economics, featuring a shopping cart, price tag, head with dollar sign, and coin with arrow, symbolizing financial concepts. Income decrease graph vectors Vector art of illustration showcasing retail economics with shopping cart, price tag, head with dollar sign, and coin with upward. This illustration represents retail economics, featuring a shopping cart, price tag, head with dollar sign, and coin with arrow, symbolizing financial concepts
Free with trial Dollar arrow up and down outline icon isolated on white background. USD growth and decline sign symbol vector. Income decrease graph vectors Dollar arrow up and down outline icon isolated on white background. USD growth and decline sign symbol
Free with trial 3d render icon Declining euro coins with descending red arrow symbolizing economic downturn, transparent financial graphic highlighting monetary instability. Income decrease graph vectors 3d render icon Stacks of declining euro coins and descending red arrow representing financial crisis, with transparent background. 3d render icon Declining euro coins with descending red arrow symbolizing economic downturn, transparent financial graphic highlighting monetary instability
Free with trial Dollar arrow down and up outline icon. USD currency arrows decline and growth sign symbol vector. Income decrease graph vectors Dollar arrow down and up outline icon. USD currency arrows decline and growth sign symbol
Free with trial 3d render icon Declining euro coins with descending red arrow symbolizing economic downturn, transparent financial graphic highlighting monetary instability. Income decrease graph vectors 3d representing icon coins of declining euro render and descending Stacks arrow red financial crisis, with transparent background. 3d render icon Declining euro coins with descending red arrow symbolizing economic downturn, transparent financial graphic highlighting monetary instability
Free with trial A colorful collection of flat-design icons representing various aspects of budgeting, finance, and personal accounting. Income decrease graph illustrations A colorful collection of flat-design icons representing various
Free with trial 3d render icon Declining euro coins with descending red arrow symbolizing economic downturn, transparent financial graphic highlighting monetary instability. Income decrease graph vectors 3d render icon Stacks of declining euro coins and descending red arrow representing financial crisis, with transparent background. 3d render icon Declining euro coins with descending red arrow symbolizing economic downturn, transparent financial graphic highlighting monetary instability
Free with trial 3d render icon Declining euro coins with descending red arrow symbolizing economic downturn, transparent financial graphic highlighting monetary instability. Income decrease graph vectors 3d render icon Stacks of declining euro coins and descending red arrow representing financial crisis, with transparent background. 3d render icon Declining euro coins with descending red arrow symbolizing economic downturn, transparent financial graphic highlighting monetary instability
Free with trial Japanese Yen Exchange Rate Chart Illustration Forecast. Income decrease graph illustrations Japanese Yen Exchange Rate Chart Illustration Forecast
Free with trial Colorful infographic d "BundenigS" illustrating financial concepts like savings, budgeting, investments, and financial statements, using simple icons. Income decrease graph illustrations Colorful infographic d \'BundenigS\' illustrating financial concep. Colorful infographic d "BundenigS" illustrating financial concepts like savings, budgeting, investments, and financial statements, using simple icons .
Free with trial House icon on wooden cube from stack block with percent and rise arrow, Real estate property investment concept. Asset management, Interest rates, inflation, loan mortgage, increase tax. 3d render. Income decrease graph illustrations House icon on wooden cube from stack block with percent and rise arrow
Free with trial A detailed financial analysis scene featuring a whiteboard calculator, a magnifying glass hovering over pie charts, and gold coins scattered on documents with bar graphs. This overhead shot on a wooden desk conveys concepts of auditing, investment, and financial planning. This image was generated with the assistance of artificial intelligence. Income decrease graph illustrations Financial Analysis Calculator, Magnifying Glass, Charts, and Coins on Desk. A detailed financial analysis scene featuring a whiteboard calculator, a magnifying glass hovering over pie charts, and gold coins scattered on documents with bar graphs. This overhead shot on a wooden desk conveys concepts of auditing, investment, and financial planning.This image was generated with the assistance of artificial intelligence.
Free with trial Glossy polished 3D red segmented downward arrow, ideal for illustrating market decline, economic downturn, financial loss, stock market crashes, business recession, and corporate financial downturn concepts for financial reports, marketing assets and business content , stunning visual effect. Income decrease graph vectors Red Arrow Shows Decline with Statistics Concept and Economic Downturn. Glossy polished 3D red segmented downward arrow, ideal for illustrating market decline, economic downturn, financial loss, stock market crashes, business recession, and corporate financial downturn concepts for financial reports, marketing assets and business content , stunning visual effect
Free with trial Golden dollar symbol with red arrow pointing down. This visualizes economic downturn. Concept of financial crisis. Stock market decline. Bear market depiction. Losses. Business problem. Income decrease graph illustrations Golden dollar symbol with red arrow pointing down. This visualizes economic downturn. Concept of financial crisis. Stock market
Free with trial A visually appealing design that blends creativity with professionalism. The composition offers a sense of balance, warmth, and clarity, making it adaptable for different contexts and purposes. Income decrease graph vectors Business icon pattern with graphs, money bags, people, bulbs, clocks on white. A visually appealing design that blends creativity with professionalism. The composition offers a sense of balance, warmth, and clarity, making it adaptable for different contexts and purposes.
Free with trial Bitcoin with red arrow down and bitcoin with green growth arrow. Falling and growing price of cryptocurrency, concept. 3D rendering isolated on white background. Income decrease graph illustrations Bitcoin with red arrow down and bitcoin with green growth arrow. Falling and growing price of cryptocurrency, concept. 3D
Free with trial A businessman interacting with a digital interface showing financial growth, time management, and investment strategies. It represents wealth management and business success. Time is money, invest wisely. Income decrease graph illustrations Business investment strategy time is money financial growth and wealth management concept illustration. a businessman interacting with a digital interface showing financial growth, time management, and investment strategies. It represents wealth management and business success. Time is money, invest wisely.
Free with trial Percent growth and decline icon. Percentage arrow up and down sign symbol vector. Income decrease graph vectors Percent growth and decline icon. Percentage arrow up and down sign symbol
Free with trial Financial data analysis bar chart icon with upward trend showing business growth. Income decrease graph vectors Financial data analysis bar chart icon with upward trend showing business growth
Free with trial Percent arrow down and up icon. Percentage decline and growth sign symbol vector. Income decrease graph vectors Percent arrow down and up icon. Percentage decline and growth sign symbol
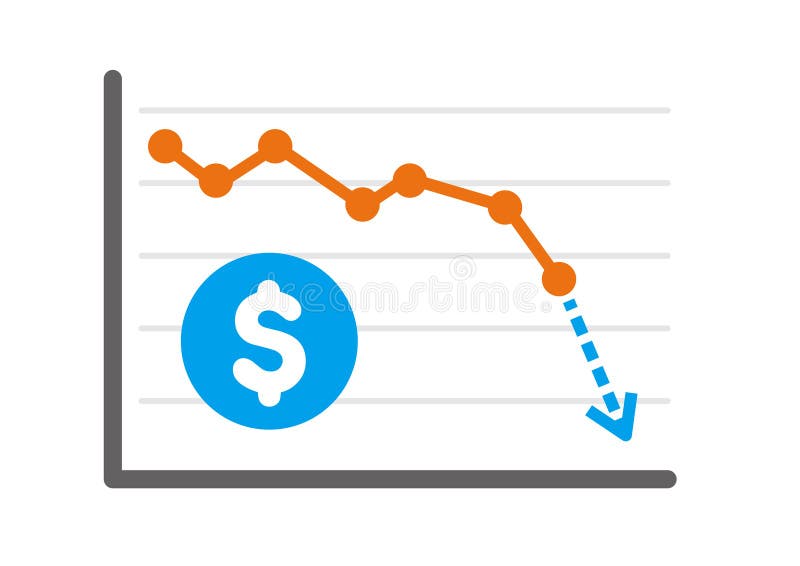
Free with trial A stylized document showing dollar symbols and a downward arrow, conveying financial loss or decline. Graphic style with a flat design and simple composition. Income decrease graph vectors Financial Report with Dollar Symbols and Downward Arrows Indicating Loss. A stylized document showing dollar symbols and a downward arrow, conveying financial. A stylized document showing dollar symbols and a downward arrow, conveying financial loss or decline. Graphic style with a flat design and simple composition.
Free with trial Stacks of golden coins arranged in a descending order on a light background, illustrating concepts of financial loss, economic downturn, and decreasing value. Income decrease graph illustrations Decreasing stacks of golden coins symbolizing financial decline and economic loss. Stacks of golden coins arranged in a descending order on a light background, illustrating concepts of financial loss, economic downturn, and decreasing value
Free with trial Economic Loss icon logo sign vector outline in black and white color. Income decrease graph vectors Economic Loss logo sign vector outline. Economic Loss icon logo sign vector outline in black and white color
Free with trial Lower cost icon Vector symbol or sign set collection in black and white outline. Income decrease graph vectors Lower cost icon mark in filled style. Lower cost icon Vector symbol or sign set collection in black and white outline
Free with trial Percent growth and decline outline icon. Percentage arrow up and down sign symbol vector. Income decrease graph vectors Percent growth and decline outline icon. Percentage arrow up and down sign symbol
Free with trial Dollar arrow up and down icon isolated on white background. USD growth and decline sign symbol vector. Income decrease graph vectors Dollar arrow up and down icon isolated on white background. USD growth and decline sign symbol
Free with trial This vector illustration shows icons representing financial growth and decline concepts such as profits, losses, success, and failure using coins, arrows, and people with clear black shapes. The style is simple and effective, conveying economic mood. Generative AI. Income decrease graph vectors Financial growth decline icons economic success failure money coins profits losses vector illustration. This vector illustration shows icons representing financial growth and decline concepts such as profits, losses, success, and failure using coins, arrows, and people with clear black shapes. The style is simple and effective, conveying economic mood. Generative AI
Free with trial Gold coins stack with red arrow zigzag down representing economic recession and market crash. Generative AI. Income decrease graph illustrations Gold coins stack with red arrow zigzag down representing economic recession and market crash
Free with trial Current market price and expected market price to calculate desired profit and target cost vector. Income decrease graph vectors Current market price and expected market price to calculate desired profit and target cost
Free with trial Percent growth and decline arrow icon on black circle. Percentage up and down arrows vector concept. Income decrease graph vectors Percent growth and decline arrow icon on black circle. Percentage up and down arrows concept
Free with trial Stack of coins with upward arrow, symbolizing growth, savings, investment, and financial success ,Generative ai. Income decrease graph illustrations Ascending arrow on coin stack, visualizing financial growth, investment, savings, and wealth building. Stack of coins with upward arrow, symbolizing growth, savings, investment, and financial success ,Generative ai
Free with trial Financial planner analyzing declining savings performance using tablet with downward chart and piggy bank. Concept of financial risk, savings loss, economic downturn, personal finance challenge. Income decrease graph illustrations Financial planner analyzing declining savings performance using tablet with downward chart and piggy bank. Concept of financial
Free with trial Economic Loss icon outline collection or set in black and white. Income decrease graph vectors Economic Loss icon outline collection in black. Economic Loss icon outline collection or set in black and white
Free with trial Three coin stacks with dollar signs, showing growth, and a downward arrow indicating potential decline. Income decrease graph vectors A line drawing depicting three stacks of coins with dollar signs on top, showing financial growth. three coin stacks with dollar signs, showing growth, and a downward arrow indicating potential decline
Free with trial Ascending green chart indicates positive financial growth in stock market investment ,Generative ai. Income decrease graph illustrations Ascending green stock chart symbolizes positive financial growth and investment success in market. Ascending green chart indicates positive financial growth in stock market investment ,Generative ai
Free with trial Minimalist 3D of pastel geometric shapes symbolizing financial growth, investment, profit, success, and progress. Great for illustrating your unique designs or attracting customer attention. Clear area for showcasing your products, copy space, banner, marketing. This AI image graphic representation. Generative AI. Income decrease graph illustrations Pastel Geometric Financial Growth Minimalist Marketing Minimalist 3D of pastel geometric shapes symbolizing financial growth. Minimalist 3D of pastel geometric shapes symbolizing financial growth, investment, profit, success, and progress. Great for illustrating your unique designs or attracting customer attention. Clear area for showcasing your products, copy space, banner, marketing. This AI image graphic representation. Generative AI
Free with trial Economic Loss icon vector logo set collection for web app ui. Income decrease graph vectors Economic Loss icon vector set collection for web. Economic Loss icon vector logo set collection for web app ui
Free with trial Percent up and down icon isolated on white background. Percentage arrow growth and decline sign symbol vector. Income decrease graph vectors Percent up and down icon isolated on white background. Percentage arrow growth and decline sign symbol
Free with trial Stacks of coins with green up arrow and red down arrow representing stock market fluctuation and investment risk. Generative AI. Income decrease graph illustrations Stacks of coins with green up arrow and red down arrow representing stock market fluctuation and investment risk
Free with trial Close-up view of computer screen with colorful graphs, charts, representing financial, economic data visualization. Stock market analysis, business statistics investment data displayed. Income decrease graph illustrations Close-up view of computer screen with colorful graphs, charts, representing financial, economic data visualization. Stock market
Free with trial Investment analyst analyzing stock market crash ,financial warning signals with bearish chart ,digital alert interface ,economic downturn, volatile market conditions, urgent investment risk assessment. Income decrease graph illustrations Investment analyst analyzing stock market crash ,financial warning signals with bearish chart ,digital alert interface ,economic
Free with trial Economic Loss icon Black line art vector in black and white outline set collection sign. Income decrease graph vectors Economic Loss icon Black line art vector
Free with trial Abstract vector showing price decreasing and investment increasing, using blue lines and pink accents. Simple composition, balanced for illustrative purposes. Income decrease graph vectors Abstract visual illustrating price reduction, investment, and financial dynamics on a black background. Abstract vector showing price decreasing and investment increasing, using blue lines and pink accents. Simple composition, balanced for illustrative purposes.