Free with trial Fluctuations red graph illustration business meeting, computer analysis, trends presentation fluctuations red graph. Increase decrease graph illustrations Fluctuations red graph
Free with trial Web report line icon. Neumorphic, Red gradient, 3d pin buttons. Column graph sign. Growth diagram symbol. Line icons. Neumorphic buttons with outline signs. Vector. Increase decrease graph illustrations Web report line icon. Column graph sign. Line icons. Vector. Web report line icon. Neumorphic, Red gradient, 3d pin buttons. Column graph sign. Growth diagram symbol. Line icons. Neumorphic buttons with outline signs. Vector
Free with trial A red pen with a silver tip is resting on a piece of paper with a graph. Increase decrease graph illustrations A red pen sitting on top of a paper with a graph on it. A red pen with a silver tip is resting on a piece of paper with a graph
Free with trial Set Mind map infographic, Pie chart, Cloud download and upload and Financial growth decrease icon. Vector. Increase decrease graph vectors Set Mind map infographic, Pie chart, Cloud download and upload and Financial growth decrease icon. Vector
Free with trial Set Network cloud connection, Financial growth decrease, and Browser with exclamation mark icon. Vector. Increase decrease graph vectors Set Network cloud connection, Financial growth decrease, and Browser with exclamation mark icon. Vector
Free with trial Graph chart going up and down sign arrows flat design vector illustration on white background. Increase decrease graph vectors Graph chart going up and down sign arrows flat design vector illustration
Free with trial Axis lighting up line graph illustration plot point, grid series, marker label axis lighting up line graph. Increase decrease graph illustrations Axis lighting up line graph
Free with trial Trends blinking sales graph illustration data visualization, performance revenue, metrics dashboard trends blinking sales graph. Increase decrease graph illustrations Trends blinking sales graph
Free with trial Graph chart infographic report set with statistic arrow data elements for financial market analysis and planning in business performance research for your illustration. Increase decrease graph vectors Graph chart infographic report set
Free with trial Graph chart infographic report set with statistic arrow data elements for financial market analysis and planning in business performance research for your illustration. Increase decrease graph vectors Graph chart infographic report set
Free with trial Graph chart infographic report set with statistic arrow data elements for financial market analysis and planning in business performance research for your illustration. Increase decrease graph vectors Graph chart infographic report set
Free with trial Colorful Financial growth decrease icon isolated on white background. Increasing revenue. Minimalism concept. 3D render illustration. Increase decrease graph illustrations Colorful Financial growth decrease icon isolated on white background. Increasing revenue. Minimalism concept. 3D render
Free with trial Set Mind map infographic Pie chart Server Folder and lock Sales funnel with Financial growth decrease Data analysis and icon. Vector. Increase decrease graph vectors Set Mind map infographic, Pie chart, Server, Folder and lock, Sales funnel with, Financial growth decrease, Data. Set Mind map infographic Pie chart Server Folder and lock Sales funnel with Financial growth decrease Data analysis and icon. Vector.
Free with trial Stock market graph with blue and orange lines showing fluctuations, on futuristic dark background grid Generative AI. Increase decrease graph illustrations Stock market graph with blue and orange lines showing fluctuations, on futuristic dark background grid
Free with trial Stock market graph with blue and orange lines showing fluctuations, on futuristic dark background grid Generative AI. Increase decrease graph illustrations Stock market graph with blue and orange lines showing fluctuations, on futuristic dark background grid
Free with trial Line Financial growth decrease icon isolated seamless pattern on black background. Increasing revenue. Vector. Increase decrease graph vectors Line Financial growth decrease icon isolated seamless pattern on black background. Increasing revenue. Vector
Free with trial Data merging loss graph illustration analysis metrics, performance validation, accuracy convergence data merging loss graph. Increase decrease graph illustrations Data merging loss graph
Free with trial Set line Delivery tracking, Financial growth decrease, Layers and Infographic element. White square button. Vector. Increase decrease graph vectors Set line Delivery tracking, Financial growth decrease, Layers and Infographic element. White square button. Vector
Free with trial Data merging sales graph illustration analysis trends, revenue performance, forecast comparison data merging sales graph. Increase decrease graph illustrations Data merging sales graph
Free with trial Graph melting line chart illustration temperature plot, axis series, point slope graph melting line chart. Increase decrease graph illustrations Graph melting line chart
Free with trial Grey Financial growth decrease icon isolated on beige background. Increasing revenue. Abstract circle random dots. Vector. Increase decrease graph vectors Grey Financial growth decrease icon isolated on beige background. Increasing revenue. Abstract circle random dots
Free with trial Data loading sales graph illustration analytics visualization, performance trends, metrics dashboard data loading sales graph. Increase decrease graph illustrations Data loading sales graph
Free with trial Set Binary code Pie chart infographic Data analysis Coal mine trolley Financial growth decrease and Browser with stocks market icon. Vector. Increase decrease graph illustrations Set Binary code, Pie chart infographic, Data analysis, Coal mine trolley, Financial growth decrease, and Browser with. Set Binary code Pie chart infographic Data analysis Coal mine trolley Financial growth decrease and Browser with stocks market icon. Vector.
Free with trial A business professional displays a digital graph of business growth trends. The graph showcases upward and downward fluctuations, representing the dynamic and complex nature of market analysis. The image is a visual representation of business growth and analysis using technology. The professional is likely studying data to make informed decisions for optimal performance and future growth. Increase decrease graph illustrations Business Growth Trend Analysis with Digital Graph. A business professional displays a digital graph of business growth trends. The graph showcases upward and downward fluctuations, representing the dynamic and complex nature of market analysis. The image is a visual representation of business growth and analysis using technology. The professional is likely studying data to make informed decisions for optimal performance and future growth
Free with trial Set line Hierarchy organogram chart, Dollar symbol, Financial growth decrease and Arrow. White square button. Vector. Increase decrease graph vectors Set line Hierarchy organogram chart, Dollar symbol, Financial growth decrease and Arrow. White square button. Vector
Free with trial Set line Server Website with stocks market Infographic of city map Laptop browser window Financial growth decrease Browser shield Photo retouching and Secure your HTTPS SSL icon. Vector. Increase decrease graph illustrations Set line Server, Website with stocks market, Infographic of city map, Laptop browser window, Financial growth decrease. Set line Server Website with stocks market Infographic of city map Laptop browser window Financial growth decrease Browser shield Photo retouching and Secure your HTTPS SSL icon. Vector.
Free with trial Colorful Financial growth decrease icon isolated on white background. Increasing revenue. Circle button. 3D render illustration. Increase decrease graph illustrations Colorful Financial growth decrease icon isolated on white background. Increasing revenue. Circle button. 3D render
Free with trial Colorful Financial growth decrease icon isolated on white background. Increasing revenue. Circle button. 3D render illustration. Increase decrease graph illustrations Colorful Financial growth decrease icon isolated on white background. Increasing revenue. Circle button. 3D render
Free with trial Glowing neon line Financial growth decrease icon isolated on black background. Increasing revenue. Vector. Increase decrease graph vectors Glowing neon line Financial growth decrease icon isolated on black background. Increasing revenue. Vector
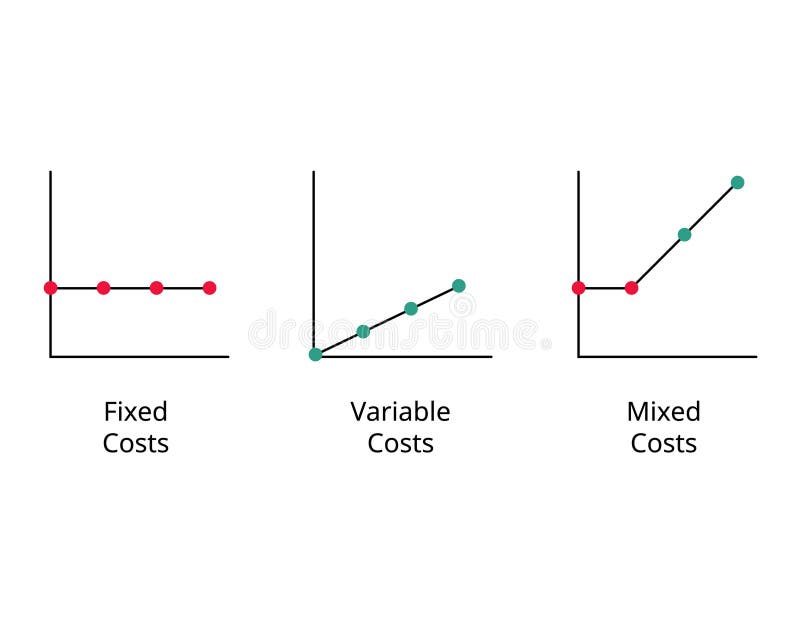
Free with trial Graph of Fixed cost, variable costs, mixed cost to compare vector. Increase decrease graph vectors Graph of Fixed cost, variable costs, mixed cost to compare
Free with trial Revenue absorbing sales graph illustration growth metrics, visualization insights, forecast dashboard revenue absorbing sales graph. Increase decrease graph illustrations Revenue absorbing sales graph
Free with trial Efficiency of cost optimization strategy, effective business plan of price decrease, investment. Tiny people control needle of speedometer dial to make minimum cost cartoon vector illustration. Increase decrease graph vectors Efficiency of cost optimization strategy, effective plan of price decrease of tiny people. Efficiency of cost optimization strategy, effective business plan of price decrease, investment. Tiny people control needle of speedometer dial to make minimum cost cartoon vector illustration
Free with trial A tablet displays a colorful bar graph, showcasing data trends. The image emphasizes visual data analysis and modern business tools. The warm wood background adds a professional yet inviting feel. Increase decrease graph illustrations Tablet Showing Business Graph. A tablet displays a colorful bar graph, showcasing data trends. The image emphasizes visual data analysis and modern business tools. The warm wood background adds a professional yet inviting feel.
Free with trial Analytics morphing sales graph illustration growth metrics, dashboard insights, revenue forecast analytics morphing sales graph. Increase decrease graph illustrations Analytics morphing sales graph
Free with trial A hand holds a piece of paper with a simple line graph, possibly representing data or a trend, generated by AI. The minimalist design emphasizes the visual simplicity and the concept of data representation. The image could be used to illustrate various concepts related to progress, decline, or chan. Increase decrease graph illustrations Hand Holding Simple Line Graph. A hand holds a piece of paper with a simple line graph, possibly representing data or a trend, generated by AI. The minimalist design emphasizes the visual simplicity and the concept of data representation. The image could be used to illustrate various concepts related to progress, decline, or chan
Free with trial Colorful Financial growth decrease icon isolated on white background. Increasing revenue. Minimalism concept. 3D render illustration. Increase decrease graph illustrations Colorful Financial growth decrease icon isolated on white background. Increasing revenue. Minimalism concept. 3D render
Free with trial Colorful Financial growth decrease icon isolated on white background. Increasing revenue. Minimalism concept. 3D render illustration. Increase decrease graph illustrations Colorful Financial growth decrease icon isolated on white background. Increasing revenue. Minimalism concept. 3D render
Free with trial Vector illustration of 2D (two dimensional) x and y cartesian axes with a graph of a parabola. Increase decrease graph vectors Cartesian axis 2D graph parabola. Vector illustration of 2D (two dimensional) x and y cartesian axes with a graph of a parabola
Free with trial Analysis replicating sales graph illustration trends visualization, performance growth, revenue forecasting analysis replicating sales graph. Increase decrease graph illustrations Analysis replicating sales graph
Free with trial This image shows a simple isometric bar graph, generated by AI. It features four black bars of varying heights against a white background, suitable for use as a minimalist graphic or logo. The clean design allows for versatile application in various contexts. Increase decrease graph illustrations AI-Generated Isometric Bar Graph. This image shows a simple isometric bar graph, generated by AI. It features four black bars of varying heights against a white background, suitable for use as a minimalist graphic or logo. The clean design allows for versatile application in various contexts.
Free with trial A close-up shot of wooden blocks arranged to form a small graph, illustrating an interest rate. The blocks are textured and have percentage symbols and directional arrows carved into them. The image has a dark, moody feel and evokes concepts of finance, economics, and growth or decline. Increase decrease graph illustrations Wooden blocks interest rate graph. A close-up shot of wooden blocks arranged to form a small graph, illustrating an interest rate. The blocks are textured and have percentage symbols and directional arrows carved into them. The image has a dark, moody feel and evokes concepts of finance, economics, and growth or decline
Free with trial Opportunity cost between product 1 and product 2 in different quantity graph vector. Increase decrease graph vectors Opportunity cost between product 1 and product 2 in different quantity graph
Free with trial Visualization blinking sales graph illustration performance revenue, metrics dashboard, insights forecast visualization blinking sales graph. Increase decrease graph illustrations Visualization blinking sales graph
Free with trial Dynamic teal graph visually represents financial data. Professional design elements provide an ideal visual for business reports and presentations , dreamy concept. Increase decrease graph illustrations Abstract Digital Financial Graph with Teal Data. Dynamic teal graph visually represents financial data. Professional design elements provide an ideal visual for business reports and presentations , dreamy concept
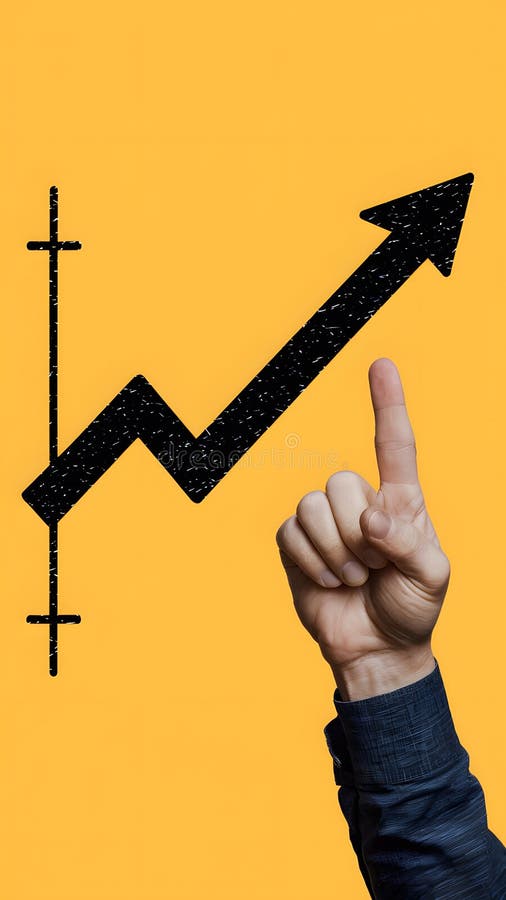
Free with trial Abstract graph with zigzag pattern, 3 data points connected by line, hand pointing upwards Generative AI. Increase decrease graph illustrations Abstract graph with zigzag pattern, 3 data points connected by line, hand pointing upwards
Free with trial Abstract graph with zigzag pattern, 3 data points connected by line, hand pointing upwards Vertical Mobile Wallpaper. Increase decrease graph illustrations Abstract graph with zigzag pattern, 3 data points connected by line, hand pointing upwards
Free with trial Abstract graph with zigzag pattern, 3 data points connected by line, hand pointing upwards Vertical Mobile Wallpaper. Increase decrease graph illustrations Abstract graph with zigzag pattern, 3 data points connected by line, hand pointing upwards
Free with trial Abstract graph with zigzag pattern, 3 data points connected by line, hand pointing upwards Vertical Mobile Wallpaper. Increase decrease graph illustrations Abstract graph with zigzag pattern, 3 data points connected by line, hand pointing upwards
Free with trial Abstract graph with zigzag pattern, 3 data points connected by line, hand pointing upwards For Social Media Post Size. Increase decrease graph illustrations Abstract graph with zigzag pattern, 3 data points connected by line, hand pointing upwards
Free with trial Checklist line icon. Neumorphic, Green gradient, 3d pin buttons. Graph chart sign. Growth diagram symbol. Line icons. Neumorphic buttons with outline signs. Vector. Increase decrease graph vectors Checklist line icon. Graph chart sign. Line icons. Vector. Checklist line icon. Neumorphic, Green gradient, 3d pin buttons. Graph chart sign. Growth diagram symbol. Line icons. Neumorphic buttons with outline signs. Vector
Free with trial Line graph is representing market trend with data points. Increase decrease graph vectors Line graph showing market trend with data points. Line graph is representing market trend with data points
Free with trial A graph with a red arrow pointing upward. The graph is orange and blue. The graph is a representation of a trend or growth. Increase decrease graph vectors A graph with a red arrow pointing upward
Free with trial Factors of production for land in economics for demand of land and supply of land graph for rent vector. Increase decrease graph vectors Factors of production for land in economics for demand of land and supply of land graph for rent
Free with trial This simple icon depicts a line graph with one line trending upwards and one trending downwards. Increase decrease graph vectors Line graph showing upward and downward trends icon. This simple icon depicts a line graph with one line trending upwards and one trending downwards
Free with trial Graph phone line icon. Neumorphic, Red gradient, 3d pin buttons. Column chart sign. Growth diagram symbol. Line icons. Neumorphic buttons with outline signs. Vector. Increase decrease graph vectors Graph phone line icon. Column chart sign. Line icons. Vector. Graph phone line icon. Neumorphic, Red gradient, 3d pin buttons. Column chart sign. Growth diagram symbol. Line icons. Neumorphic buttons with outline signs. Vector
Free with trial Graph laptop line icon. Neumorphic, Purple gradient, 3d pin buttons. Column chart sign. Growth diagram symbol. Line icons. Neumorphic buttons with outline signs. Vector. Increase decrease graph vectors Graph laptop line icon. Column chart sign. Line icons. Vector. Graph laptop line icon. Neumorphic, Purple gradient, 3d pin buttons. Column chart sign. Growth diagram symbol. Line icons. Neumorphic buttons with outline signs. Vector
Free with trial Growth chart line icon. Neumorphic, Blue gradient, 3d pin buttons. Column graph sign. Market analytics symbol. Line icons. Neumorphic buttons with outline signs. Vector. Increase decrease graph vectors Growth chart line icon. Column graph sign. Line icons. Vector. Growth chart line icon. Neumorphic, Blue gradient, 3d pin buttons. Column graph sign. Market analytics symbol. Line icons. Neumorphic buttons with outline signs. Vector
Free with trial A modern flat design icon representing financial data analysis and market trends. This vector illustration features a combination of a green bar chart and a dark grey line graph, showing fluctuations in performance. An upward arrow indicates initial growth, followed by a volatile trend line symbolizing concepts like market instability, economic changes, profit and loss, or business analytics. This versatile graphic is perfect for infographics, financial reports, presentations, websites, and applications related to business, finance, statistics, and economics. Isolated on a white background for easy use. Increase decrease graph vectors Financial Market Fluctuation Graph Icon. A modern flat design icon representing financial data analysis and market trends. This vector illustration features a. A modern flat design icon representing financial data analysis and market trends. This vector illustration features a combination of a green bar chart and a dark grey line graph, showing fluctuations in performance. An upward arrow indicates initial growth, followed by a volatile trend line symbolizing concepts like market instability, economic changes, profit and loss, or business analytics. This versatile graphic is perfect for infographics, financial reports, presentations, websites, and applications related to business, finance, statistics, and economics. Isolated on a white background for easy use.
Free with trial Line Financial growth decrease icon isolated on white background. Increasing revenue. Colorful outline concept. Vector. Increase decrease graph vectors Line Financial growth decrease icon isolated on white background. Increasing revenue. Colorful outline concept. Vector
Free with trial Business graph is being drawn on a piece of paper with a pencil. Increase decrease graph illustrations Pencil drawing business graph on paper with pie chart. Business graph is being drawn on a piece of paper with a pencil
Free with trial A vibrant, 3D bar graph with colorful blocks rises against a white background. This modern infographic uses geometric shapes to represent data trends, making it a perfect visual for presentations, rep. Increase decrease graph illustrations Colorful Bar Graph. A vibrant, 3D bar graph with colorful blocks rises against a white background. This modern infographic uses geometric shapes to represent data trends, making it a perfect visual for presentations, rep
Free with trial Abstract Glowing Orange and Blue Data Graph. Increase decrease graph illustrations Abstract Glowing Orange and Blue Data Graph
Free with trial Pyramid chart line icon. Neumorphic, Orange gradient, 3d pin buttons. Analytics graph sign. Market analytics symbol. Line icons. Neumorphic buttons with outline signs. Vector. Increase decrease graph vectors Pyramid chart line icon. Analytics graph sign. Line icons. Vector. Pyramid chart line icon. Neumorphic, Orange gradient, 3d pin buttons. Analytics graph sign. Market analytics symbol. Line icons. Neumorphic buttons with outline signs. Vector
Free with trial Decreasing graph line icon. Neumorphic, Purple gradient, 3d pin buttons. Column chart sign. Market analytics symbol. Line icons. Neumorphic buttons with outline signs. Vector. Increase decrease graph vectors Decreasing graph line icon. Column chart sign. Line icons. Vector. Decreasing graph line icon. Neumorphic, Purple gradient, 3d pin buttons. Column chart sign. Market analytics symbol. Line icons. Neumorphic buttons with outline signs. Vector
Free with trial Statistics icon set, bar diagram illustration, business graph logo icon vector. Increase decrease graph vectors Statistics icon set, bar diagram illustration, business graph logo icon vector
Free with trial Laptop Displays Business Analytics Graph Data. Increase decrease graph illustrations Laptop Displays Business Analytics Graph Data
Free with trial Report statistics line icon. Neumorphic, Green gradient, 3d pin buttons. Column graph sign. Growth diagram symbol. Line icons. Neumorphic buttons with outline signs. Vector. Increase decrease graph vectors Report statistics line icon. Column graph sign. Line icons. Vector. Report statistics line icon. Neumorphic, Green gradient, 3d pin buttons. Column graph sign. Growth diagram symbol. Line icons. Neumorphic buttons with outline signs. Vector
Free with trial A vibrant abstract image depicting a neon pink graph rising and falling over a textured pink and blue landscape. Increase decrease graph illustrations Glowing Neon Graph Over Abstract Pink Terrain. A vibrant abstract image depicting a neon pink graph rising and falling over a textured pink and blue landscape
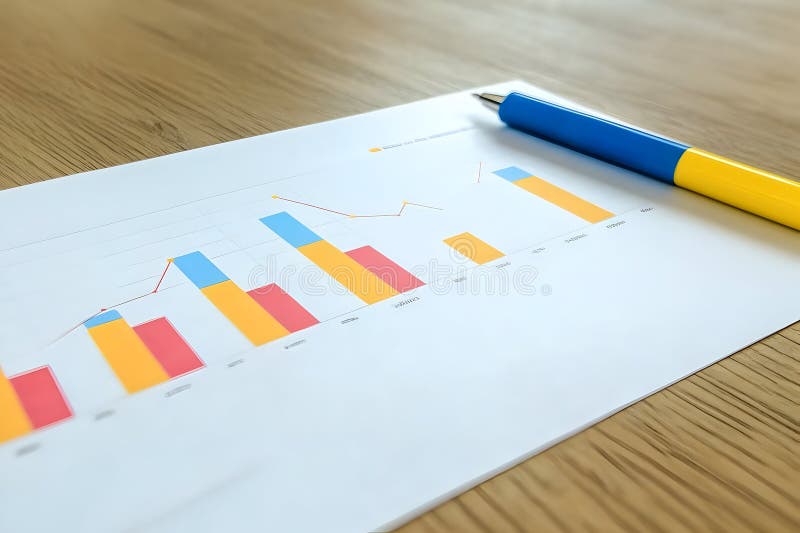
Free with trial Business graph chart report pen on wood table. Increase decrease graph illustrations Business graph chart report pen on wood table
Free with trial A turquoise moon hovers above a stock market graph with rising and falling arrows indicating market trends, useful for illustrating financial concepts. Increase decrease graph illustrations Stock Market Graph with Moon and Arrow Trends. A turquoise moon hovers above a stock market graph with rising and falling arrows indicating market trends, useful for illustrating financial concepts
Free with trial Cost low and loss. Decrease revenue. Crisis of economy. Icon of money inflation. Increase decrease graph vectors Cost low and loss. Decrease revenue. Crisis of economy.
Free with trial Risk Management Analysis Graph with Warning Signs, generative Ai. Increase decrease graph illustrations Risk Management Analysis Graph with Warning Signs
Free with trial Uptrend and downtrend zigzag arrow icon in rounded corner. Increase and decrease arrows sign symbol. Increase decrease graph vectors Uptrend and downtrend zigzag arrow icon in rounded corner
Free with trial 3D colorful pie chart and bar graph on a stack of documents illustrating business data and financial analysis. Perfect for presentations or reports. Increase decrease graph illustrations Colorful 3D Pie Chart and Bar Graph on Documents. 3D colorful pie chart and bar graph on a stack of documents illustrating business data and financial analysis. Perfect for presentations or reports.
Free with trial Set line Data analysis Search data Financial growth decrease Server security with padlock Pie chart infographic and icon. Vector. Increase decrease graph vectors Set line Data analysis, Search data, Financial growth decrease, Server security with padlock, Pie chart infographic, and
Free with trial The image shows a vibrant orange graph plotted against a dark, abstract background. the graph displays a curve that initially decreases, reaches a minimum, and then increases again. the background features a grid-like structure with vertical and diagonal blue glowing lines, creating a futuristic or technological feel. the overall impression is one of data visualization in a modern, stylized setting. Increase decrease graph illustrations Glowing orange graph on dark abstract background. the image shows a vibrant orange graph plotted against a dark, abstract background. the graph displays a curve that initially decreases, reaches a minimum, and then increases again. the background features a grid-like structure with vertical and diagonal blue glowing lines, creating a futuristic or technological feel. the overall impression is one of data visualization in a modern, stylized setting.
Free with trial Isometric Financial growth decrease icon isolated on orange and red background. Increasing revenue. Circle button. Vector. Increase decrease graph vectors Isometric Financial growth decrease icon isolated on orange and red background. Increasing revenue. Circle button
Free with trial Colorful graph chart is showing and comparing different data results with lines and dots. Increase decrease graph vectors Colorful graph chart showing different data comparing results. Colorful graph chart is showing and comparing different data results with lines and dots
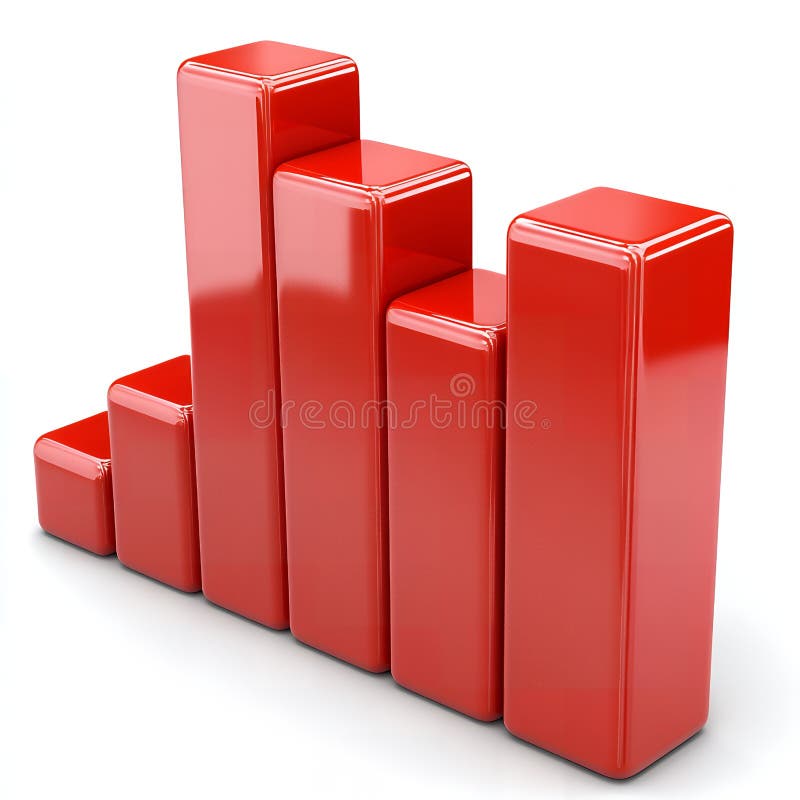
Free with trial Red bar graph with decreasing values. Generative AI. Increase decrease graph illustrations Red bar graph with decreasing values
Free with trial Line graph is depicting the fluctuation of the dollar currency over a period of time. Increase decrease graph illustrations Line graph showing dollar sign currency fluctuation over time. Line graph is depicting the fluctuation of the dollar currency over a period of time