Free with trial Abstract pastel color blocks forming a bar graph on a pink base. Ideal for presentations and reports illustrating business growth or statistical data. Increase decrease graph illustrations Colorful 3D Bar Chart Graph on Pink Base, Business Data Visualization. Abstract pastel color blocks forming a bar graph on a pink base. Ideal for presentations and reports illustrating business growth or statistical data.
Free with trial Graph chart going up and down sign arrows flat design vector illustration on white background. Increase decrease graph vectors Graph chart going up and down sign arrows flat design vector illustration
Free with trial Abstract line graph with four distinct data points connected by red line, indicating trend analysis and progress. Simple design. Increase decrease graph vectors Line graph with colored points showing data points and trend on white background. Abstract line graph with four distinct data points connected by red line, indicating trend analysis and progress. Simple design
Free with trial Business analytics concept showing quality up and cost down balance with rising and falling bar graph over keyboard. Financial performance analysis data , profit optimization and business decision. Increase decrease graph illustrations Business analytics concept showing quality up and cost down balance with rising and falling bar graph over keyboard. Financial
Free with trial Financial chart arrows. Colored trend lines. Market direction indicators. Vector graph elements. EPS 10. Increase decrease graph vectors Financial chart arrows. Colored trend lines. Market direction indicators. Vector graph elements
Free with trial A close-up shot of several stacks of coins placed on a financial graph with a blue upward trend line, symbolizing financial growth and investment success. Increase decrease graph illustrations Stacks of coins on a financial graph showing upward trend. A close-up shot of several stacks of coins placed on a financial graph with a blue upward trend line, symbolizing financial growth and investment success
Free with trial Financial chart arrow up and down icon isolated on white background. Growth and decline graph sign symbol illustration. Increase decrease graph vectors Financial chart arrow up and down icon isolated on white background. Growth and decline graph sign symbol
Free with trial Growth vector icon. Graph or diagram with arrow going up and down. Vector illustration. Increase decrease graph vectors Growth vector icon. Graph or diagram with arrow going up and down. Vector
Free with trial The image depicts a bar chart composed of eleven bars arranged horizontally. Each bar is colored with a gradient transitioning from red through orange, yellow, green, blue, and ending in purple. The bars start with a small height on the left, progressively increase to a peak in the middle, and then gradually decrease towards the right, illustrating a rise-and-fall pattern. The chart visually. Increase decrease graph illustrations Gradient bar chart showing progressive increase and decline. The image depicts a bar chart composed of eleven bars arranged horizontally. Each bar is colored with a gradient transitioning from red through orange, yellow, green, blue, and ending in purple. The bars start with a small height on the left, progressively increase to a peak in the middle, and then gradually decrease towards the right, illustrating a rise-and-fall pattern. The chart visually
Free with trial A business report illustration featuring a graph and chart, ideal for presentations and documents, conveying financial data and analysis in a clear and concise manner. Increase decrease graph vectors Illustration of business report with graph and chart, showcasing financial data and analysis for presentations and documents. A business report illustration featuring a graph and chart, ideal for presentations and documents, conveying financial data and analysis in a clear and concise manner
Free with trial This image depicts a large percentage symbol prominently placed over a stylized representation of a stock market graph, indicating trends and fluctuations in financial data. The design suggests a focus on interest rates, investment returns, or financial growth metrics. Increase decrease graph illustrations Percentage sign overlaid on a fluctuating stock market graph. This image depicts a large percentage symbol prominently placed over a stylized representation of a stock market graph, indicating trends and fluctuations in financial data. The design suggests a focus on interest rates, investment returns, or financial growth metrics
Free with trial The a digital screen displaying a financial graph with a green upward trending line representing data growth. The screen white text and numerical values, including a 5746% increase and a 5. 66% decrease. The background is dark, and the graph glows with a neon green hue, suggesting a futuristic or tech-oriented style. The interface includes a title bar with options like Dashboard, Announcements, and. Increase decrease graph illustrations Green upward trending financial graph on dark digital screen. The a digital screen displaying a financial graph with a green upward trending line representing data growth. The screen white text and numerical values, including a 5746% increase and a 5.66% decrease. The background is dark, and the graph glows with a neon green hue, suggesting a futuristic or tech-oriented style. The interface includes a title bar with options like Dashboard, Announcements, and
Free with trial A clear, minimalist vector illustration featuring two distinct directional icons against a clean white background. On the left, a green downward-pointing triangle is paired with four green horizontal rounded bars, symbolizing download, collapse, or a decrease. On the right, a red upward-pointing triangle is combined with four red horizontal rounded bars, representing upload, expand, or an increase. These graphic elements are ideal for user interface design, web applications, mobile apps, presentations, or any project requiring clear visual indicators for data transfer, status, or directional actions. Increase decrease graph vectors Download and Upload Icons: Green Down, Red Up Arrows with Bars. A clear, minimalist vector illustration featuring two distinct directional icons against a clean white background. On the left, a green downward-pointing triangle is paired with four green horizontal rounded bars, symbolizing download, collapse, or a decrease. On the right, a red upward-pointing triangle is combined with four red horizontal rounded bars, representing upload, expand, or an increase. These graphic elements are ideal for user interface design, web applications, mobile apps, presentations, or any project requiring clear visual indicators for data transfer, status, or directional actions.
Free with trial Bar chart with line graph overlay showing annual data trends over time. Increase decrease graph vectors Bar chart showing annual data trends with line graph overlay. Bar chart with line graph overlay showing annual data trends over time
Free with trial Dual trend line graph bar business growth and decline visualization. Increase decrease graph vectors Profit growth and loss decline business graph bar. Dual trend line graph bar business growth and decline visualization
Free with trial Frosted glass Financial growth decrease icon isolated on white background. Increasing revenue. Minimalism concept. 3D render illustration. Increase decrease graph illustrations Frosted glass Financial growth decrease icon isolated on white background. Increasing revenue. Minimalism concept. 3D
Free with trial Graph laptop line icon. Halftone dotted pattern. Gradient icon with grain shadow. Column chart sign. Growth diagram symbol. Line graph laptop icon. Various designs. Vector. Increase decrease graph illustrations Graph laptop line icon. Column chart sign. Halftone dotted pattern. Vector. Graph laptop line icon. Halftone dotted pattern. Gradient icon with grain shadow. Column chart sign. Growth diagram symbol. Line graph laptop icon. Various designs. Vector
Free with trial The image contains six different charts depicting various data trends. The top row features a bar chart with a downward arrow indicating a decrease, a bar chart with an upward arrow indicating growth, and a line chart showing a steady increase. The bottom row includes a bar chart with a gradual increase, a line chart with a sharp upward trend, and another line chart with a fluctuating but overall. Increase decrease graph illustrations Diverse bar and line charts illustrating various data trends. The image contains six different charts depicting various data trends. The top row features a bar chart with a downward arrow indicating a decrease, a bar chart with an upward arrow indicating growth, and a line chart showing a steady increase. The bottom row includes a bar chart with a gradual increase, a line chart with a sharp upward trend, and another line chart with a fluctuating but overall
Free with trial A graph illustrating the relationship between sleep, screen time, and mood over days and weeks. Increase decrease graph vectors Sleep and Screen Time Correlation Graph Showing Mood and Time Progression. A graph illustrating the relationship between sleep, screen time, and mood over days and weeks
Free with trial This clear and simple graph illustrates two opposing trends over time. Trend A, depicted in red, shows a steady decline, starting from a high value and decreasing as time progresses. In contrast, Trend B, shown in blue, demonstrates a consistent upward trajectory, beginning at zero and increasing over the same time period. The intersection point signifies a critical juncture where the values of both trends are equal. This visual is ideal for explaining concepts like competition, growth versus decline, or contrasting performance metrics. Increase decrease graph vectors Conflicting Trends: Upward vs. Downward Trajectories on a Graph. This clear and simple graph illustrates two opposing trends over time. Trend A, depicted in red, shows a steady decline, starting from a high value and decreasing as time progresses. In contrast, Trend B, shown in blue, demonstrates a consistent upward trajectory, beginning at zero and increasing over the same time period. The intersection point signifies a critical juncture where the values of both trends are equal. This visual is ideal for explaining concepts like competition, growth versus decline, or contrasting performance metrics.
Free with trial This digital image shows a glowing blue financial graph indicating market trends, growth, and data analysis. Increase decrease graph illustrations Blue digital financial graph representing increasing data and information. This digital image shows a glowing blue financial graph indicating market trends, growth, and data analysis
Free with trial Abstract graph with stars showing growth or decline illustration. Increase decrease graph vectors Abstract graph with stars showing growth or decline illustration
Free with trial A modern, minimalistic infographic on a beige background displays maternal age trends across six distinct watch types, using a combination of line graphs and visual watch representations to illustrate percentage changes, where 20% of watches show a 20% increase in maternal age, 80% show an 80% increase, 25% reflect a 25% increase, 30% indicate a 30% decrease, and 40% demonstrate a 40% decrease,. Increase decrease graph illustrations Modern infographic showing maternal age trends across six watch types with percentage changes and minimalist design. A modern, minimalistic infographic on a beige background displays maternal age trends across six distinct watch types, using a combination of line graphs and visual watch representations to illustrate percentage changes, where 20% of watches show a 20% increase in maternal age, 80% show an 80% increase, 25% reflect a 25% increase, 30% indicate a 30% decrease, and 40% demonstrate a 40% decrease,
Free with trial Black and white icon of a graph with a leaf, representing agriculture commodity trends. Increase decrease graph illustrations Agriculture commodity graph with leaf icon and text chart data. Black and white icon of a graph with a leaf, representing agriculture commodity trends
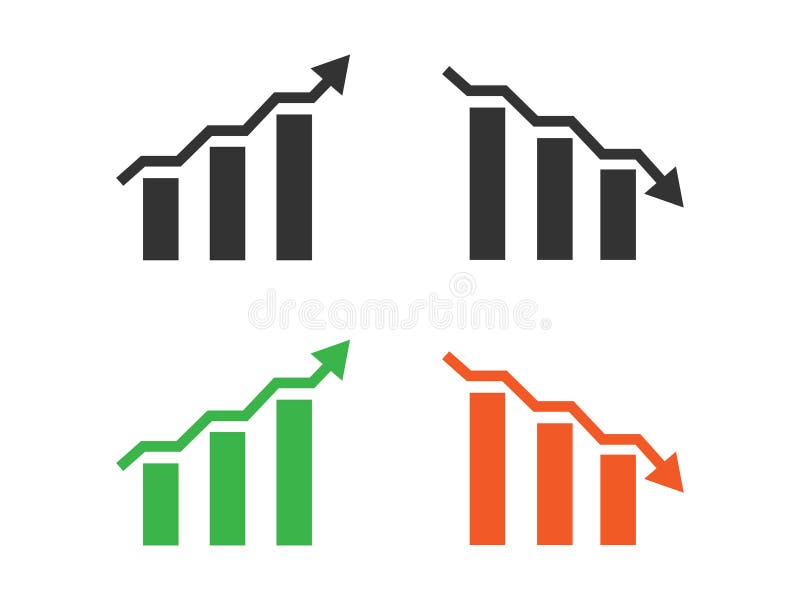
Free with trial This image features a bar graph with two sections. The left section shows an upward trend with a green arrow pointing upwards, indicating growth or increase. The right section displays a downward trend with a red arrow pointing downwards, indicating decline or decrease. The image is set against a transparent background, making it suitable for various design applications. Increase decrease graph illustrations Bar graph with up and down arrows isolated on white background. This image features a bar graph with two sections. The left section shows an upward trend with a green arrow pointing upwards, indicating growth or increase. The right section displays a downward trend with a red arrow pointing downwards, indicating decline or decrease. The image is set against a transparent background, making it suitable for various design applications
Free with trial Abstract image of stock market graph represented by orange glowing line against dark blue background with swirling blue clouds. Fiery line financial data, volatility, market trends in. Increase decrease graph illustrations Abstract image of stock market graph represented by orange glowing line against dark blue background with swirling blue clouds.
Free with trial A simple graph illustration with red dots connected by black lines, representing data trends and statistical analysis on a clean, white background. Increase decrease graph vectors Vector art of red dots connected by black lines forming a graph. A simple graph illustration with red dots connected by black lines, representing data trends and statistical analysis on a clean, white background
Free with trial A data visualization bar graph displays three vertical bars arranged horizontally showing the relationship between positive and negative values with green bars representing positive data points on the left, orange and red bars indicating negative values in the middle, all set against a soft gradient background blending light green and pink tones with a central white square containing the word. Increase decrease graph illustrations Bar graph showing positive and negative values comparison with green and red colored vertical bars on gradient background. A data visualization bar graph displays three vertical bars arranged horizontally showing the relationship between positive and negative values with green bars representing positive data points on the left, orange and red bars indicating negative values in the middle, all set against a soft gradient background blending light green and pink tones with a central white square containing the word
Free with trial A black bar graph shows two bars labeled COST and REVENUE on a white background. Clear details and vibrant col. Increase decrease graph illustrations Black bar graph with COST and REVENUE labels on white background cost revenue. A black bar graph shows two bars labeled COST and REVENUE on a white background. Clear details and vibrant col
Free with trial A magnifying glass focuses on a graph showing contrasting trends, with one line rising and another falling. Increase decrease graph illustrations Magnifying Glass Over Upward and Downward Trend Lines on Graph. A magnifying glass focuses on a graph showing contrasting trends, with one line rising and another falling
Free with trial The image shows a stock market screen with various stock prices and their changes. Some stocks are highlighted in red, indicating a decrease in price, while others are highlighted in green, indicating an increase. The screen also shows the volume of shares traded for each stock. Increase decrease graph illustrations A stock market screen displaying various stock prices and their changes. The image shows a stock market screen with various stock prices and their changes. Some stocks are highlighted in red, indicating a decrease in price, while others are highlighted in green, indicating an increase. The screen also shows the volume of shares traded for each stock
Free with trial This graph illustrates the trends in volume and not frequency over several quarters, with notable peaks observed in Q3. Increase decrease graph illustrations Graph showing volume and not frequency over time with peaks in q3. This graph illustrates the trends in volume and not frequency over several quarters, with notable peaks observed in Q3
Free with trial The image depicts a line graph with a purple line illustrating a fluctuating trend. The area under the line is shaded in light purple, indicating the cumulative value over time. The graph has a steady upward trend with several peaks and troughs, suggesting variability in the data. Increase decrease graph illustrations A graph showing a fluctuating trend with a purple line and shaded area. The image depicts a line graph with a purple line illustrating a fluctuating trend. The area under the line is shaded in light purple, indicating the cumulative value over time. The graph has a steady upward trend with several peaks and troughs, suggesting variability in the data
Free with trial The image depicts a visual metaphor for increasing costs. It features the word 'COST' spelled out with large wooden letters, each letter resting on a stack of coins. Above the word 'COST', there is a wooden arrow that initially rises, indicating an increase, but then sharply drops, symbolizing a subsequent decline or decrease in cost. The background is a neutral, light-colored surface, which helps. Increase decrease graph illustrations Illustration of rising costs with stacked coins and downward arrow. The image depicts a visual metaphor for increasing costs. It features the word 'COST' spelled out with large wooden letters, each letter resting on a stack of coins. Above the word 'COST', there is a wooden arrow that initially rises, indicating an increase, but then sharply drops, symbolizing a subsequent decline or decrease in cost. The background is a neutral, light-colored surface, which helps
Free with trial A sophisticated 3D rendered bar graph composed of multiple vertical blue glass bars arranged in a line with varying heights, where the tallest bar appears at the bottom right side and the shortest bars are positioned at the top left, creating a visually striking data visualization against a clean white background that emphasizes the transparent glass-like material and realistic lighting effects. Increase decrease graph illustrations 3D rendered blue glass bar graph showing data visualization with vertical columns of varying heights on white background. A sophisticated 3D rendered bar graph composed of multiple vertical blue glass bars arranged in a line with varying heights, where the tallest bar appears at the bottom right side and the shortest bars are positioned at the top left, creating a visually striking data visualization against a clean white background that emphasizes the transparent glass-like material and realistic lighting effects
Free with trial A series of colorful bars representing a graph, each with water droplets, illuminated by a spotlight against a dark background with blurred city lights. Increase decrease graph illustrations Colorful bar graph with water droplets under a spotlight on a dark background with bokeh city lights. A series of colorful bars representing a graph, each with water droplets, illuminated by a spotlight against a dark background with blurred city lights
Free with trial This financial data illustration set features a stack of coins with a dollar sign alongside euro and pound currency stacks on the left, while the right side displays six analytical graphs including a blue downward trend graph, a green upward trend graph, a dual-color bar graph representing growth or decline, a bar graph with a green upward arrow indicating value increase, a pound coin illustration. Increase decrease graph illustrations Set of four financial data illustrations showing currency stacks and business graphs with trends for investment analysis and. This financial data illustration set features a stack of coins with a dollar sign alongside euro and pound currency stacks on the left, while the right side displays six analytical graphs including a blue downward trend graph, a green upward trend graph, a dual-color bar graph representing growth or decline, a bar graph with a green upward arrow indicating value increase, a pound coin illustration
Free with trial A black magnifying glass is placed over a bar graph on a white background. Clear details and vibrant colors en. Increase decrease graph illustrations Magnifying Glass Over Bar Graph Icon on White Background chart data. A black magnifying glass is placed over a bar graph on a white background. Clear details and vibrant colors en
Free with trial Black graph showing upward and downward trends with jagged peaks on white. Clear details and vibrant colors en. Increase decrease graph illustrations Up and down trend graph with jagged peaks on white background chart. Black graph showing upward and downward trends with jagged peaks on white. Clear details and vibrant colors en
Free with trial This image depicts a financial graph illustrating net worth over time, featuring a teal shaded area and a line graph with data points. The graph is presented on a clean white background, making it easy to read and understand. The image is suitable for use in financial reports, presentations, and marketing materials, providing a clear and concise visual representation of financial data. The graph's design is simple, yet effective, allowing viewers to quickly grasp the trend and pattern of net worth changes over time. Increase decrease graph vectors A financial graph showing net worth over time with a teal shaded area. This image depicts a financial graph illustrating net worth over time, featuring a teal shaded area and a line graph with data points. The graph is presented on a clean white background, making it easy to read and understand. The image is suitable for use in financial reports, presentations, and marketing materials, providing a clear and concise visual representation of financial data. The graph's design is simple, yet effective, allowing viewers to quickly grasp the trend and pattern of net worth changes over time.
Free with trial A visually appealing bar graph illustration against a sleek black background, showcasing business growth, data analysis, and statistical trends. The illustration is suitable for presentations, reports, and web content related to finance, marketing, and technology. Increase decrease graph illustrations Bar Graph Illustration Business Growth, Data Analysis, and Statistics. A visually appealing bar graph illustration against a sleek black background, showcasing business growth, data analysis, and statistical trends. The illustration is suitable for presentations, reports, and web content related to finance, marketing, and technology.
Free with trial An open textbook displays a vertical bar graph composed of six brightly colored orange, yellow, and red bars arranged from highest to lowest, symbolizing data analysis, statistical growth, and performance metrics, set against a plain beige background with scattered white dots that add a dynamic and energetic feel, creating a vibrant visual metaphor for progress, research, and educational. Increase decrease graph illustrations Open book with colorful bar graph on top showing data analysis, statistics, and growth metrics in vibrant orange, yellow, and red. An open textbook displays a vertical bar graph composed of six brightly colored orange, yellow, and red bars arranged from highest to lowest, symbolizing data analysis, statistical growth, and performance metrics, set against a plain beige background with scattered white dots that add a dynamic and energetic feel, creating a vibrant visual metaphor for progress, research, and educational
Free with trial A visually striking bar graph illustration depicting both upward and downward trends, set against a clean white background, representing market dynamics and data analysis. Increase decrease graph vectors Vector art of a dynamic bar graph illustration showcasing both upward and downward trends, , symbolizing market fluctuations and. A visually striking bar graph illustration depicting both upward and downward trends, set against a clean white background, representing market dynamics and data analysis
Free with trial A 3D illustration of a magnifying glass over a bar chart and line graph on a white background. Increase decrease graph vectors Magnifying glass over bar chart and line graph transparent background. A 3D illustration of a magnifying glass over a bar chart and line graph on a white background
Free with trial This image depicts a 3D bar graph with red bars. Initially, there is a sharp decline, followed by a significant upward trend, indicating a recovery or growth phase. The graph is set against a plain white background. Increase decrease graph illustrations A 3d graph showing a sharp decline followed by a significant upward trend. This image depicts a 3D bar graph with red bars. Initially, there is a sharp decline, followed by a significant upward trend, indicating a recovery or growth phase. The graph is set against a plain white background
Free with trial A digital illustration on a black background features a world map rendered in shades of pink and purple with Data Doomsday text above it, divided into sections representing different data levels and centered by a line graph tracking data progression from 2000 to 2100 with green lines showing pre-industrial and contemporary data trends arranged vertically with a legend explaining each metric. Increase decrease graph illustrations Data doomsday digital illustration showing world map with pink purple color scheme and line graph tracking data levels from 2000. A digital illustration on a black background features a world map rendered in shades of pink and purple with Data Doomsday text above it, divided into sections representing different data levels and centered by a line graph tracking data progression from 2000 to 2100 with green lines showing pre-industrial and contemporary data trends arranged vertically with a legend explaining each metric
Free with trial A vibrant data visualization concept featuring a colorful vertical bar graph with gradient shades of blue, green, yellow, orange, and red arranged sequentially inside a transparent rectangular glass box against a clean white background, where two stylized red sun symbols positioned in the top right corner add symbolic elements to the analytical display, creating an abstract representation of. Increase decrease graph illustrations Colorful vertical bar graph with red sun symbols inside a glass box on white background representing data visualization and. A vibrant data visualization concept featuring a colorful vertical bar graph with gradient shades of blue, green, yellow, orange, and red arranged sequentially inside a transparent rectangular glass box against a clean white background, where two stylized red sun symbols positioned in the top right corner add symbolic elements to the analytical display, creating an abstract representation of
Free with trial Financial graph with candlestick chart and world map on a light background. Concept of global business and finance. 3D Rendering. Increase decrease graph illustrations Financial graph with candlestick chart and world map on light background. 3D Rendering. Financial graph with candlestick chart and world map on a light background. Concept of global business and finance. 3D Rendering
Free with trial Simple and clean blue gradient line graph is going up and down showing growth and decline over a period of time. Increase decrease graph vectors Blue gradient line graph showing growth and decline over time. Simple and clean blue gradient line graph is going up and down showing growth and decline over a period of time
Free with trial Computer screen displaying a simple statistical business graph, perfect for illustrating concepts like data analysis. Increase decrease graph illustrations Computer showing statistical business graph on screen. Computer screen displaying a simple statistical business graph, perfect for illustrating concepts like data analysis
Free with trial A blue bar graph with a red downward-pointing arrow labeled GDP displayed on a digital screen with a dark background and subtle grid lines bar, graph, blue. blue bar graph with red. Increase decrease graph illustrations Blue bar graph with red downward arrow labeled g d p on digital screen. A blue bar graph with a red downward-pointing arrow labeled GDP displayed on a digital screen with a dark background and subtle grid lines bar, graph, blue. blue bar graph with red
Free with trial This image features a bar chart with four bars. The first bar is the tallest, and the subsequent bars decrease in height. The third bar has an arrow pointing downwards, and the fourth bar has an arrow pointing upwards, indicating a slight increase. Increase decrease graph illustrations Bar chart showing a downward trend with a slight upward shift at the end. This image features a bar chart with four bars. The first bar is the tallest, and the subsequent bars decrease in height. The third bar has an arrow pointing downwards, and the fourth bar has an arrow pointing upwards, indicating a slight increase
Free with trial The image displays three separate visual representations of waveforms, likely depicting sound or audio signals. The top waveform shows a dense and irregular pattern, indicating varying frequencies and amplitudes. The middle waveform appears more structured with a gradual increase and decrease in amplitude, forming a smooth, elongated shape. The bottom waveform consists of multiple overlapping,. Increase decrease graph illustrations Three distinct waveforms illustrating sound wave intensity and patterns. The image displays three separate visual representations of waveforms, likely depicting. The image displays three separate visual representations of waveforms, likely depicting sound or audio signals. The top waveform shows a dense and irregular pattern, indicating varying frequencies and amplitudes. The middle waveform appears more structured with a gradual increase and decrease in amplitude, forming a smooth, elongated shape. The bottom waveform consists of multiple overlapping,
Free with trial A close up of a red line graph with peaks and valleys on a textured light background. Generative AI. Increase decrease graph illustrations A close up of a red line graph with peaks and valleys on a textured light background
Free with trial A white line graph icon with three data points is displayed on a dark circular button against a white background. Increase decrease graph illustrations Line Graph Icon on Dark Circular Button with White Background chart data. A white line graph icon with three data points is displayed on a dark circular button against a white background
Free with trial A vibrant and detailed bar chart with a line graph overlay, showcasing financial data trends over time. The chart features a variety of colors, including shades of green, purple, and blue, with data points marked by small diamond shapes. The background is a dark blue grid, providing a stark contrast to the colorful data visualization. Increase decrease graph illustrations Colorful bar chart and line graph representing financial data trends. A vibrant and detailed bar chart with a line graph overlay, showcasing financial data trends over time. The chart features a variety of colors, including shades of green, purple, and blue, with data points marked by small diamond shapes. The background is a dark blue grid, providing a stark contrast to the colorful data visualization
Free with trial A blue zig zag line represents a stock market graph that rises and falls. It is placed upon a financial square grid of many small blocks with color changing from red to blue. Increase decrease graph illustrations Stock Market Graph Showing Trending Line on Financial Grid During Daytime. A blue zig zag line represents a stock market graph that rises and falls. It is placed upon a financial square grid of many small blocks with color changing from red to blue.
Free with trial Marketing. A vibrant and modern bar graph with glowing neon colors represents data and business growth. Increase decrease graph illustrations Glowing Bar Graph Data Visualization, Business Growth, Statistics, marketing. marketing. A vibrant and modern bar graph with glowing neon colors represents data and business growth.
Free with trial This abstract digital artwork features a blue and gray bar graph with data points highlighting growth trends on a dark background, ideal for business and analytics themes Generative AI. Increase decrease graph illustrations Blue and Gray Bar Graph with Data Points Representing Growth Trends and Statistical Analysis in Digital Format on Dark Background. This abstract digital artwork features a blue and gray bar graph with data points highlighting growth trends on a dark background, ideal for business and analytics themes Generative AI
Free with trial Simple flat design illustration of a stock market trend graph with a blue fill. The axis are dark gray and background is black. Increase decrease graph vectors Flat Design Stock Market Trend Graph with Axis on a Black Background. Simple flat design illustration of a stock market trend graph with a blue fill. The axis are dark gray and background is black.
Free with trial A multi-colored line graph compares pharmaceutical or medical dosage levels across different countries from the year 2000 onward, featuring seven distinct colored lines in orange, yellow, green, red, blue, purple, and pink that represent various dose types arranged in wave-like patterns with the orange line positioned highest on the left side indicating elevated doses while the green line shows. Increase decrease graph illustrations Comparative dose graph showing multiple countries and years with colored lines representing different pharmaceutical or medical. A multi-colored line graph compares pharmaceutical or medical dosage levels across different countries from the year 2000 onward, featuring seven distinct colored lines in orange, yellow, green, red, blue, purple, and pink that represent various dose types arranged in wave-like patterns with the orange line positioned highest on the left side indicating elevated doses while the green line shows
Free with trial Stacks of gold coins in varying heights are arranged in front of a blurred dark background displaying a red and green financial graph. Increase decrease graph illustrations Stacks of gold coins in front of a blurred stock market graph money finance 1. Stacks of gold coins in varying heights are arranged in front of a blurred dark background displaying a red and green financial graph
Free with trial Illustration of financial line graph showing growth. Upward trending arrow, chart, bar chart, income, finance, business, statistics development. Visual representation of success. Increase decrease graph illustrations Illustration of financial line graph showing growth. Upward trending arrow, chart, bar chart, income, finance, business
Free with trial This image depicts a candlestick chart, a type of financial chart used to describe price movements of securities, derivatives, or currencies. The chart shows a series of green and red vertical bars, with each bar representing a specific time period. The green bars indicate a price increase, while the red bars indicate a price decrease. Each bar has a rectangular body and thin lines, or wicks,. Increase decrease graph illustrations Candlestick chart showing the rise and fall of stock prices over time. This image depicts a candlestick chart, a type of financial chart used to describe price movements of securities, derivatives, or currencies. The chart shows a series of green and red vertical bars, with each bar representing a specific time period. The green bars indicate a price increase, while the red bars indicate a price decrease. Each bar has a rectangular body and thin lines, or wicks,
Free with trial A modern 3D rendering of a vertical bar graph titled COST ANALYSIS displays multiple stacked bars of varying heights representing different percentages, with the tallest green bar at the bottom and shorter blue bars ascending upward against a dark blue background featuring a subtle grid pattern, creating a professional data visualization for financial reports, business presentations, or analytical. Increase decrease graph illustrations 3D rendered bar graph chart showing cost analysis with percentage data visualization in green and blue colors on dark background. A modern 3D rendering of a vertical bar graph titled COST ANALYSIS displays multiple stacked bars of varying heights representing different percentages, with the tallest green bar at the bottom and shorter blue bars ascending upward against a dark blue background featuring a subtle grid pattern, creating a professional data visualization for financial reports, business presentations, or analytical
Free with trial The image displays a simple bar chart composed of five red bars of varying heights. Each bar has arrows pointing upward or downward, indicating an increase or decrease in values. The chart visually represents fluctuations in data, with the tallest bar in the center and the shortest bars on the far left and right. Increase decrease graph illustrations Red bar chart with upward and downward directional arrows indicating trends. The image displays a simple bar chart composed of five red bars of varying heights. Each bar has arrows pointing upward or downward, indicating an increase or decrease in values. The chart visually represents fluctuations in data, with the tallest bar in the center and the shortest bars on the far left and right
Free with trial Colorful bar graph showing market growth and success over time. Increase decrease graph vectors Colorful bar graph showing market growth and success
Free with trial Illustration of a line graph connecting points above bar graph on black. Flat design with blue outlines, orange points, and blue and green bars. Increase decrease graph vectors Line graph and bar graph showing growth and trends, isolated on black background. Illustration of a line graph connecting points above bar graph on black. Flat design with blue outlines, orange points, and blue and green bars.
Free with trial Laptop displaying stock market graph on a wooden desk with plants, dynamic background Generative AI. Increase decrease graph illustrations Laptop displaying stock market graph on a wooden desk with plants
Free with trial Growth and decline bar chart icon illustration. Upward and downward arrow graph symbol. Business up and down trend concept. Increase decrease graph vectors Growth and decline bar chart icon. Upward and downward arrow graph symbol. Business up and down trend concept
Free with trial Diagram chart line icon. Neumorphic, Green gradient, 3d pin buttons. Analytics graph sign. Market analytics symbol. Line icons. Neumorphic buttons with outline signs. Vector. Increase decrease graph vectors Diagram chart line icon. Analytics graph sign. Line icons. Vector. Diagram chart line icon. Neumorphic, Green gradient, 3d pin buttons. Analytics graph sign. Market analytics symbol. Line icons. Neumorphic buttons with outline signs. Vector
Free with trial The image shows a framed bar chart with red and green bars. The bars represent data trends over time, with the green bars showing an increase and the red bars showing a decrease. The chart is displayed on a white background with a wooden frame. Increase decrease graph illustrations A framed bar chart with red and green bars representing data trends over time. The image shows a framed bar chart with red and green bars. The bars represent data trends over time, with the green bars showing an increase and the red bars showing a decrease. The chart is displayed on a white background with a wooden frame
Free with trial A 3D rendered graphic displays a colorful bar chart with bars in orange, green, yellow, and pink. A yellow line with white dots connects points above the bars, forming a trend graph. A blue rectangular background with a white strip containing green, orange, and blue dots sits at the top. The object is isolated on a white background. Increase decrease graph vectors 3 D colorful bar chart graph with line and dots on blue background statistics. A 3D rendered graphic displays a colorful bar chart with bars in orange, green, yellow, and pink. A yellow line with white dots connects points above the bars, forming a trend graph. A blue rectangular background with a white strip containing green, orange, and blue dots sits at the top. The object is isolated on a white background
Free with trial The image shows a red line graph with data points connected by lines, creating a zigzag pattern that overall trends upwards from the bottom left to the top right of the image. Increase decrease graph illustrations A red line graph depicting fluctuating data points with a general upward trend. The image shows a red line graph with data points connected by lines, creating a zigzag pattern that overall trends upwards from the bottom left to the top right of the image
Free with trial The image shows an easel holding a white poster with a blue bar and line chart. The chart depicts a series of vertical bars that gradually decrease in height, accompanied by a line graph that rises initially and then declines. The easel is positioned on a plain, light-colored background, emphasizing the visual data presentation on the poster. Increase decrease graph illustrations Easel displaying a bar and line chart illustrating financial or data trends. The image shows an easel holding a white poster with a blue bar and line chart. The chart depicts a series of vertical bars that gradually decrease in height, accompanied by a line graph that rises initially and then declines. The easel is positioned on a plain, light-colored background, emphasizing the visual data presentation on the poster
Free with trial The image depicts a line graph with a light blue line representing the changes in stock price over time. The graph shows various peaks and troughs, indicating the volatility of the stock. The background is a light, gradient blue color, providing a clear contrast to the line graph. Increase decrease graph illustrations A detailed line graph showing the fluctuations of a stock price over a period of time. The image depicts a line graph with a light blue line representing the changes in stock price over time. The graph shows various peaks and troughs, indicating the volatility of the stock. The background is a light, gradient blue color, providing a clear contrast to the line graph
Free with trial This image is a line graph depicting the trend of data points. The graph has a clear peak in the middle, with data points tapering off towards both ends. The x-axis is labeled with numerical values from 0 to 9, and the y-axis is labeled with values ranging from 0 to 100. The title of the graph is 'Data Trend. Increase decrease graph illustrations Graph showing the trend of data points with a peak in the middle and tapering ends. This image is a line graph depicting the trend of data points. The graph has a clear peak in the middle, with data points tapering off towards both ends. The x-axis is labeled with numerical values from 0 to 9, and the y-axis is labeled with values ranging from 0 to 100. The title of the graph is 'Data Trend
Free with trial The image shows a collection of silver coins scattered on a surface, with a graph of fluctuating values in the background. The graph lines are in blue and red, indicating possible trends in the value of the coins over time. Increase decrease graph illustrations A collection of silver coins with a graph of fluctuating values in the background. The image shows a collection of silver coins scattered on a surface, with a graph of fluctuating values in the background. The graph lines are in blue and red, indicating possible trends in the value of the coins over time
Free with trial The image is a line graph that displays the daily number of covid-19 cases and deaths in the United States. The x-axis represents the timeline, while the y-axis indicates the number of cases and deaths. The graph uses two different colors to differentiate between the number of cases and deaths. Increase decrease graph illustrations Graph showcasing the daily number of covid-19 cases and deaths in the united states. The image is a line graph that displays the daily number of covid-19 cases and deaths in the United States. The x-axis represents the timeline, while the y-axis indicates the number of cases and deaths. The graph uses two different colors to differentiate between the number of cases and deaths