Free with trial Colorful line graph showing growth and decline of different data from 2018, 2019 and 2020, providing a visual representation of performance trends over time. Increase decrease graph vectors Colorful line graph showing growth and decline of different data from 2018, 2019 and 2020, providing a visual
Free with trial A minimalist vector icon illustrating market volatility and financial trends. The graphic features two distinct line graphs on a coordinate system: a jagged, highly fluctuating upper line representing high volatility, and a smoother lower line with marked points indicating a general trend. Up-down arrows and separate up down indicators further emphasize market movement and unpredictable changes. Ideal for financial reports, business presentations, data visualization, and economic analysis. Increase decrease graph vectors Market Volatility and Financial Trend Graph Icon. A minimalist vector icon illustrating market volatility and financial trends. The graphic features two distinct line graphs on a coordinate system: a jagged, highly fluctuating upper line representing high volatility, and a smoother lower line with marked points indicating a general trend. Up-down arrows and separate up down indicators further emphasize market movement and unpredictable changes. Ideal for financial reports, business presentations, data visualization, and economic analysis.
Free with trial This image depicts a financial graph with upward and downward trends overlaid on a background of stacked coins, symbolizing wealth and financial growth. Increase decrease graph illustrations Fluctuating financial trends overlaid on stacked coins. This image depicts a financial graph with upward and downward trends overlaid on a background of stacked coins, symbolizing wealth and financial growth
Free with trial This AI-generated image depicts a calculator displaying "TAX-2025" alongside a bar graph, illustrating potential tax revenue projections for the year. The graph, generated by AI, shows a projected decrease in tax revenue over time. This visualization is helpful for financial planning and forecastin. Increase decrease graph illustrations Tax Projections 2025. This AI-generated image depicts a calculator displaying "TAX-2025" alongside a bar graph, illustrating potential tax revenue projections for the year. The graph, generated by AI, shows a projected decrease in tax revenue over time. This visualization is helpful for financial planning and forecastin
Free with trial Filled outline Financial growth decrease icon isolated on blue background. Increasing revenue. Vector. Increase decrease graph vectors Filled outline Financial growth decrease icon isolated on blue background. Increasing revenue. Vector
Free with trial Filled outline Financial growth decrease icon isolated on blue background. Increasing revenue. Vector. Increase decrease graph illustrations Filled outline Financial growth decrease icon isolated on blue background. Increasing revenue. Vector
Free with trial Filled outline Financial growth decrease icon isolated on white background. Increasing revenue. Vector. Increase decrease graph vectors Filled outline Financial growth decrease icon isolated on white background. Increasing revenue. Vector
Free with trial Glowing neon Financial growth decrease icon isolated on brick wall background. Increasing revenue. Vector. Increase decrease graph vectors Glowing neon Financial growth decrease icon isolated on brick wall background. Increasing revenue. Vector
Free with trial Colorful Financial growth decrease icon isolated on white background. Increasing revenue. Minimalism concept. 3D render illustration. Increase decrease graph illustrations Colorful Financial growth decrease icon isolated on white background. Increasing revenue. Minimalism concept. 3D render
Free with trial This image presents a detailed timeline infographic illustrating the archaeological dig restoration process spanning from 2004 to 2005, divided into six distinct color-coded sections that visually represent different procedural steps using blue, green, yellow, and orange hues to track the steady increase and subsequent decrease in dig records over time, featuring a bold white title reading. Increase decrease graph illustrations Archaeological dig restoration process timeline infographic showing progress from 2004 to 2005 with color-coded sections and. This image presents a detailed timeline infographic illustrating the archaeological dig restoration process spanning from 2004 to 2005, divided into six distinct color-coded sections that visually represent different procedural steps using blue, green, yellow, and orange hues to track the steady increase and subsequent decrease in dig records over time, featuring a bold white title reading
Free with trial Economic graph showing tariffs impact on import and export costs from 2020 to 2025 with rising and falling trend lines, ideal for finance, trade, and global economy topics. 3d rendering. Increase decrease graph illustrations Economic graph showing tariffs impact on import and export costs from 2020 to 2025 with rising and falling trend lines, ideal for
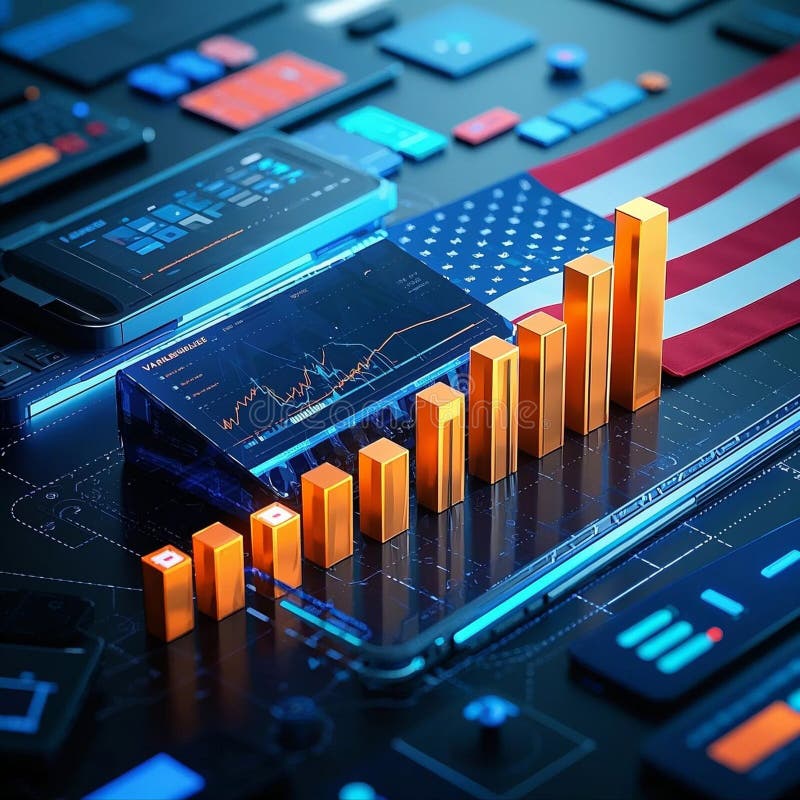
Free with trial Data charts shown on mobile devices displayed with a bar graph represent growth and financial analysis on a tech interface Perfect for illustrating investment or business trends. Increase decrease graph illustrations Analyzing Stock Market Data with Mobile Tech and Bar Graph. Data charts shown on mobile devices displayed with a bar graph represent growth and financial analysis on a tech interface Perfect for illustrating investment or business trends
Free with trial Green up and red down 3d arrow graph showing rising, descending trend, business result, profit or loss symbol symbol. Business arrow, goals concept. 3d world money symbols. Financial growth vector isolated. Increase decrease graph vectors Green up and red down 3d arrow graph showing rising, descending trend, business result, profit. world money symbols. Green up and red down 3d arrow graph showing rising, descending trend, business result, profit or loss symbol symbol. Business arrow, goals concept. 3d world money symbols. Financial growth vector isolated
Free with trial Green up and red down 3d arrow graph showing rising, descending trend, business result, profit or loss symbol symbol. Business arrow, goals concept. 3d world money symbols. Financial growth vector isolated. Increase decrease graph vectors Green up and red down 3d arrow graph showing rising, descending trend, business result, profit. world money symbols. Green up and red down 3d arrow graph showing rising, descending trend, business result, profit or loss symbol symbol. Business arrow, goals concept. 3d world money symbols. Financial growth vector isolated
Free with trial Green up and red down 3d arrow graph showing rising, descending trend, business result, profit or loss symbol symbol. Business arrow, goals concept. 3d world money symbols. Financial growth vector isolated. Increase decrease graph vectors Green up and red down 3d arrow graph showing rising, descending trend, business result, profit. world money symbols. Green up and red down 3d arrow graph showing rising, descending trend, business result, profit or loss symbol symbol. Business arrow, goals concept. 3d world money symbols. Financial growth vector isolated
Free with trial Green up and red down 3d arrow graph showing rising, descending trend, business result, profit or loss symbol symbol. Business arrow, goals concept. 3d world money symbols. Financial growth vector isolated. Increase decrease graph vectors Green up and red down 3d arrow graph showing rising, descending trend, business result, profit. world money symbols. Green up and red down 3d arrow graph showing rising, descending trend, business result, profit or loss symbol symbol. Business arrow, goals concept. 3d world money symbols. Financial growth vector isolated
Free with trial Green up and red down 3d arrow graph showing rising, descending trend, business result, profit or loss symbol symbol. Business arrow, goals concept. 3d world money symbols. Financial growth vector isolated. Increase decrease graph vectors Green up and red down 3d arrow graph showing rising, descending trend, business result, profit. world money symbols. Green up and red down 3d arrow graph showing rising, descending trend, business result, profit or loss symbol symbol. Business arrow, goals concept. 3d world money symbols. Financial growth vector isolated
Free with trial Green up and red down 3d arrow graph showing rising, descending trend, business result, profit or loss symbol symbol. Business arrow, goals concept. 3d world money symbols. Financial growth vector isolated. Increase decrease graph vectors Green up and red down 3d arrow graph showing rising, descending trend, business result, profit. world money symbols. Green up and red down 3d arrow graph showing rising, descending trend, business result, profit or loss symbol symbol. Business arrow, goals concept. 3d world money symbols. Financial growth vector isolated
Free with trial Global financial investment, Financial data Information for Trading and business investment, Stock market with candlestick on background. Business stock market visualization? Pie chart and graphs? Growth graph business inves background. Generative AI. Increase decrease graph illustrations Business graph of income growth, timeline, arrows indicate the direction of the graph. Global financial investment, Financial data Information for Trading and business investment, Stock market with candlestick on background. Business stock market visualization ? Pie chart and graphs ? Growth graph business inves background. Generative AI
Free with trial Set Mountains with flag Financial growth decrease Dollar symbol Pie chart infographic Intersection point Arrow and icon. Vector. Increase decrease graph illustrations Set Mountains with flag, Financial growth decrease, Dollar symbol, Pie chart infographic, Intersection point, Arrow, and. Set Mountains with flag Financial growth decrease Dollar symbol Pie chart infographic Intersection point Arrow and icon. Vector.
Free with trial Green up and red down 3d arrow graph showing rising, descending trend, business result, profit or loss symbol symbol. Business arrow, goals concept. 3d world money symbols. Financial growth. Increase decrease graph illustrations Green up and red down 3d arrow graph showing rising, descending trend, business result, 3d world money symbols. Financial growth. Green up and red down 3d arrow graph showing rising, descending trend, business result, profit or loss symbol symbol. Business arrow, goals concept. 3d world money symbols. Financial growth
Free with trial Green up and red down 3d arrow graph showing rising, descending trend, business result, profit or loss symbol symbol. Business arrow, goals concept. 3d world money symbols. Financial growth. Increase decrease graph illustrations Green up and red down 3d arrow graph showing rising, descending trend, business result, 3d world money symbols. Financial growth. Green up and red down 3d arrow graph showing rising, descending trend, business result, profit or loss symbol symbol. Business arrow, goals concept. 3d world money symbols. Financial growth
Free with trial Green up and red down 3d arrow graph showing rising, descending trend, business result, profit or loss symbol symbol. Business arrow, goals concept. 3d world money symbols. Financial growth. Increase decrease graph illustrations Green up and red down 3d arrow graph showing rising, descending trend, business result, 3d world money symbols. Financial growth. Green up and red down 3d arrow graph showing rising, descending trend, business result, profit or loss symbol symbol. Business arrow, goals concept. 3d world money symbols. Financial growth
Free with trial 2026. Decrease chart. Red color. 3d illustration. Increase decrease graph illustrations 2026. Decrease chart. Red color.
Free with trial Law of diminishing returns. E. g. if you continually increase the amount of work on a constant arable land, the soil yield increases quickly, slows down, shortly remains the same, and decreases again. Increase decrease graph vectors Law of diminishing returns, curve of output against input. Law of diminishing returns. E.g. if you continually increase the amount of work on a constant arable land, the soil yield increases quickly, slows down, shortly remains the same, and decreases again.
Free with trial A person meticulously studies complex financial or historical data displayed on a paper chart. The brass-rimmed magnifying glass highlights crucial upticks and downward trends in the graph line. Rendered by Ai. This scene captures the essence of deep research, analysis, and discovery in a vintage setting. Increase decrease graph illustrations Magnifying glass focused on a detailed stock chart. A person meticulously studies complex financial or historical data displayed on a paper chart. The brass-rimmed magnifying glass highlights crucial upticks and downward trends in the graph line. Rendered by Ai. This scene captures the essence of deep research, analysis, and discovery in a vintage setting
Free with trial Consumer purchasing power and consumption down color line icon, vector economic crisis and inflation. Finance and business recession, bankruptcy outline symbol with shopping cart and down arrow graph. Increase decrease graph vectors Consumer purchasing power down color line icon. Consumer purchasing power and consumption down color line icon, vector economic crisis and inflation. Finance and business recession, bankruptcy outline symbol with shopping cart and down arrow graph
Free with trial A clean, flat design set of icons showing upward and downward arrows and a bar graph, perfect for illustrating financial trends, data, or concepts. Increase decrease graph vectors Green up arrow, red down arrow, and bar chart. A clean, flat design set of icons showing upward and downward arrows and a bar graph, perfect for illustrating financial trends, data, or concepts
Free with trial A professional collection of 16 business and financial icons featuring various bar charts and line graphs. Perfect for UI dashboards, corporate presentations, and data-heavy infographics showing market growth or decline. Increase decrease graph vectors Business Growth Bar Charts and Financial Trend Line Graph Vector Icons Set. A professional collection of 16 business and financial icons featuring various bar charts and line graphs. Perfect for UI dashboards, corporate presentations, and data-heavy infographics showing market growth or decline.
Free with trial A professional collection of 16 business and financial icons featuring various bar charts and line graphs. Perfect for UI dashboards, corporate presentations, and data-heavy infographics showing market growth or decline. Increase decrease graph vectors Business Growth Bar Charts and Financial Trend Line Graph Vector Icons Set. A professional collection of 16 business and financial icons featuring various bar charts and line graphs. Perfect for UI dashboards, corporate presentations, and data-heavy infographics showing market growth or decline.
Free with trial A flat illustration of business graphs and charts showing analysis results. Featuring clean design and vibrant color scheme. Increase decrease graph vectors Colorful business graph and chart flat style design. A flat illustration of business graphs and charts showing analysis results. Featuring clean design and vibrant color scheme.
Free with trial Iconic green arrow graph rising, symbolizing growth and success, contrasted with a red arrow graph falling, representing decline. Flat design graphic. Increase decrease graph vectors Jagged arrows indicating fluctuating market trends. Iconic green arrow graph rising, symbolizing growth and success, contrasted with a red arrow graph falling, representing decline. Flat design graphic
Free with trial Abstract bull and bear market graph. Increase decrease graph illustrations Bull and Bear Neon Silhouettes on Stock Market Data Chart Background. Abstract bull and bear market graph
Free with trial A set of currency growth and decline icons featuring stacks of coins and directional arrows, indicating financial increases and decreases. concepts of economic growth, losses and currency fluctuations. Increase decrease graph vectors Money Growth and Decrease Icons with Coins and Up Down Arrows. A set of currency growth and decline icons featuring stacks of coins and directional arrows, indicating financial increases and decreases. concepts of economic growth, losses and currency fluctuations
Free with trial Two simple icons representing financial market performance, one showing a downward trend and the other an upward trend, both with dollar symbols. Increase decrease graph vectors Financial graph icons showing market trends up and down. Two simple icons representing financial market performance, one showing a downward trend and the other an upward trend, both with dollar symbols
Free with trial Isometric banner template showing inflation concept. Vector illustration of financial crisis, rising prices, and money value decrease. Data analysis report with charts and upward arrow for web design. Increase decrease graph vectors Inflation And Economic Crisis Data Analysis Isometric Banner Template Vector Illustration. Isometric banner template showing inflation concept. Vector illustration of financial crisis, rising prices, and money value decrease. Data analysis report with charts and upward arrow for web design
Free with trial A professional businessman analyzes private equity portfolio management data on a large screen, evaluating ebitda growth, revenue increase, and cost optimization charts while taking notes. Increase decrease graph vectors Man Analyzing Financial Charts for Private Equity Portfolio. A professional businessman analyzes private equity portfolio management data on a large screen, evaluating ebitda growth, revenue increase, and cost optimization charts while taking notes
Free with trial Abstract green line graph on black background. Stock photo of financial chart. Increase decrease graph illustrations Vibrant Green Lightning Bolt on Black Background, Electric Energy Discharge. Abstract green line graph on black background. Stock photo of financial chart
Free with trial Icon style image shows magnifying glass over finance data. Clean aesthetic with a black background and light colors. Increase decrease graph vectors Financial analysis magnifying glass looking at data bar graph. Icon style image shows magnifying glass over finance data. Clean aesthetic with a black background and light colors.
Free with trial An abstract visual representation of data, featuring a vibrant red bar chart resembling a cityscape or sound wave, overlaid with a line graph and connecting dots. This dynamic graphic is ideal for concepts related to financial analysis, business intelligence, or data visualization. Increase decrease graph illustrations Red Abstract Bar Chart Waveform with Connecting Dots and Lines - Data Analysis. An abstract visual representation of data, featuring a vibrant red bar chart resembling a cityscape or sound wave, overlaid with a line graph and connecting dots. This dynamic graphic is ideal for concepts related to financial analysis, business intelligence, or data visualization.
Free with trial Data trends. Data with arrows indicating increase and decrease, growth chart, and audio waveform. Data trends highlight growth, performance tracking, and communication analysis. Suitable. Increase decrease graph illustrations Data Trends and Analysis with Arrows, Graph, and Audio Waveform Communication Metrics. Data trends. Data with arrows indicating increase and decrease, growth chart, and audio waveform. Data trends highlight growth, performance tracking, and communication analysis. Suitable
Free with trial Bar graph with an upward trend, blue downward arrow, and percentage sign. Ideal for business analysis, finance, growth, decline trends, statistics economics comparison. Flat simple metaphor. Increase decrease graph vectors Financial chart with growth trend, declining arrow, and percentage symbol representing data analysis. Bar graph with an upward trend, blue downward arrow, and percentage sign. Ideal for business analysis, finance, growth, decline trends, statistics economics comparison. Flat simple metaphor
Free with trial A logo for a data visualization service, a simple chart bar forming a sharp, singular peak, vector graphic design on a white background, simple minimalistic style, flat color, sunflower yellow color palette, vector graphics, vector illustration, logo, professional logo, logo design, high-quality graphic designer work, logo icon --chaos 30 --ar 16:9 --v 7 Job ID: a54fbe77-4416-47fc-b767-. Increase decrease graph illustrations Yellow Waveform Graph on White Background, Representing Data, Analytics, or Sound. a logo for a data visualization service, a simple chart bar forming a sharp, singular peak, vector graphic design on a white background, simple minimalistic style, flat color, sunflower yellow color palette, vector graphics, vector illustration, logo, professional logo, logo design, high-quality graphic designer work, logo icon --chaos 30 --ar 16:9 --v 7 Job ID: a54fbe77-4416-47fc-b767-
Free with trial Twelve small line graphs showcase diverse data trends, illustrating increases, decreases, peaks, and valleys. Visual representation of business analytics. Increase decrease graph illustrations Various Line Graph Charts Data Visualization Business Analytics. Twelve small line graphs showcase diverse data trends, illustrating increases, decreases, peaks, and valleys. Visual representation of business analytics
Free with trial A collection of five distinct black and white graphic representations of data. From left to right, the first is a line graph with dots, showing fluctuations. The second is a zig-zag line graph with dots and an upward arrow. The third is a series of ascending vertical bars. The fourth is a bar chart with a single dot above one of the bars. The fifth is a pie chart divided into four sections, with. Increase decrease graph vectors Collection of black and white business and data charts and graphs statistics analytics. A collection of five distinct black and white graphic representations of data. From left to right, the first is a line graph with dots, showing fluctuations. The second is a zig-zag line graph with dots and an upward arrow. The third is a series of ascending vertical bars. The fourth is a bar chart with a single dot above one of the bars. The fifth is a pie chart divided into four sections, with
Free with trial A vibrant collection of flat design charts, including a bar graph and two pie charts, presented together to visualize data and trends effectively on a clean white background. Increase decrease graph vectors Illustration of colorful bar and pie charts isolated on white background. A vibrant collection of flat design charts, including a bar graph and two pie charts, presented together to visualize data and trends effectively on a clean white background
Free with trial This abstract illustration depicts the dynamic nature of financial markets, showcasing both significant volatility and an overall upward growth trend. A prominent red line graph indicates positive development, while underlying grey jagged lines and vertical bars represent frequent fluctuations and market uncertainty. To the right, orange up and down arrows symbolize the opposing forces and constant changes within the market. This visual is ideal for conveying concepts related to stock market performance, economic indicators, investment risks, and business analysis. Increase decrease graph vectors Financial Market Volatility and Growth Trend. This abstract illustration depicts the dynamic nature of financial markets, showcasing both significant volatility and an overall upward growth trend. A prominent red line graph indicates positive development, while underlying grey jagged lines and vertical bars represent frequent fluctuations and market uncertainty. To the right, orange up and down arrows symbolize the opposing forces and constant changes within the market. This visual is ideal for conveying concepts related to stock market performance, economic indicators, investment risks, and business analysis.
Free with trial Business charts, data visualization, financial analysis, progress tracking, statistics, graphs, analysis, charts bar in line, orange. Increase decrease graph vectors Collection of diverse orange bar charts and line graph against a white background. Business charts, data visualization, financial analysis, progress tracking. Business charts, data visualization, financial analysis, progress tracking, statistics, graphs, analysis, charts bar in line, orange
Free with trial A person in a suit uses a pen and tablet with a holographic house overlayed with graph data. The blue hue gives a futuristic look. The data suggests the person is analyzing real estate trends and making financial decisions or predictions. The image was generated by AI. Increase decrease graph illustrations Real Estate Analytics. A person in a suit uses a pen and tablet with a holographic house overlayed with graph data. The blue hue gives a futuristic look. The data suggests the person is analyzing real estate trends and making financial decisions or predictions. The image was generated by AI.
Free with trial The image displays two bar graphs representing the stock market activities of buying and selling. The left graph, labeled 'BUY', shows a pyramid structure with increasing bars from bottom to top, indicating a rise in buying activities. The right graph, labeled 'SELL', shows a pyramid structure with decreasing bars from top to bottom, indicating a rise in selling activities. Increase decrease graph illustrations Stock market buy and sell graphs. The image displays two bar graphs representing the stock market activities of buying and selling. The left graph, labeled 'BUY', shows a pyramid structure with increasing bars from bottom to top, indicating a rise in buying activities. The right graph, labeled 'SELL', shows a pyramid structure with decreasing bars from top to bottom, indicating a rise in selling activities
Free with trial A 3D rendered image of a simple bar chart featuring two rounded vertical columns, one red and one blue, standing on a dark gray oval base. The blue column is taller than the red one, suggesting a comparison or growth. The objects are set against a clean, light gray background with subtle shadows, highlighting their form and isolation. Increase decrease graph illustrations 3D Rendered Bar Chart with Red and Blue Columns on a Gray Base graph data. A 3D rendered image of a simple bar chart featuring two rounded vertical columns, one red and one blue, standing on a dark gray oval base. The blue column is taller than the red one, suggesting a comparison or growth. The objects are set against a clean, light gray background with subtle shadows, highlighting their form and isolation
Free with trial A comprehensive collection of flat line design icons representing key concepts in business, finance, and data analytics. The set includes various charts (bar, line, pie), a speedometer, a magnifying glass with a graph, financial documents with checkmarks, a target with an arrow, a dollar sign, a percentage symbol, and directional arrows for growth and decline. These versatile vector elements are ideal for presentations, reports, websites, and applications focused on statistics, performance, strategy, and financial insights. Increase decrease graph illustrations Business and Data Analytics Flat Line Icons Set. A comprehensive collection of flat line design icons representing key concepts in business, finance, and data analytics. The set includes various charts (bar, line, pie), a speedometer, a magnifying glass with a graph, financial documents with checkmarks, a target with an arrow, a dollar sign, a percentage symbol, and directional arrows for growth and decline. These versatile vector elements are ideal for presentations, reports, websites, and applications focused on statistics, performance, strategy, and financial insights.
Free with trial A hand interacts with a tablet displaying a graph showing quality increasing and cost decreasing, symbolizing business improvement and efficiency. Increase decrease graph illustrations Quality Up, Cost Down: Business Analysis on Tablet. A hand interacts with a tablet displaying a graph showing quality increasing and cost decreasing, symbolizing business improvement and efficiency
Free with trial A 3D render depicts a series of translucent blue glass bars arranged in ascending order, representing a bar chart. A large, sharp blue glass arrow points downwards, diagonally crossing the bars and indicating a sharp decline or negative trend. The composition is set against a light gray, subtly textured background, emphasizing the abstract and conceptual nature of the graphic. Increase decrease graph illustrations Blue Glass Bar Chart with Downward Arrow Symbolizing Financial Decline graph. A 3D render depicts a series of translucent blue glass bars arranged in ascending order, representing a bar chart. A large, sharp blue glass arrow points downwards, diagonally crossing the bars and indicating a sharp decline or negative trend. The composition is set against a light gray, subtly textured background, emphasizing the abstract and conceptual nature of the graphic
Free with trial A shiny golden arrow forms a path that initially moves upward, then dips down, and finally turns upward again, presented in a 3D render against a clean white background. This abstract representation symbolizes financial growth, market fluctuations, and business progress. Increase decrease graph illustrations Golden Arrow Graph Showing Upward Trend and Downturn on White Background chart. A shiny golden arrow forms a path that initially moves upward, then dips down, and finally turns upward again, presented in a 3D render against a clean white background. This abstract representation symbolizes financial growth, market fluctuations, and business progress
Free with trial Graphic bar chart illustrating business data analysis, financial statistics, and market trends with both positive growth and negative decline on a clean white background. Increase decrease graph vectors Business financial graph showing increase and decrease. Graphic bar chart illustrating business data analysis, financial statistics, and market trends with both positive growth and negative decline on a clean white background
Free with trial Visualization melting line chart illustration trend graph, temperature plot, axis series visualization melting line chart. Increase decrease graph illustrations Visualization melting line chart
Free with trial This graphic depicts supply and demand curves balanced by a scale, illustrating economic principles and market equilibrium. It's suitable for business presentations and educational materials. Increase decrease graph vectors Supply and demand graph with balance scale illustration. This graphic depicts supply and demand curves balanced by a scale, illustrating economic principles and market equilibrium. It's suitable for business presentations and educational materials
Free with trial A simple hand-drawn illustration of a bar chart or graph. The chart is rendered in black lines on a white background, with the lower portions of the bars filled with diagonal hatching. This image can be used to represent data, statistics, growth, progress, or analysis in a visually appealing and informal way. Suitable for presentations, reports, or website graphics. Increase decrease graph illustrations Hand-Drawn Bar Chart Illustration. A simple hand-drawn illustration of a bar chart or graph. The chart is rendered in black lines on a white background, with the lower portions of the bars filled with diagonal hatching. This image can be used to represent data, statistics, growth, progress, or analysis in a visually appealing and informal way. Suitable for presentations, reports, or website graphics.
Free with trial A dynamic digital illustration of a financial chart on a dark, high-tech background. The image features two contrasting lines: a vibrant green line trending upwards with an arrow, symbolizing growth, profit, and success, and a blue line moving downwards with an arrow, representing decline, loss, and risk. Glowing data points and a network grid enhance the futuristic feel. This versatile graphic is perfect for concepts related to stock market analysis, business performance, investment volatility, economic forecasting, big data, and financial technology (fintech). Increase decrease graph illustrations Futuristic Financial Graph with Growth and Decline Arrows. A dynamic digital illustration of a financial chart on a dark, high-tech background. The image features two contrasting lines: a vibrant green line trending upwards with an arrow, symbolizing growth, profit, and success, and a blue line moving downwards with an arrow, representing decline, loss, and risk. Glowing data points and a network grid enhance the futuristic feel. This versatile graphic is perfect for concepts related to stock market analysis, business performance, investment volatility, economic forecasting, big data, and financial technology (fintech).
Free with trial A financial report document lies flat on a white surface, displaying the text "FINANCIAL REPORT". Rising from the document are several translucent 3D bars in shades of purple, blue, and green, arranged in ascending order. To the right of the bars is a colorful 3D pie chart with segments in yellow, red, orange, and blue. Increase decrease graph illustrations Financial Report with 3D Bar Graph and Pie Chart on White Background document paper. A financial report document lies flat on a white surface, displaying the text "FINANCIAL REPORT". Rising from the document are several translucent 3D bars in shades of purple, blue, and green, arranged in ascending order. To the right of the bars is a colorful 3D pie chart with segments in yellow, red, orange, and blue
Free with trial A collection of eight thin-line related to finance and business. The depict a stack of coins with a dollar sign, a document with a dollar sign, an upward trending graph over city buildings, and a bar chart with a plus sign. The bottom row coins and currency symbols, a calculator with a dollar sign, a document with a calculator and charts, and a person. Increase decrease graph illustrations Financial set with charts and calculator finance business. A collection of eight thin-line related to finance and business. The depict a stack of coins with a dollar sign, a document with a dollar sign, an upward trending graph over city buildings, and a bar chart with a plus sign. The bottom row coins and currency symbols, a calculator with a dollar sign, a document with a calculator and charts, and a person
Free with trial A simple black and red bar chart displays data with varying heights on a white background. Increase decrease graph illustrations Simple Bar Chart with One Red Bar on White Background graph data. A simple black and red bar chart displays data with varying heights on a white background
Free with trial Collection of simple black vector icons representing financial charts, data analysis graphs, and business statistics. Includes trend arrows, magnifier, and settings symbols. Increase decrease graph vectors Set of black business graph and chart icons for data analysis. Collection of simple black vector icons representing financial charts, data analysis graphs, and business statistics. Includes trend arrows, magnifier, and settings symbols
Free with trial This image illustrates a bar graph showing an upward trend in financial growth, accompanied by a line graph depicting market fluctuations over time. Increase decrease graph illustrations Graphical representation of financial growth and fluctuation. This image illustrates a bar graph showing an upward trend in financial growth, accompanied by a line graph depicting market fluctuations over time
Free with trial A businessman wearing a suit analyzes cost reduction versus quality improvement He uses both a laptop and a tablet computer to look at the data and see how these two factors interact to produce the best result for his company and business dealings shown with a graph of numbers going up and down. Increase decrease graph illustrations Cost reduction and quality improvement shown with businessman analyzing data on devices. A businessman wearing a suit analyzes cost reduction versus quality improvement He uses both a laptop and a tablet computer to look at the data and see how these two factors interact to produce the best result for his company and business dealings shown with a graph of numbers going up and down
Free with trial This image shows a simple line graph with increasing and decreasing trends, ideal for visualizing data analysis and presenting key findings. The graph uses a clean, minimalist design to highlight the data points and overall trend. Perfect for presentations and reports. Increase decrease graph illustrations Analyze Your Data. This image shows a simple line graph with increasing and decreasing trends, ideal for visualizing data analysis and presenting key findings. The graph uses a clean, minimalist design to highlight the data points and overall trend. Perfect for presentations and reports.
Free with trial Two blue bar graphs are depicted against a white background. The left graph bars increasing in height with an upward curving arrow, indicating growth. The right graph bars decreasing in height. Increase decrease graph vectors Blue bar graphs showing upward and downward trends with arrows. Two blue bar graphs are depicted against a white background. The left graph bars increasing in height with an upward curving arrow, indicating growth. The right graph bars decreasing in height
Free with trial A circular icon containing a stylized representation of financial data. The icon features a series of black vertical bars of varying heights, suggesting a bar chart. Overlaid on the bars are two thin lines, one black and one grey, depicting line graphs with peaks and troughs, indicating fluctuating trends. The overall design is minimalist and symbolic, suitable for representing business analytics. Increase decrease graph illustrations Circular Graph Icon with Bar and Line Charts Representing Financial Data and Trends business. A circular icon containing a stylized representation of financial data. The icon features a series of black vertical bars of varying heights, suggesting a bar chart. Overlaid on the bars are two thin lines, one black and one grey, depicting line graphs with peaks and troughs, indicating fluctuating trends. The overall design is minimalist and symbolic, suitable for representing business analytics
Free with trial A flat design vector illustration depicting a financial market data board or stock ticker. The black-bordered display features various stock symbols, numerical values like '$ ,80K', '$ ,22,50', and indicators of market performance. Prominently highlighted in red is the word 'LOSING', accompanied by a red downward arrow signifying a price drop, and a red downward triangle. Conversely, a green upward arrow indicates a price increase. This icon effectively visualizes concepts of financial loss, gain, market volatility, and investment trends, suitable for business, finance, and economic content. Increase decrease graph illustrations Financial Market Data Board Icon with Loss and Gain Indicators. A flat design vector illustration depicting a financial market data board or stock ticker. The black-bordered display features various stock symbols, numerical values like '$ ,80K', '$ ,22,50', and indicators of market performance. Prominently highlighted in red is the word 'LOSING', accompanied by a red downward arrow signifying a price drop, and a red downward triangle. Conversely, a green upward arrow indicates a price increase. This icon effectively visualizes concepts of financial loss, gain, market volatility, and investment trends, suitable for business, finance, and economic content.
Free with trial An artistic creation that reflects beauty in simplicity. The design highlights precision, clean details, and a harmonious flow, resulting in a versatile and professional visual outcome. Increase decrease graph vectors Business lion Presenting bar graph chart. An artistic creation that reflects beauty in simplicity. The design highlights precision, clean details, and a harmonious flow, resulting in a versatile and professional visual outcome
Free with trial This image features two bar graphs isolated on a white background. The left graph, labeled 'PROFIT,' shows increasing bars indicating rising profit levels. The right graph, labeled 'LOSS,' displays decreasing bars, illustrating increasing loss levels. The image is clear, concise, and SEO-friendly, highlighting financial concepts. Increase decrease graph illustrations Profit and loss graphs isolated on white background. This image features two bar graphs isolated on a white background. The left graph, labeled 'PROFIT,' shows increasing bars indicating rising profit levels. The right graph, labeled 'LOSS,' displays decreasing bars, illustrating increasing loss levels. The image is clear, concise, and SEO-friendly, highlighting financial concepts
Free with trial A set of simple and clean line art icons representing various financial and business concepts, including growth, decrease, profit, and loss. These icons are suitable for use in presentations, websites, and mobile applications. Increase decrease graph vectors Simple Line Art Financial Chart Symbol Icon Set for Business Concept. A set of simple and clean line art icons representing various financial and business concepts, including growth, decrease, profit, and loss. These icons are suitable for use in presentations, websites, and mobile applications.
Free with trial A flat depicting two distinct financial charts against a white background. The left chart a bar graph with bars in shades of green and blue, topped by a jagged blue line graph ascending towards a green percentage symbol and an upward arrow. The right chart a bar graph with bars in yellow, orange, and red, with a red line graph descending from a yellow dollar sign. Increase decrease graph illustrations Upward and downward financial charts with percentage and dollar symbols. A flat depicting two distinct financial charts against a white background. The left chart a bar graph with bars in shades of green and blue, topped by a jagged blue line graph ascending towards a green percentage symbol and an upward arrow. The right chart a bar graph with bars in yellow, orange, and red, with a red line graph descending from a yellow dollar sign
Free with trial Two distinct bar charts are depicted against a white background. The left chart a downward trend with bars in blue, yellow, and purple, accompanied by a yellow coin with a dollar sign and an arrow pointing down towards it from a small graph indicating a rising trend. The right chart an upward trend with bars in red, green, and blue, and a green coin with a dollar sign connected to a circle with a. Increase decrease graph illustrations Bar charts showing financial growth and decline with dollar symbols. Two distinct bar charts are depicted against a white background. The left chart a downward trend with bars in blue, yellow, and purple, accompanied by a yellow coin with a dollar sign and an arrow pointing down towards it from a small graph indicating a rising trend. The right chart an upward trend with bars in red, green, and blue, and a green coin with a dollar sign connected to a circle with a
Free with trial Four simple bar chart are displayed against a white background. Two are solid black, one showing an upward trend with an arrow, and the other a downward trend with an arrow. The remaining two. Increase decrease graph vectors Four bar chart showing upward and downward trends graph. Four simple bar chart are displayed against a white background. Two are solid black, one showing an upward trend with an arrow, and the other a downward trend with an arrow. The remaining two
Free with trial This image depicts a visual representation of financial or business growth and decline using a series of ascending and descending three-dimensional bar charts, where the left side shows smaller bars gradually increasing in height, transitioning through a central flat bar, and shifting to taller bars on the right side that progressively decrease, all set against a plain white background to. Increase decrease graph illustrations Growth and progress concept with ascending and descending bar charts illustrating business success and financial improvement over. This image depicts a visual representation of financial or business growth and decline using a series of ascending and descending three-dimensional bar charts, where the left side shows smaller bars gradually increasing in height, transitioning through a central flat bar, and shifting to taller bars on the right side that progressively decrease, all set against a plain white background to
Free with trial Crisis inflation causes increase in expenses for man walking along increasing negative schedule. Financial recession and inflation cause depression in bankrupt businessman in need of help. Increase decrease graph vectors Crisis inflation causes increase in expenses for man walking along increasing negative schedule
Free with trial Stylized data illustrates financial increase using dollar signs, bar graphs, and arrows. Some data trends down while other data trends up, showing potential profits and losses. Increase decrease graph illustrations Stock Market Data Shows Economic Growth and Potential Loss in the Future. Stylized data illustrates financial increase using dollar signs, bar graphs, and arrows. Some data trends down while other data trends up, showing potential profits and losses.