Free with trial Stock market. The rise and fall of securities. Successful trading. Market trend up green and red down arrows, financial graphs. Business investment growth and loss arrow. Graph going up and down symbol vector illustration. Increase decrease graph vectors Stock market. The rise and fall of securities. Successful trading. Market trend up green and red down arrows, financial graphs.
Free with trial This image presents a clean, minimalist graphic illustrating economic trends. It features two distinct charts: a line graph on the left showing fluctuating data points over time, and a bar chart on the right comparing values across categories. The charts use a simple black and white color scheme with grayscale elements, making them versatile for various business and financial contexts. Labels like 'ECONOMIC', 'PARCTIRUM', and 'PLACTIRUM' suggest analysis of economic performance and market data. The overall design emphasizes clarity and data visualization. Increase decrease graph vectors Economic Growth Trends: Line and Bar Charts. This image presents a clean, minimalist graphic illustrating economic trends. It features two distinct charts: a line graph on the left showing fluctuating data points over time, and a bar chart on the right comparing values across categories. The charts use a simple black and white color scheme with grayscale elements, making them versatile for various business and financial contexts. Labels like 'ECONOMIC', 'PARCTIRUM', and 'PLACTIRUM' suggest analysis of economic performance and market data. The overall design emphasizes clarity and data visualization.
Free with trial A collection of six black depicting various business analytics charts and graphs, including bar charts, a pie chart, and line graphs on presentation boards. Increase decrease graph vectors Black analytics chart and graph on white background. A collection of six black depicting various business analytics charts and graphs, including bar charts, a pie chart, and line graphs on presentation boards
Free with trial Stock market. The rise and fall of securities. Successful trading. Market trend up green and red down arrows, financial graphs. Business investment growth and loss arrow. Graph going up and down symbol vector illustration. Increase decrease graph vectors Stock market. The rise and fall of securities. Successful trading. Market trend up green and red down arrows, financial graphs.
Free with trial Stock market. The rise and fall of securities. Successful trading. Market trend up green and red down arrows, financial graphs. Business investment growth and loss arrow. Graph going up and down symbol vector illustration. Increase decrease graph vectors Stock market. The rise and fall of securities. Successful trading. Market trend up green and red down arrows, financial graphs.
Free with trial Stock market. The rise and fall of securities. Successful trading. Market trend up green and red down arrows, financial graphs. Business investment growth and loss arrow. Graph going up and down symbol vector illustration. Increase decrease graph vectors Stock market. The rise and fall of securities. Successful trading. Market trend up green and red down arrows, financial graphs.
Free with trial Stock market. The rise and fall of securities. Successful trading. Market trend up green and red down arrows, financial graphs. Business investment growth and loss arrow. Graph going up and down symbol vector illustration. Increase decrease graph vectors Stock market. The rise and fall of securities. Successful trading. Market trend up green and red down arrows, financial graphs.
Free with trial Stock market. The rise and fall of securities. Successful trading. Market trend up green and red down arrows, financial graphs. Business investment growth and loss arrow. Graph going up and down symbol vector illustration. Increase decrease graph vectors Stock market. The rise and fall of securities. Successful trading. Market trend up green and red down arrows, financial graphs.
Free with trial Two cardboard houses, one larger than the other, depict percentage increases in house prices, generated by AI. This visualization effectively communicates the impact of fluctuating real estate market values. Increase decrease graph illustrations House Price Percentage Increase. Two cardboard houses, one larger than the other, depict percentage increases in house prices, generated by AI. This visualization effectively communicates the impact of fluctuating real estate market values.
Free with trial Set of six black business charts icons showing growth and decline trends with arrows and bars in vector style clear and simple design calm. Generative AI. Increase decrease graph vectors Business growth and decline charts arrows statistics bar graph icons vector illustration. Set of six black business charts icons showing growth and decline trends with arrows and bars in vector style clear and simple design calm. Generative AI
Free with trial A blue bar and line graph showing upward financial trends against a backdrop of a world map, symbolizing global economic growth and market expansion. Increase decrease graph illustrations Global business growth chart with world map background. A blue bar and line graph showing upward financial trends against a backdrop of a world map, symbolizing global economic growth and market expansion
Free with trial A simple black silhouette of a bar chart with varying heights on a white background. The icon represents data analysis and statistical representation. Increase decrease graph vectors Bar chart icon for data analysis and statistics graph. A simple black silhouette of a bar chart with varying heights on a white background. The icon represents data analysis and statistical representation
Free with trial A conceptual illustration of market analysis featuring a bar chart, magnifying glass, upward and downward arrows, and business icons on white. Increase decrease graph illustrations Market Analysis Concept with Bar Chart Magnifying Glass and Upward Arrow graph. A conceptual illustration of market analysis featuring a bar chart, magnifying glass, upward and downward arrows, and business icons on white
Free with trial A dynamic 3D visualization showcasing financial data. The scene features a rising bar chart with an upward trend arrow, symbolizing growth and success. Adjacent to it, a colorful pie chart represents data segmentation and distribution. The background is a dark, textured surface with subtle grid lines and abstract chart elements, creating a sophisticated and modern aesthetic. This imagery is ideal for presentations, reports, and digital content related to finance, business, economics, and data analysis. Increase decrease graph illustrations 3D Financial Data Visualization: Growth Charts and Pie Graph. A dynamic 3D visualization showcasing financial data. The scene features a rising bar chart with an upward trend arrow, symbolizing growth and success. Adjacent to it, a colorful pie chart represents data segmentation and distribution. The background is a dark, textured surface with subtle grid lines and abstract chart elements, creating a sophisticated and modern aesthetic. This imagery is ideal for presentations, reports, and digital content related to finance, business, economics, and data analysis.
Free with trial This image showcases a comprehensive collection of blue bar graphs and line graphs, presented in a grid format. Each graph depicts various data trends, including upward and downward movements, fluctuating patterns, and steady growth. The clean, modern design makes these icons ideal for representing financial data, market analysis, performance metrics, and business growth in presentations, reports, and websites. Increase decrease graph illustrations Collection of Blue Bar and Line Graphs for Business Analytics. This image showcases a comprehensive collection of blue bar graphs and line graphs, presented in a grid format. Each graph depicts various data trends, including upward and downward movements, fluctuating patterns, and steady growth. The clean, modern design makes these icons ideal for representing financial data, market analysis, performance metrics, and business growth in presentations, reports, and websites.
Free with trial A black silhouette of a bar chart with a vertical scale and grid lines, representing data analysis. Increase decrease graph illustrations Black bar chart icon with grid lines and scale on white background graph statistics. A black silhouette of a bar chart with a vertical scale and grid lines, representing data analysis
Free with trial A clean and modern digital illustration of a financial candlestick chart, displaying market trends and stock performance. The graph features blue candlesticks indicating price movements over time, accompanied by a solid blue line graph and subtle dashed trend lines. Set against a crisp white background with a clear grid, this visualization is ideal for illustrating concepts related to finance, investment, business analytics, economic forecasts, and data reporting. It conveys growth, volatility, and strategic decision-making in the stock market. Increase decrease graph illustrations Financial Candlestick Chart with Trend Line on White Background. A clean and modern digital illustration of a financial candlestick chart, displaying market trends and stock performance. The graph features blue candlesticks indicating price movements over time, accompanied by a solid blue line graph and subtle dashed trend lines. Set against a crisp white background with a clear grid, this visualization is ideal for illustrating concepts related to finance, investment, business analytics, economic forecasts, and data reporting. It conveys growth, volatility, and strategic decision-making in the stock market.
Free with trial Several rows of hand drawn style arrows point upwards and downwards. The arrows are red, yellow, blue, turquoise, and green. They are on a white background with a grid pattern. Increase decrease graph illustrations Colorful up and Down Arrows on Graph Paper Showing Market Trends. Several rows of hand drawn style arrows point upwards and downwards. The arrows are red, yellow, blue, turquoise, and green. They are on a white background with a grid pattern.
Free with trial An isometric 3D bar chart composed of blue, gray, and orange blocks of varying heights is arranged on a white background. Increase decrease graph illustrations Isometric 3D bar chart with blue, gray, and orange blocks on a white background graph data. An isometric 3D bar chart composed of blue, gray, and orange blocks of varying heights is arranged on a white background
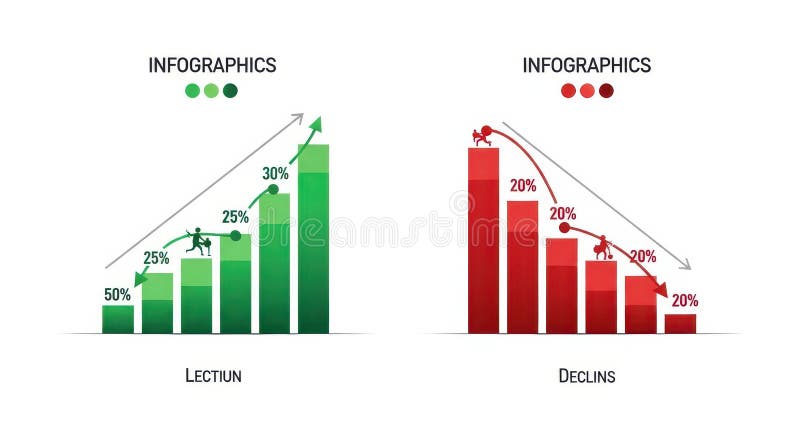
Free with trial The image displays two infographics side by side. the left infographic, titled "lection," depicts a green bar graph showing growth, starting at 50% and increasing to 30% with a figure climbing the bars. an upward-pointing arrow indicates positive growth. the right infographic, titled "declins," shows a red bar graph illustrating decline, starting at 20% and decreasing to 20% with a figure falling down the bars. a downward-pointing arrow indicates negative growth. Increase decrease graph illustrations Infographics showing growth and decline charts. the image displays two infographics side by side. the left infographic, titled "lection," depicts a green bar graph showing growth, starting at 50% and increasing to 30% with a figure climbing the bars. an upward-pointing arrow indicates positive growth. the right infographic, titled "declins," shows a red bar graph illustrating decline, starting at 20% and decreasing to 20% with a figure falling down the bars. a downward-pointing arrow indicates negative growth.
Free with trial Several red, blue, and green arrows pointing in different directions are on a light yellow square grid. Some arrows point up, while others point down. This represents various economic trends. Increase decrease graph illustrations Colorful Painted Arrows Move up and Down on Graph Paper Background. Several red, blue, and green arrows pointing in different directions are on a light yellow square grid. Some arrows point up, while others point down. This represents various economic trends.
Free with trial This infographic-style image visually represents business growth and financial performance through various charts and graphs. A line graph illustrates revenue trends with percentage markers, a donut chart displays market share distribution, and a bar chart shows quarterly profit figures. Icons representing data, growth, and reports are subtly integrated into the background, creating a professional and informative visual for business and finance-related content. Increase decrease graph illustrations Business Growth and Financial Performance Analytics. This infographic-style image visually represents business growth and financial performance through various charts and graphs. A line graph illustrates revenue trends with percentage markers, a donut chart displays market share distribution, and a bar chart shows quarterly profit figures. Icons representing data, growth, and reports are subtly integrated into the background, creating a professional and informative visual for business and finance-related content.
Free with trial A stacked area chart performance data with distinct colored segments in a rainbow gradient. The vertical axis percentages from 0% to 170%, and the horizontal axis percentage values. Increase decrease graph illustrations Stacked area chart showing level performance with rainbow colors and percentage axis graph data. A stacked area chart performance data with distinct colored segments in a rainbow gradient. The vertical axis percentages from 0% to 170%, and the horizontal axis percentage values
Free with trial A businessman in a suit points to a check mark icon and declining graph illustrating cost reduction The visual presentation emphasizes decreasing costs to improve profits with a money bag symbolizing the potential financial gains from effective strategies and successful implementation. Increase decrease graph illustrations Cost reduction strategy presented by businessman demonstrating declining trend to increase profits. A businessman in a suit points to a check mark icon and declining graph illustrating cost reduction The visual presentation emphasizes decreasing costs to improve profits with a money bag symbolizing the potential financial gains from effective strategies and successful implementation
Free with trial 3d bar chart with orange and green bars on a blue grid background isolated on white. Increase decrease graph illustrations 3d bar chart with orange and green bars on blue grid background graph data. 3d bar chart with orange and green bars on a blue grid background isolated on white
Free with trial This 3D rendering showcases stacks of Bitcoin-like coins alongside a rising bar graph, illustrating cryptocurrency market growth. The image is generated by AI and ideal for illustrating financial concepts related to digital currencies. Increase decrease graph illustrations Cryptocurrency Growth Chart. This 3D rendering showcases stacks of Bitcoin-like coins alongside a rising bar graph, illustrating cryptocurrency market growth. The image is generated by AI and ideal for illustrating financial concepts related to digital currencies.
Free with trial Candlestick charts with red and green bars display a stock market or forex trading pattern. Each candlestick represents data for a specific time period, showing opening, closing, high, and low values. Red indicates a price decrease, while green signifies an increase. The chart analyzes investment trends and is used for financial decisions in business and trading. The background is dark blue, enhancing the visibility of the vibrant candlestick colors. Increase decrease graph illustrations Stock market chart forex trading candlestick pattern investment finance business graph analysis data trend. Candlestick charts with red and green bars display a stock market or forex trading pattern. Each candlestick represents data for a specific time period, showing opening, closing, high, and low values. Red indicates a price decrease, while green signifies an increase. The chart analyzes investment trends and is used for financial decisions in business and trading. The background is dark blue, enhancing the visibility of the vibrant candlestick colors.
Free with trial This vibrant 3D bar chart illustrates strong business growth and upward progress. The colorful, glossy bars represent data points, clearly showing an increase. Ideal for presentations and reports. Increase decrease graph illustrations Colorful 3D Bar Chart Showing Business Growth and Progress. This vibrant 3D bar chart illustrates strong business growth and upward progress. The colorful, glossy bars represent data points, clearly showing an increase. Ideal for presentations and reports.
Free with trial This vibrant image, generated by AI, depicts a cityscape with a dynamic graph illustrating growth and potential decline. The color transition symbolizes economic fluctuations, offering a visual representation of urban development and market trends. Increase decrease graph illustrations AI-Generated Cityscape Growth Chart. This vibrant image, generated by AI, depicts a cityscape with a dynamic graph illustrating growth and potential decline. The color transition symbolizes economic fluctuations, offering a visual representation of urban development and market trends.
Free with trial Visual representation of financial trends with euro symbols, depicting both upward and downward movements in bar graph format, suitable for economic analysis. Increase decrease graph vectors Bar charts showing euro currency growth and decline isolated on transparent background. Visual representation of financial trends with euro symbols, depicting both upward and downward movements in bar graph format, suitable for economic analysis
Free with trial A conceptual vector illustration depicting the duality of business performance. On a modern teal background, two reports are shown side-by-side. One features a rising red graph symbolizing growth, profit, and success, while the other displays a descending graph representing decline, loss, and failure. This flat design graphic is ideal for financial analysis, market trend comparisons, business presentations, and infographics illustrating opposite outcomes or strategic choices. The long shadow effect adds a contemporary feel to the design. Increase decrease graph vectors Growth and Decline Business Charts Comparison. A conceptual vector illustration depicting the duality of business performance. On a modern teal background, two reports are shown side-by-side. One features a rising red graph symbolizing growth, profit, and success, while the other displays a descending graph representing decline, loss, and failure. This flat design graphic is ideal for financial analysis, market trend comparisons, business presentations, and infographics illustrating opposite outcomes or strategic choices. The long shadow effect adds a contemporary feel to the design.
Free with trial A magnifying glass focuses on a vibrant bar graph, symbolizing financial growth and investment opportunities. Stacks of gold coins rest on a financial report, enhancing the visual representation of wealth and prosperity. This 3D rendering, generated by AI, is ideal for illustrating financial concep. Increase decrease graph illustrations Financial Growth Analysis. A magnifying glass focuses on a vibrant bar graph, symbolizing financial growth and investment opportunities. Stacks of gold coins rest on a financial report, enhancing the visual representation of wealth and prosperity. This 3D rendering, generated by AI, is ideal for illustrating financial concep
Free with trial A stack of coins rests on a financial chart showing a downward trend. This image, generated by AI, visually represents economic fluctuations and market instability. The dark coins emphasize the seriousness of the financial situation depicted by the graph. Increase decrease graph illustrations Financial Market Trends. A stack of coins rests on a financial chart showing a downward trend. This image, generated by AI, visually represents economic fluctuations and market instability. The dark coins emphasize the seriousness of the financial situation depicted by the graph.
Free with trial A minimalist, black and white vector icon representing a bar chart or graph. The icon features a series of vertical bars of varying heights, set against a base of horizontal lines. This clean and modern design is ideal for representing data, statistics, progress, growth, or financial information in digital and print media. Its simple aesthetic makes it versatile for use in presentations, websites, apps, and infographics. Increase decrease graph vectors Abstract Bar Chart Icon. A minimalist, black and white vector icon representing a bar chart or graph. The icon features a series of vertical bars of varying heights, set against a base of horizontal lines. This clean and modern design is ideal for representing data, statistics, progress, growth, or financial information in digital and print media. Its simple aesthetic makes it versatile for use in presentations, websites, apps, and infographics.
Free with trial A robotic hand interacts with a digital display showcasing a declining cost graph, symbolizing advancements in finance and technology in a modern business setting. Synapse. Increase decrease graph illustrations Futuristic Robot Hand Pointing Towards Digital Cost Decrease Graph Over Dark Business Environment with City Lights in. A robotic hand interacts with a digital display showcasing a declining cost graph, symbolizing advancements in finance and technology in a modern business setting. Synapse
Free with trial This isometric illustration shows a delicious breakfast plate alongside a stock market graph, representing the connection between food trends and market data. The visual, generated by AI, is perfect for illustrating articles about food market analysis or investment opportunities in the food industr. Increase decrease graph illustrations Breakfast Market Trends. This isometric illustration shows a delicious breakfast plate alongside a stock market graph, representing the connection between food trends and market data. The visual, generated by AI, is perfect for illustrating articles about food market analysis or investment opportunities in the food industr
Free with trial A visual representation of market fluctuations and business performance, with a red downward arrow indicating a decrease and a green upward arrow signifying growth and positive trends. Increase decrease graph illustrations Red down arrow and green up arrow symbols representing financial market trends and business growth. A visual representation of market fluctuations and business performance, with a red downward arrow indicating a decrease and a green upward arrow signifying growth and positive trends
Free with trial Description: Simple line art illustration of a scatter plot graph showing an uneven distribution of data points. Perfect for presentations or reports. Increase decrease graph vectors Abstract Data Visualization: Scatter Plot Chart with Irregular Data Points. Description: Simple line art illustration of a scatter plot graph showing an uneven distribution of data points. Perfect for presentations or reports.
Free with trial Conceptual image depicting real estate market analysis. A magnifying glass focuses on a brightly lit house model, surrounded by other house models and a rising graph, all set on a reflective surface. The scene suggests research, investment, and growth in the housing market. Ideal for illustrating articles or presentations on real estate trends, property valuation, and housing market forecasts. Increase decrease graph illustrations Real Estate Market Analysis
Free with trial This image showcases a dynamic graph, generated by AI, illustrating fluctuating data patterns. The abstract, wave-like design creates a visually engaging representation of complex information, perfect for presentations or reports needing a modern aesthetic. Its cool blue tones evoke a sense of calm. Increase decrease graph illustrations Abstract Data Visualization. This image showcases a dynamic graph, generated by AI, illustrating fluctuating data patterns. The abstract, wave-like design creates a visually engaging representation of complex information, perfect for presentations or reports needing a modern aesthetic. Its cool blue tones evoke a sense of calm
Free with trial A graph showing a downward trend on a grid background. 3D Rendering. Increase decrease graph illustrations Declining stock market trend illustration. 3D Rendering. A graph showing a downward trend on a grid background. 3D Rendering
Free with trial Food Price Inflation Diagram: Factors Affecting Costs, Supply, Demand, and Households featuring economics, infographic, prices with pressure and money elements for shopping basket, graph projects. Increase decrease graph illustrations Food Price Inflation Diagram: Factors Affecting Costs, Supply, Demand, and Households
Free with trial A clean, minimalist illustration featuring a combined line graph and bar chart on a white background. The line graph, with circular data points, shows an upward trend with fluctuations. It is overlaid on a series of vertical bars, alternating in black and white, representing discrete data values. The grid lines behind the charts suggest a data analysis or financial context. This graphic is ideal for presentations, reports, and websites related to statistics, business growth, market trends, and data visualization. Increase decrease graph vectors Line and Bar Chart Combination. A clean, minimalist illustration featuring a combined line graph and bar chart on a white background. The line graph, with circular data points, shows an upward trend with fluctuations. It is overlaid on a series of vertical bars, alternating in black and white, representing discrete data values. The grid lines behind the charts suggest a data analysis or financial context. This graphic is ideal for presentations, reports, and websites related to statistics, business growth, market trends, and data visualization.
Free with trial A set of four black and white icons illustrating volume control. Two icons depict increasing volume with a speaker symbol and an upward arrow alongside a rising bar graph. The other two icons represent decreasing volume with a speaker symbol and a downward arrow next to a falling bar graph. These clean, minimalist graphics are ideal for user interfaces, apps, and digital media. Increase decrease graph vectors Volume Control Icons: Up and Down. A set of four black and white icons illustrating volume control. Two icons depict increasing volume with a speaker symbol and an upward arrow alongside a rising bar graph. The other two icons represent decreasing volume with a speaker symbol and a downward arrow next to a falling bar graph. These clean, minimalist graphics are ideal for user interfaces, apps, and digital media.
Free with trial The image displays two bar graphs representing the stock market activities of buying and selling. The left graph, labeled 'BUY', shows a pyramid structure with increasing bars from bottom to top, indicating a rise in buying activities. The right graph, labeled 'SELL', shows a pyramid structure with decreasing bars from top to bottom, indicating a rise in selling activities. Increase decrease graph illustrations Stock market buy and sell graphs. The image displays two bar graphs representing the stock market activities of buying and selling. The left graph, labeled 'BUY', shows a pyramid structure with increasing bars from bottom to top, indicating a rise in buying activities. The right graph, labeled 'SELL', shows a pyramid structure with decreasing bars from top to bottom, indicating a rise in selling activities
Free with trial A grid of black and white icons depicting financial charts with rising and falling trends, magnifying glasses with download arrows, and dollar signs. Increase decrease graph vectors Collection of black and white icons representing financial charts and data analysis graph bar chart. A grid of black and white icons depicting financial charts with rising and falling trends, magnifying glasses with download arrows, and dollar signs
Free with trial 3D Isometric Flat Vector Illustration of Fertility Reduction In Europe, Decline Chart Showing Decrease in Number of People over Time. Increase decrease graph vectors 3D Isometric Flat Vector Illustration of Fertility Reduction In Europe
Free with trial This 3D rendering depicts stacks of gold coins rising alongside a financial graph, suggesting growth. The "Under Construction" title indicates a work in progress, possibly a project or investment. The image is generated by AI, showcasing the potential of digital art in visualizing financial concept. Increase decrease graph illustrations Financial Growth Under Construction. This 3D rendering depicts stacks of gold coins rising alongside a financial graph, suggesting growth. The "Under Construction" title indicates a work in progress, possibly a project or investment. The image is generated by AI, showcasing the potential of digital art in visualizing financial concept
Free with trial This 3D rendering shows a bar graph of increasing value, represented by white bars, alongside stacks of gold coins, visually depicting financial growth. The image was generated by AI, showcasing the potential of AI in visualizing financial data. Increase decrease graph illustrations AI-Generated Financial Growth Chart. This 3D rendering shows a bar graph of increasing value, represented by white bars, alongside stacks of gold coins, visually depicting financial growth. The image was generated by AI, showcasing the potential of AI in visualizing financial data.
Free with trial A graph showing global sales growth trends on a printed document with multiple colored lines. Increase decrease graph illustrations Global Sales Growth Chart on Document. A graph showing global sales growth trends on a printed document with multiple colored lines
Free with trial Red bar chart depicting a downward trend on a white background. The bars progressively decrease in height from left to right. An upward-pointing arrow emerges from the first bar, indicating initial growth. A curved, downward-pointing arrow overlays the bars, emphasizing the overall decline. The clear design conveys concepts of financial loss, decreasing statistics, or declining data points. Increase decrease graph vectors Red bar chart showing a downward trend with an upward arrow and a falling arrow isolated on white background. Red bar chart depicting a downward trend on a white background. The bars progressively decrease in height from left to right. An upward-pointing arrow emerges from the first bar, indicating initial growth. A curved, downward-pointing arrow overlays the bars, emphasizing the overall decline. The clear design conveys concepts of financial loss, decreasing statistics, or declining data points.
Free with trial Conceptual illustration representing cryptocurrency market trends with a bar graph showing financial growth alongside shadows of investment risk and volatility. Increase decrease graph vectors Stylized illustration showing cryptocurrency growth with bar graphs and shadows representing investment risks and market trends. conceptual illustration representing cryptocurrency market trends with a bar graph showing financial growth alongside shadows of investment risk and volatility
Free with trial The image features four bar graphs displaying data trends over time, with varying scales and patterns on each graph. Increase decrease graph illustrations Four graphs showing data trends over time. The image features four bar graphs displaying data trends over time, with varying scales and patterns on each graph
Free with trial A clean and minimalist vector icon featuring a black zigzag line, universally recognized as a heartbeat or pulse graph. Set against a stark white background and framed by a black border, this graphic effectively symbolizes vital signs, medical monitoring, data fluctuation, or energy signals. Its simple, high-contrast design makes it versatile for healthcare applications, financial charts, technology interfaces, infographics, and any project requiring a clear representation of rhythm, change, or status. Increase decrease graph vectors Minimalist Heartbeat Pulse Line Icon Vector. A clean and minimalist vector icon featuring a black zigzag line, universally recognized as a heartbeat or pulse graph. Set against a stark white background and framed by a black border, this graphic effectively symbolizes vital signs, medical monitoring, data fluctuation, or energy signals. Its simple, high-contrast design makes it versatile for healthcare applications, financial charts, technology interfaces, infographics, and any project requiring a clear representation of rhythm, change, or status.
Free with trial Business chart showing decline, red arrow down indicates financial loss, crisis, or failure. Increase decrease graph illustrations Business graph with red arrow pointing down showing financial decline. Business chart showing decline, red arrow down indicates financial loss, crisis, or. Business chart showing decline, red arrow down indicates financial loss, crisis, or failure
Free with trial A professional bar chart visualization featuring multiple colorful vertical bars of varying heights, representing statistical data, growth, or financial analysis in a clean minimalist style. Created AI. Increase decrease graph illustrations A colorful bar graph showing financial data trends on white background. A professional bar chart visualization featuring multiple colorful vertical bars of varying heights, representing statistical data, growth, or financial analysis in a clean minimalist style.Created AI
Free with trial A 3D rendered image of a tall cylindrical structure composed of stainless steel vertical bars arranged in descending order from tallest at the top to shortest at the bottom, creating a minimalist bar chart visualization that rests on a rectangular base of the same metallic material, evoking a modern and sleek aesthetic suitable for presentations about data analysis, financial growth, business. Increase decrease graph illustrations Modern stainless steel 3D bar graph rendering with minimalist design and sleek vertical structure. A 3D rendered image of a tall cylindrical structure composed of stainless steel vertical bars arranged in descending order from tallest at the top to shortest at the bottom, creating a minimalist bar chart visualization that rests on a rectangular base of the same metallic material, evoking a modern and sleek aesthetic suitable for presentations about data analysis, financial growth, business
Free with trial A minimalist black icon depicting a business data chart. It features a bar graph with multiple vertical bars, overlaid by two distinct line graphs. One line graph shows an upward trend with data points, symbolizing growth and success, while the other illustrates a downward trend, representing decline or loss. This versatile vector illustration is ideal for conveying concepts related to financial analysis, market trends, business performance, statistics, and economic fluctuations. Perfect for web interfaces, presentations, reports, and infographics. Increase decrease graph vectors Business Data Analysis Chart Icon with Trends. A minimalist black icon depicting a business data chart. It features a bar graph with multiple vertical bars, overlaid by two distinct line graphs. One line graph shows an upward trend with data points, symbolizing growth and success, while the other illustrates a downward trend, representing decline or loss. This versatile vector illustration is ideal for conveying concepts related to financial analysis, market trends, business performance, statistics, and economic fluctuations. Perfect for web interfaces, presentations, reports, and infographics.
Free with trial The image depicts a magnifying glass closely inspecting a graph that shows a rising trend. The graph is set against a blue circular background with white radial lines extending outward. A yellow upward-pointing arrow signifies growth, while a downward-pointing yellow arrow indicates a decline. The magnifying glass emphasizes the importance of detailed analysis in monitoring market trends. Increase decrease graph illustrations Examining market growth with magnifying glass. The image depicts a magnifying glass closely inspecting a graph that shows a rising trend. The graph is set against a blue circular background with white radial lines extending outward. A yellow upward-pointing arrow signifies growth, while a downward-pointing yellow arrow indicates a decline. The magnifying glass emphasizes the importance of detailed analysis in monitoring market trends
Free with trial Set of black icons showing a digital clock, triangular shape within a square, bar chart with line graph overlay, atomic model, upward arrows, and a ruler with a downward arrow. Generative AI. Increase decrease graph vectors Black digital clock triangle chart atom arrows and ruler icons. Set of black icons showing a digital clock, triangular shape within a square, bar chart with line graph overlay, atomic model, upward arrows, and a ruler with a downward arrow. Generative AI
Free with trial This image features two bar graphs isolated on a white background. The left graph, labeled 'PROFIT,' shows increasing bars indicating rising profit levels. The right graph, labeled 'LOSS,' displays decreasing bars, illustrating increasing loss levels. The image is clear, concise, and SEO-friendly, highlighting financial concepts. Increase decrease graph illustrations Profit and loss graphs isolated on white background. This image features two bar graphs isolated on a white background. The left graph, labeled 'PROFIT,' shows increasing bars indicating rising profit levels. The right graph, labeled 'LOSS,' displays decreasing bars, illustrating increasing loss levels. The image is clear, concise, and SEO-friendly, highlighting financial concepts
Free with trial Financial data chart, glowing lines, digital display. Stock image showing trends. Increase decrease graph illustrations Digital financial graph with candlestick chart, data analytics, stock market trend, technology concept. Financial data chart, glowing lines, digital display. Stock image showing trends
Free with trial The image depicts two bar graphs side by side. The left graph shows an upward trend with green bars increasing in height from left to right, accompanied by a green upward arrow, and is labeled 'Growth. ' The right graph shows a downward trend with red bars decreasing in height from left to right, accompanied by a red downward arrow, and is labeled 'Decline. ' The visual effectively contrasts the. Increase decrease graph illustrations Illustrative comparison of growth and decline trends. The image depicts two bar graphs side by side. The left graph shows an upward trend with green bars increasing in height from left to right, accompanied by a green upward arrow, and is labeled 'Growth.' The right graph shows a downward trend with red bars decreasing in height from left to right, accompanied by a red downward arrow, and is labeled 'Decline.' The visual effectively contrasts the
Free with trial This image displays two distinct charts illustrating annual revenue performance over quarters. The left chart features a line graph with shaded areas, showing trends and cumulative revenue. The right chart presents a bar graph with stacked segments, offering a clear comparison of revenue contributions across different quarters. Both charts use a clean, modern design with blue, green, and gray color palettes, suitable for business presentations, financial reports, and data visualization. Increase decrease graph illustrations Annual Revenue Performance Charts: Line and Bar Graphs. This image displays two distinct charts illustrating annual revenue performance over quarters. The left chart features a line graph with shaded areas, showing trends and cumulative revenue. The right chart presents a bar graph with stacked segments, offering a clear comparison of revenue contributions across different quarters. Both charts use a clean, modern design with blue, green, and gray color palettes, suitable for business presentations, financial reports, and data visualization.
Free with trial The image depicts a simple line graph that illustrates the fluctuation of data over a period of time. The x-axis represents the time, while the y-axis represents the variable being measured. The line graph shows several peaks and troughs, indicating variations in the data points. The graph starts at a low point, rises to a peak, dips to a trough, and then continues to fluctuate in this manner. The. Increase decrease graph vectors Graphical representation of fluctuating data over time. The image depicts a simple line graph that illustrates the fluctuation of data over a period of time. The x-axis represents the time, while the y-axis represents the variable being measured. The line graph shows several peaks and troughs, indicating variations in the data points. The graph starts at a low point, rises to a peak, dips to a trough, and then continues to fluctuate in this manner. The
Free with trial A digital bar chart displayed on a dark blue screen with a grid overlay. The bars are predominantly blue, with some white bars indicating significant spikes. The chart fluctuating data with reflections on the glossy surface below. Numbers and percentages are visible on the grid lines. Increase decrease graph illustrations Blue digital bar chart with grid and reflections graph. A digital bar chart displayed on a dark blue screen with a grid overlay. The bars are predominantly blue, with some white bars indicating significant spikes. The chart fluctuating data with reflections on the glossy surface below. Numbers and percentages are visible on the grid lines
Free with trial Business finance chart illustrating decline. Red arrow points down, indicating loss or recession. Dollar symbol beside bars. Increase decrease graph vectors Financial graph showing downward trend with dollar sign. Business finance chart illustrating decline. Red arrow points down, indicating loss or recession. Dollar symbol beside bars
Free with trial Up Down Arrow Icon Scale Arrowhead Point Pointer Lift Elevator Accend Decend Upload Download Shape Outline Vector Graphic Progress Bar Graph Black Line. Increase decrease graph vectors Up Down Arrow Icon Scale Arrowhead Point Pointer Lift Elevator Accend Decend Upload Download Shape Outline Vector Graphic Progress
Free with trial Several stacks of coins are positioned along a blue line graph on a white background, illustrating financial progress and positive market trends. Increase decrease graph illustrations Coins arranged on a financial chart indicating progress. Several stacks of coins are positioned along a blue line graph on a white background, illustrating financial progress and positive market trends
Free with trial A comprehensive set of black grunge-textured icons representing the US Dollar (USD) and its market dynamics. The collection features various symbols indicating upward trends, downward trends, stability, and currency exchange or circulation, often incorporating arrows and graph-like elements. Ideal for financial reports, economic analyses, investment platforms, business presentations, and any design requiring visual representation of money flow, market performance, or currency value changes in a distinct, distressed style. Increase decrease graph vectors Grunge USD Dollar Market Movement and Exchange Icons Set. A comprehensive set of black grunge-textured icons representing the US Dollar (USD) and its market dynamics. The collection features various symbols indicating upward trends, downward trends, stability, and currency exchange or circulation, often incorporating arrows and graph-like elements. Ideal for financial reports, economic analyses, investment platforms, business presentations, and any design requiring visual representation of money flow, market performance, or currency value changes in a distinct, distressed style.
Free with trial This 3D rendering illustrates the dynamic journey of financial markets. It depicts a series of bar graphs on a dark, reflective surface, showcasing different stages of economic activity. From steady growth and fluctuating upward trends, the visualization culminates in a dramatic market collapse, where a tall bar graph shatters into pieces. This powerful image represents concepts of business success, market volatility, economic downturns, and financial crises, making it ideal for reports, presentations, and articles on investment risks and market analysis. Increase decrease graph illustrations Financial Market Dynamics: Growth, Volatility, and Collapse. This 3D rendering illustrates the dynamic journey of financial markets. It depicts a series of bar graphs on a dark, reflective surface, showcasing different stages of economic activity. From steady growth and fluctuating upward trends, the visualization culminates in a dramatic market collapse, where a tall bar graph shatters into pieces. This powerful image represents concepts of business success, market volatility, economic downturns, and financial crises, making it ideal for reports, presentations, and articles on investment risks and market analysis.
Free with trial Person types on a laptop with financial growth symbols displayed representing investment strategy business success online trading stock market analysis and data driven decision making for financial p. Increase decrease graph illustrations Financial growth investment strategy business success online trading stock market analysis data chart graph money. Person types on a laptop with financial growth symbols displayed representing investment strategy business success online trading stock market analysis and data driven decision making for financial p
Free with trial A series of seven golden bars, arranged in descending order of height, form a bar chart on a white background. The bars are smooth and reflective, suggesting a metallic material. This visual representation clearly depicts a downward trend or a decline, commonly associated with financial losses, economic recession, or negative performance. Increase decrease graph illustrations Golden Bar Chart Illustrating a Downward Trend on a White Background graph financial. A series of seven golden bars, arranged in descending order of height, form a bar chart on a white background. The bars are smooth and reflective, suggesting a metallic material. This visual representation clearly depicts a downward trend or a decline, commonly associated with financial losses, economic recession, or negative performance
Free with trial This image features a collection of various black and white icons representing statistical graphics and charts. The icons include bar graphs, line graphs, and pie charts. The central image is a composite of a bar graph with an upward trending line graph and a pie chart. Surrounding this central image are smaller icons of similar graphs and charts. Increase decrease graph illustrations Collection of black and white statistical graphics and charts. This image features a collection of various black and white icons representing statistical graphics and charts. The icons include bar graphs, line graphs, and pie charts. The central image is a composite of a bar graph with an upward trending line graph and a pie chart. Surrounding this central image are smaller icons of similar graphs and charts
Free with trial A 3D rendered bar chart is displayed on a purple easel against a white background. The chart features a white board with a purple horizontal axis and three vertical purple bars of varying heights, indicating data or growth. The easel has three purple legs supporting the board. The overall aesthetic is clean and minimalist, suitable for business or educational contexts. Increase decrease graph illustrations A Purple 3D Rendered Bar Chart on an Easel Against a White Background graph statistics. A 3D rendered bar chart is displayed on a purple easel against a white background. The chart features a white board with a purple horizontal axis and three vertical purple bars of varying heights, indicating data or growth. The easel has three purple legs supporting the board. The overall aesthetic is clean and minimalist, suitable for business or educational contexts
Free with trial Golden coins stack with arrow graph showing growth and decline. Financial success and loss concept. Business and finance illustration. Increase decrease graph vectors Golden coins stack with upward and downward trending graph. Golden coins stack with arrow graph showing growth and decline. Financial success and loss concept. Business and finance illustration
Free with trial A single brown egg in a carton with a glowing red chart showing rising prices. Illustrates food inflation, commodity market volatility, and economic trends. Increase decrease graph illustrations Rising Egg Prices Concept with Red Financial Graph Overlay. A single brown egg in a carton with a glowing red chart showing rising prices. Illustrates food inflation, commodity market volatility, and economic trends
Free with trial Tax on wooden cube from stack block with percent and rise arrow, Real estate property investment concept. Asset management, Interest rates, inflation, loan mortgage, increase tax. 3d render. Increase decrease graph illustrations Tax on wooden cube from stack block with percent and rise arrow
Free with trial Cost and quality control, Businessman use computer laptop with quality control growth graph and cost reduction. Successful corporate strategy, quality control. Increase decrease graph illustrations Cost and quality control, Businessman use computer laptop with quality control growth graph and cost reduction. Successful
Free with trial Cost on wooden cube from stack block with Ai icon and rise arrow, Real estate property investment concept. Asset management, Interest rates, inflation, loan mortgage, decrease tax. 3d render. Increase decrease graph illustrations Cost on wooden cube from stack block with Ai icon and rise arrow