Free with trial A 3D rendering showing stacks of coins under a magnifying glass focusing on a bar graph, generated by AI. This image symbolizes financial analysis, investment, and wealth management. It's perfect for illustrating articles or presentations related to economic trends and monetary growth. Increase decrease graph illustrations Financial Analysis Magnifier. A 3D rendering showing stacks of coins under a magnifying glass focusing on a bar graph, generated by AI. This image symbolizes financial analysis, investment, and wealth management. It's perfect for illustrating articles or presentations related to economic trends and monetary growth.
Free with trial A simple 3D bar chart composed of three colored cubes stands on a white background. The cubes are arranged in ascending order of height from left to right: a small blue cube, a medium yellow cube, and a tall red cube. This arrangement visually represents increasing data or progress. Increase decrease graph illustrations Colorful Bar Chart with Red, Yellow, and Blue Cubes on White Background graph statistics. A simple 3D bar chart composed of three colored cubes stands on a white background. The cubes are arranged in ascending order of height from left to right: a small blue cube, a medium yellow cube, and a tall red cube. This arrangement visually represents increasing data or progress
Free with trial A 3D rendered graphic depicts a bar chart with three vertical bars of varying heights: two blue bars flanking a taller yellow bar. At the top of the yellow bar, a central yellow sphere is connected by white rods to two smaller blue spheres, resembling a molecular structure or a network. The entire graphic is isolated on a white background, suggesting concepts of data analysis, growth, and. Increase decrease graph illustrations 3D Rendered Bar Chart with Connecting Spheres Representing Data Analysis graph statistics. A 3D rendered graphic depicts a bar chart with three vertical bars of varying heights: two blue bars flanking a taller yellow bar. At the top of the yellow bar, a central yellow sphere is connected by white rods to two smaller blue spheres, resembling a molecular structure or a network. The entire graphic is isolated on a white background, suggesting concepts of data analysis, growth, and
Free with trial This illustration, generated by AI, depicts a hand adding a coin to a piggy bank, set against a backdrop of a zigzagging graph representing economic fluctuation. It visually communicates the importance of consistent saving even during challenging economic times. Increase decrease graph illustrations Saving Through Economic Downturn. This illustration, generated by AI, depicts a hand adding a coin to a piggy bank, set against a backdrop of a zigzagging graph representing economic fluctuation. It visually communicates the importance of consistent saving even during challenging economic times.
Free with trial A hand places a Bitcoin into a piggy bank, symbolizing cryptocurrency investment. The upward arrow and growing bar graph illustrate increasing value, a visual representation of potential returns generated by AI. Increase decrease graph illustrations Bitcoin Piggy Bank Savings Growth. A hand places a Bitcoin into a piggy bank, symbolizing cryptocurrency investment. The upward arrow and growing bar graph illustrate increasing value, a visual representation of potential returns generated by AI.
Free with trial Abstract graphical representation of data trends, likely showing increases and decreases. The design is composed of a network of connecting points and lines, with a pattern of various shades of gray, white, and red. The texture suggests a digital or technological origin, with a soft focus on the visual elements. The format is suitable for commercial or editorial purposes related to technology,. Increase decrease graph illustrations Abstract data graph visualization. Abstract graphical representation of data trends, likely showing increases and decreases. The design is composed of a network of connecting points and lines, with a pattern of various shades of gray, white, and red. The texture suggests a digital or technological origin, with a soft focus on the visual elements. The format is suitable for commercial or editorial purposes related to technology,
Free with trial Cost on wooden cube from stack block with rise arrow, Real estate property investment concept. Asset management, Interest rates, inflation, loan mortgage, decrease tax. 3d render. Increase decrease graph illustrations Cost on wooden cube from stack block with rise arrow
Free with trial The image shows a series of colorful wooden blocks arranged in ascending order of height, resembling a bar graph. the blocks are placed on a weathered wooden surface, adding a rustic and natural feel to the composition. the colors of the blocks range from orange to purple, creating a visually appealing gradient. the background is blurred, suggesting an outdoor setting with natural light filtering through. the focus is on the blocks, highlighting their texture and the interplay of colors. Increase decrease graph illustrations Colorful wooden blocks on rustic wood surface. the image shows a series of colorful wooden blocks arranged in ascending order of height, resembling a bar graph. the blocks are placed on a weathered wooden surface, adding a rustic and natural feel to the composition. the colors of the blocks range from orange to purple, creating a visually appealing gradient. the background is blurred, suggesting an outdoor setting with natural light filtering through. the focus is on the blocks, highlighting their texture and the interplay of colors.
Free with trial This vibrant, wavy graph, generated by AI, displays data progression using a color-coded system. The gradual color shift from green to red signifies a change in values, making it ideal for representing various trends or metrics. The accompanying key provides additional clarity. Increase decrease graph illustrations Colorful AI-Generated Data Visualization. This vibrant, wavy graph, generated by AI, displays data progression using a color-coded system. The gradual color shift from green to red signifies a change in values, making it ideal for representing various trends or metrics. The accompanying key provides additional clarity.
Free with trial A versatile set of business and finance icons isolated on a white background. This collection features various data visualization elements, including bar charts, line graphs, pie charts, and diagrams. The clean, vector style represents concepts like statistical analysis, market growth, financial reporting, and economic trends. These infographic elements are perfect for presentations, business reports, websites, and marketing materials to illustrate progress, performance, and data-driven insights. Increase decrease graph vectors Business and Finance Chart and Graph Icon Set. A versatile set of business and finance icons isolated on a white background. This collection features various data visualization elements, including bar charts, line graphs, pie charts, and diagrams. The clean, vector style represents concepts like statistical analysis, market growth, financial reporting, and economic trends. These infographic elements are perfect for presentations, business reports, websites, and marketing materials to illustrate progress, performance, and data-driven insights.
Free with trial High-Quality Vector Icons. Increase decrease graph illustrations Decrease icon vector, filled. High-Quality Vector Icons
Free with trial Abstract digital illustration of a financial chart. A glowing white line graph rises and falls against a blue background with a grid pattern made of dots. The image conveys concepts of market trends, stock analysis, investment, and economic fluctuations. Suitable for illustrating financial reports, business presentations, and technology-related articles. Increase decrease graph illustrations Abstract Financial Chart with Glowing Line. Abstract digital illustration of a financial chart. A glowing white line graph rises and falls against a blue background with a grid pattern made of dots. The image conveys concepts of market trends, stock analysis, investment, and economic fluctuations. Suitable for illustrating financial reports, business presentations, and technology-related articles.
Free with trial Cost and Quality control, business strategy and project management technology concept. Businessman working on digital tablet with quality control growth graph and cost reduction, effective business. Increase decrease graph illustrations Cost and Quality control, business strategy and project management technology concept.
Free with trial A hand-drawn illustration depicting a presentation on data trends. A stick figure presenter, holding a microphone, points to a chart on a screen labeled "DATA TRENDS. " The chart displays a line graph and bar graphs, suggesting growth and analysis. This image is suitable for illustrating business concepts, data analysis, presentations, and financial reports. It conveys a sense of information, communication, and progress. Increase decrease graph vectors Data Presentation: Business Trends and Analysis. A hand-drawn illustration depicting a presentation on data trends. A stick figure presenter, holding a microphone, points to a chart on a screen labeled "DATA TRENDS." The chart displays a line graph and bar graphs, suggesting growth and analysis. This image is suitable for illustrating business concepts, data analysis, presentations, and financial reports. It conveys a sense of information, communication, and progress.
Free with trial A collection of financial chart icons, showcasing data analysis and business growth concepts. The image features multiple variations of a line graph and bar chart combination, presented in both grayscale and beige color schemes. These icons are ideal for illustrating financial reports, business presentations, market trends, and data visualization projects. The clean, modern design makes them suitable for a wide range of applications. Increase decrease graph vectors Financial Chart Icons: Business and Data Analysis. A collection of financial chart icons, showcasing data analysis and business growth concepts. The image features multiple variations of a line graph and bar chart combination, presented in both grayscale and beige color schemes. These icons are ideal for illustrating financial reports, business presentations, market trends, and data visualization projects. The clean, modern design makes them suitable for a wide range of applications.
Free with trial A clean, flat design illustration featuring a collection of icons related to social media engagement and data analysis. The set includes a pie chart, bar graphs showing upward trends, a line graph with a heart icon and an upward arrow, another line graph with data points, a speech bubble with the word 'LIKE' and abstract shapes, and a thumbs-up icon with a notification count. These graphics are ideal for representing concepts like growth, popularity, analytics, and user feedback in digital marketing, business reports, and web design. Increase decrease graph illustrations Social Media Metrics and Data Visualization Icons. A clean, flat design illustration featuring a collection of icons related to social media engagement and data analysis. The set includes a pie chart, bar graphs showing upward trends, a line graph with a heart icon and an upward arrow, another line graph with data points, a speech bubble with the word 'LIKE' and abstract shapes, and a thumbs-up icon with a notification count. These graphics are ideal for representing concepts like growth, popularity, analytics, and user feedback in digital marketing, business reports, and web design.
Free with trial Abstract 3D rendering of a golden bar graph, depicting data fluctuations Represents growth and market trends. Increase decrease graph illustrations Golden Data Visualization. AI Generated. Abstract 3D rendering of a golden bar graph, depicting data fluctuations Represents growth and market trends
Free with trial Contrast exploded view of property value chart high contrast illustration real estate, analysis graph, data visualization contrast exploded view of property value chart high contrast. Increase decrease graph illustrations Contrast exploded view of property value chart high contrast
Free with trial , Applied for Info Graphics, Design Elements, Websites, Presentations, and Application - Vector. Increase decrease graph illustrations Decrease Icon. Down Symbol within Glyph Style - Vector. , Applied for Info Graphics, Design Elements, Websites, Presentations, and Application - Vector.
Free with trial Cheerful cartoon businessman reviewing positive financial data upward trending graph. Increase decrease graph illustrations Happy Businessman Analyzing Financial Growth Charts. Cheerful cartoon businessman reviewing positive financial data upward trending graph.
Free with trial A businessman in a suit uses a laptop and a stylus to interact with a futuristic holographic display showing business analytics icons. The display includes a graph, handshake, target, gears, and indicators for quality and cost with upward and downward arrows. Charts and graphs are visible on the desk. Increase decrease graph illustrations Business analytics with quality and cost indicators. A businessman in a suit uses a laptop and a stylus to interact with a futuristic holographic display showing business analytics icons. The display includes a graph, handshake, target, gears, and indicators for quality and cost with upward and downward arrows. Charts and graphs are visible on the desk
Free with trial A vector illustration showing a magnifying glass focused on a bar graph and line chart indicating growth. The magnifying glass has a blue frame and red handle. The chart depicts an upward trend, suggesting positive business performance. This image is suitable for illustrating data analysis, business strategy, market research, and financial growth concepts. Increase decrease graph vectors Analyzing Growth: Magnifying Glass on Business Chart. A vector illustration showing a magnifying glass focused on a bar graph and line chart indicating growth. The magnifying glass has a blue frame and red handle. The chart depicts an upward trend, suggesting positive business performance. This image is suitable for illustrating data analysis, business strategy, market research, and financial growth concepts.
Free with trial A cheerful cartoon businessman in a suit stands proudly beside a rising bar graph, illustrating positive financial growth and business success. Increase decrease graph illustrations Smiling Businessman Presenting Financial Growth Chart. A cheerful cartoon businessman in a suit stands proudly beside a rising bar graph, illustrating positive financial growth and business success.
Free with trial A set of financial icons depicting market trends, investment growth, and money management, including charts, coins, and graphs for economic analysis. Increase decrease graph vectors Financial graph and money icons on transparent background. A set of financial icons depicting market trends, investment growth, and money management, including charts, coins, and graphs for economic analysis.
Free with trial A stylized chart with bars and a line graph is displayed in a soft speech bubble against a simple background great for business or infographic presentations. Increase decrease graph illustrations Analyzing Data Chart in Speech Bubble for Presentation. A stylized chart with bars and a line graph is displayed in a soft speech bubble against a simple background great for business or infographic presentations
Free with trial A 3D rendered bar chart composed of four colored blocks of varying heights. The blocks are blue, yellow, red, and white, arranged from shortest to tallest from left to right. The chart is presented on a clean white background, with subtle shadows beneath the blocks. Increase decrease graph illustrations Colorful 3D Bar Chart with Varying Heights on a White Background graph statistics. A 3D rendered bar chart composed of four colored blocks of varying heights. The blocks are blue, yellow, red, and white, arranged from shortest to tallest from left to right. The chart is presented on a clean white background, with subtle shadows beneath the blocks
Free with trial Visual representation of growth forecast and risk projection using colorful 3D bar graphs, emphasizing trends and metrics in business and finance analysis. Increase decrease graph illustrations Growth Forecast with Risk Projection Using Colorful 3D Bar Graph Visualization. Visual representation of growth forecast and risk projection using colorful 3D bar graphs, emphasizing trends and metrics in business and finance analysis
Free with trial A simple graphic showing various data representation methods including bar, line, and pie charts in a monochrome style. Increase decrease graph vectors Black and White Data Visualization Charts Bar Graph, Line Graph, and Pie Charts. A simple graphic showing various data representation methods including bar, line, and pie charts in a monochrome style
Free with trial A world map showing meat distribution, featuring Qurbani meat data, a graph, and icons representing different animals. Increase decrease graph illustrations World Meat Distribution Map with Qurbani Meat Data and Animal Ic. A world map showing meat distribution, featuring Qurbani meat data, a graph, and icons representing different animals
Free with trial A grid of black icons representing various types of graphs and charts, including bar graphs and line graphs with upward arrows, on a white background. Increase decrease graph vectors Collection of Ai-Generated black and white graph and chart icons. A grid of black icons representing various types of graphs and charts, including bar graphs and line graphs with upward arrows, on a white background
Free with trial A simple line style icon of a bar chart representing growth, data, or statistics. This graphic element is perfect for use in presentations, infographics, web design, and user interfaces. Increase decrease graph vectors Simple Line Style Bar Chart Graphic Outline Display Graph Icon. A simple line style icon of a bar chart representing growth, data, or statistics. This graphic element is perfect for use in presentations, infographics, web design, and user interfaces.
Free with trial Three miniature apartment building models are shown against a backdrop of a stock market graph illustrating real estate trends. Increase decrease graph illustrations Apartment Building Models Illustrate Real Estate Market Trends. Three miniature apartment building models are shown against a backdrop of a stock market graph illustrating real estate trends
Free with trial Abstract digital illustration depicting two contrasting glowing line graphs. A vibrant blue/cyan line trends steeply upwards with an arrow, while a bright red line trends downwards with its arrow, crossing over the blue line mid-way. Subtle dotted lines and sparkling light effects add detail against the dark, moody background. This dynamic image conveys energy and volatility, suitable for representing concepts like market fluctuations, contrasting financial trends (growth vs. decline), stock market analysis, competition, data comparison, economic divergence, risk assessment, and critical crossover points. Ideal for financial reports, articles on market volatility, illustrating competitive analysis, or business strategy presentations. Increase decrease graph illustrations Contrasting red downward and blue upward glowing graph arrows crossing. Abstract digital illustration depicting two contrasting glowing line graphs. A vibrant blue/cyan line trends steeply upwards with an arrow, while a bright red line trends downwards with its arrow, crossing over the blue line mid-way. Subtle dotted lines and sparkling light effects add detail against the dark, moody background. This dynamic image conveys energy and volatility, suitable for representing concepts like market fluctuations, contrasting financial trends (growth vs. decline), stock market analysis, competition, data comparison, economic divergence, risk assessment, and critical crossover points. Ideal for financial reports, articles on market volatility, illustrating competitive analysis, or business strategy presentations.
Free with trial This vibrant 3D rendering showcases an ascending bar chart, featuring colorful cylinders and a rising line graph, all set against a clean white backdrop. Ideal for presentations, reports, or marketing materials to visually represent growth, progress, and success. Increase decrease graph illustrations Ascending Colorful 3D Bar Chart with Growth Line on Pink Platform. This vibrant 3D rendering showcases an ascending bar chart, featuring colorful cylinders and a rising line graph, all set against a clean white backdrop. Ideal for presentations, reports, or marketing materials to visually represent growth, progress, and success.
Free with trial A person is using a stylus to interact with a digital display showing a graph that illustrates quality improvement alongside cost reduction. Focus on effective business strategies. Increase decrease graph illustrations Quality improvement with cost reduction strategy on digital display. A person is using a stylus to interact with a digital display showing a graph that illustrates quality improvement alongside cost reduction. Focus on effective business strategies
Free with trial A glowing green bar chart with a data line and grid on a black background, representing financial performance. Increase decrease graph illustrations Glowing Green Bar Chart with Data Line on photo Black graph finance. A glowing green bar chart with a data line and grid on a black background, representing financial performance
Free with trial This image depicts a vibrant and modern representation of financial success, featuring 3D bar graphs, pie charts, and a calculator, all set against a clean white background. The upward-trending graph showcases growth and progress. Increase decrease graph illustrations Colorful 3D Financial Charts and Calculator Showing Business Growth. This image depicts a vibrant and modern representation of financial success, featuring 3D bar graphs, pie charts, and a calculator, all set against a clean white background. The upward-trending graph showcases growth and progress.
Free with trial A businessman in a suit analyzes financial data with a laptop. The concept represents improving quality while reducing costs to optimize business performance and increase profitability. Increase decrease graph illustrations Businessman analyzing data with cost and quality improvement concept. A businessman in a suit analyzes financial data with a laptop. The concept represents improving quality while reducing costs to optimize business performance and increase profitability
Free with trial Two distinct lines converge in an engaging graph, illustrating contrasting trends. The sharp gradient colors enhance the visual impact, emphasizing change and growth. Increase decrease graph illustrations Dynamic Trends Revealed Through Shifting Data in Vibrant Gradient Hues. Two distinct lines converge in an engaging graph, illustrating contrasting trends. The sharp gradient colors enhance the visual impact, emphasizing change and growth
Free with trial This image showcases a vibrant infographic with 3D bar, pie, and line charts. The colorful elements are displayed on a teal platform, ideal for presentations or reports. Increase decrease graph illustrations Colorful 3D Bar Chart, Pie Chart, and Line Graph Infographic on Teal Platform. This image showcases a vibrant infographic with 3D bar, pie, and line charts. The colorful elements are displayed on a teal platform, ideal for presentations or reports.
Free with trial This 3D rendering depicts financial growth, showcasing stacks of gold coins and black bars representing a rising graph. A golden pen rests on a sleek base, symbolizing the precision and detail involved in financial planning. This image was generated by AI and is perfect for illustrating financial s. Increase decrease graph illustrations Financial Growth Visualization. This 3D rendering depicts financial growth, showcasing stacks of gold coins and black bars representing a rising graph. A golden pen rests on a sleek base, symbolizing the precision and detail involved in financial planning. This image was generated by AI and is perfect for illustrating financial s
Free with trial This image shows a calculator next to colorful 3D bar charts and pie charts illustrating business growth and financial success. The vibrant colors and upward-trending graph create a visually appealing representation of positive financial results. Increase decrease graph illustrations Colorful Calculator and 3D Charts Showing Business Growth. This image shows a calculator next to colorful 3D bar charts and pie charts illustrating business growth and financial success. The vibrant colors and upward-trending graph create a visually appealing representation of positive financial results.
Free with trial This 3D rendering showcases a vibrant bar graph and pie chart, ideal for visualizing business growth, financial reports, and data analysis. The colorful design makes it visually engaging and easy to understand. Increase decrease graph illustrations Colorful 3D Bar and Pie Chart Illustrating Business Growth and Financial Data. This 3D rendering showcases a vibrant bar graph and pie chart, ideal for visualizing business growth, financial reports, and data analysis. The colorful design makes it visually engaging and easy to understand.
Free with trial A striking graph displays two distinct lines, one rising and the other falling, representing contrasting trends. The vivid gradient colors create a dynamic visual effect. Increase decrease graph illustrations Lines of Change in Vibrant Gradients Illustrate Contrasting Trends Over Time. A striking graph displays two distinct lines, one rising and the other falling, representing contrasting trends. The vivid gradient colors create a dynamic visual effect
Free with trial Data analysis graphs with up and down arrow line icons set. Increase and reduction of economy or trend charts, price boost, stock market research thin black and red outline symbols vector illustration. Increase decrease graph vectors Data analysis graphs with up and down arrow, economy or trend charts line icons set. Data analysis graphs with up and down arrow line icons set. Increase and reduction of economy or trend charts, price boost, stock market research thin black and red outline symbols vector illustration
Free with trial A series of wooden blocks, each marked with a percentage symbol, form a descending staircase. A bold red arrow dramatically points downwards, symbolizing financial decline. Increase decrease graph illustrations A red arrow graph shows a sharp decline, indicating a significant drop in percentages. A series of wooden blocks, each marked with a percentage symbol, form a descending staircase. A bold red arrow dramatically points downwards, symbolizing financial decline
Free with trial Increase and reduction of economy or trend charts, price boost, stock market research thin black outline symbols vector illustration. Data analysis graphs with up and down arrow line icons set. Increase decrease graph vectors Data analysis graphs with up and down arrow, economy or trend charts line icons set. Increase and reduction of economy or trend charts, price boost, stock market research thin black outline symbols vector illustration. Data analysis graphs with up and down arrow line icons set.
Free with trial A 10% portion, often represented as a decimal, fraction, or percentage, is a fundamental concept in various fields. Whether calculating savings, understanding ratios, or simply dividing something into tenths, this fraction holds significant importance. This visual representation explores the practical application of a 10% reduction or increase, showing its impact on various quantities. From. Increase decrease graph illustrations Understanding the Impact of a 10 Portion Savings Ratios and Fractions Explained. A 10% portion, often represented as a decimal, fraction, or percentage, is a fundamental concept in various fields. Whether calculating savings, understanding ratios, or simply dividing something into tenths, this fraction holds significant importance. This visual representation explores the practical application of a 10% reduction or increase, showing its impact on various quantities. From
Free with trial A minimalist bar chart is displayed on a white background. Three vertical bars of increasing height are depicted with thick black outlines. The interior of each bar features a subtle grey gradient fill, creating a sense of depth. Increase decrease graph illustrations Simple Black Outline Bar Chart with Gradient Fill on White Background graph bars. A minimalist bar chart is displayed on a white background. Three vertical bars of increasing height are depicted with thick black outlines. The interior of each bar features a subtle grey gradient fill, creating a sense of depth
Free with trial A businessman in a suit analyzes financial data with a laptop. The concept represents improving quality while reducing costs to optimize business performance and increase profitability. Increase decrease graph illustrations Businessman analyzing data with cost and quality improvement concept. A businessman in a suit analyzes financial data with a laptop. The concept represents improving quality while reducing costs to optimize business performance and increase profitability
Free with trial A comprehensive set of black and white icons for graphs and charts, illustrating various data visualization types and business-related concepts for digital and print media. Increase decrease graph vectors Diverse collection of graph and chart icons representing data analysis and business growth. A comprehensive set of black and white icons for graphs and charts, illustrating various data visualization types and business-related concepts for digital and print media
Free with trial A digital illustration depicting a financial chart with blue and red bars and lines. Neon glows accentuate the data points. The style is abstract and modern. Increase decrease graph illustrations Abstract Blue Red Financial Data Chart Graph Digital Illustration Neon Glow business. A digital illustration depicting a financial chart with blue and red bars and lines. Neon glows accentuate the data points. The style is abstract and modern
Free with trial A 3D bar chart displays four bars in descending order of height: green, purple, blue, and pink, set against a white background. Clear details and vibrant colors enhance visual appeal. Increase decrease graph illustrations 3D Bar Chart With Green Purple Blue And Pink Bars In Descending Order graph decrease. A 3D bar chart displays four bars in descending order of height: green. A 3D bar chart displays four bars in descending order of height: green, purple, blue, and pink, set against a white background. Clear details and vibrant colors enhance visual appeal
Free with trial A 3D rendered bar chart with yellow, pink, and teal bars stands against a light purple background. A purple magnifying glass with a yellow handle is positioned over the chart, suggesting analysis. A thin line with pink dots connects the tops of the bars, indicating a trend. Increase decrease graph illustrations 3D Bar Chart with Magnifying Glass and Trend Line on Purple Background graph statistics. A 3D rendered bar chart with yellow, pink, and teal bars stands against a light purple background. A purple magnifying glass with a yellow handle is positioned over the chart, suggesting analysis. A thin line with pink dots connects the tops of the bars, indicating a trend
Free with trial This vibrant image showcases a collection of colorful 3D charts and graphs, including bar graphs, pie charts, and a line graph, all illustrating positive growth. A calculator and pencil are included, emphasizing the analytical and planning aspects of business success. Perfect for illustrating finan. Increase decrease graph illustrations Colorful 3D Financial Charts and Graphs with Calculator for Business Growth Presentation. This vibrant image showcases a collection of colorful 3D charts and graphs, including bar graphs, pie charts, and a line graph, all illustrating positive growth. A calculator and pencil are included, emphasizing the analytical and planning aspects of business success. Perfect for illustrating finan
Free with trial A vibrant graph displays two contrasting lines, one rising and the other falling, set against a blurred backdrop of light reflections, conveying a sense of motion and change. Increase decrease graph illustrations Dynamic Trends Illustrate Contrasting Growth and Decline in Statistical Data Visualization. A vibrant graph displays two contrasting lines, one rising and the other falling, set against a blurred backdrop of light reflections, conveying a sense of motion and change
Free with trial A stylized 3D business growth chart depicted against a light blue background. The chart features a blue mountain-like shape representing a peak, with two intersecting lines. One line, marked with pink nodes, shows fluctuations, while another line with green nodes indicates a general upward trend. This visual metaphor conveys concepts of business performance, market trends, and financial analysis. Increase decrease graph illustrations 3D Stylized Business Growth Chart with Red and Green Nodes on Blue Background graph data. A stylized 3D business growth chart depicted against a light blue background. The chart features a blue mountain-like shape representing a peak, with two intersecting lines. One line, marked with pink nodes, shows fluctuations, while another line with green nodes indicates a general upward trend. This visual metaphor conveys concepts of business performance, market trends, and financial analysis
Free with trial This detailed graph highlights the stark contrast between a declining and ascending trend, using vibrant orange shades to showcase dynamic changes over time. Increase decrease graph illustrations Graphical Representation of Contrasting Trends in Shades of Orange Exhibiting Dynamic Changes. This detailed graph highlights the stark contrast between a declining and ascending trend, using vibrant orange shades to showcase dynamic changes over time
Free with trial A striking graph depicts two lines: one gracefully declining, the other soaring upwards, set against a vivid gradient background that creates a compelling atmosphere. Increase decrease graph illustrations Dynamic Gradients Showcase Contrasting Growth and Decline Trends in a Captivating Landscape. A striking graph depicts two lines: one gracefully declining, the other soaring upwards, set against a vivid gradient background that creates a compelling atmosphere
Free with trial A striking graph illustrates opposing trends one line sharply decreases while another rises, enveloped in warm orange hues that evoke energy and transformation. Increase decrease graph illustrations Dynamic Trends Displayed Through Contrasting Lines in Shades of Orange With a Vivid Background. A striking graph illustrates opposing trends one line sharply decreases while another rises, enveloped in warm orange hues that evoke energy and transformation
Free with trial A financial illustration shows coins decreasing in size along a horizontal axis, representing devaluation. An upward-pointing arrow indicates increasing inflation percentages, with labels of "4%", "20%", and "50%". The chart is labeled "INFLATION" at the top, with percentages scattered around. Broken pieces from a large coin suggest fragmentation and loss of value. The background features a subtle line graph, reinforcing the economic theme. Increase decrease graph illustrations Inflation increasing and devaluing money, showing a financial chart with coins and an arrow going up. A financial illustration shows coins decreasing in size along a horizontal axis, representing devaluation. An upward-pointing arrow indicates increasing inflation percentages, with labels of "4%", "20%", and "50%". The chart is labeled "INFLATION" at the top, with percentages scattered around. Broken pieces from a large coin suggest fragmentation and loss of value. The background features a subtle line graph, reinforcing the economic theme.
Free with trial A striking graph displays two lines, one depicting a steady decline and the other a sharp rise, rendered in vibrant gradient shades, symbolizing market fluctuations. Increase decrease graph illustrations Visual Representation of Contrasting Trends With Dynamic Gradient Colors Showcasing Market Shifts. A striking graph displays two lines, one depicting a steady decline and the other a sharp rise, rendered in vibrant gradient shades, symbolizing market fluctuations
Free with trial Three-dimensional rectangular bars stand side-by-side on a white background. The bars are of different heights, with the shortest on the left, a medium-height bar in the middle, and the tallest bar on the right. The bars are colored blue, pink, and orange, respectively. This arrangement visually represents a bar chart or graph, suggesting concepts of growth, data comparison, or progress. Increase decrease graph illustrations Three 3D Rendered Rectangular Bars of Varying Heights and Colors on a White Background bar chart. Three-dimensional rectangular bars stand side-by-side on a white background. The bars are of different heights, with the shortest on the left, a medium-height bar in the middle, and the tallest bar on the right. The bars are colored blue, pink, and orange, respectively. This arrangement visually represents a bar chart or graph, suggesting concepts of growth, data comparison, or progress
Free with trial This graph illustrates a compelling visual narrative, showcasing a sharp rise alongside a notable decline, created with vibrant gradient colors. Increase decrease graph illustrations Graphical Representation of Contrasting Trends in Vibrant Gradient Hues Revealing Significant Changes. This graph illustrates a compelling visual narrative, showcasing a sharp rise alongside a notable decline, created with vibrant gradient colors
Free with trial Monochrome chart representing big data analysis with peaks and valleys, stock market theme for investment strategy and economic forecast using modern digital infographic. Increase decrease graph illustrations Abstract 3d graph with data blocks on white grid background, business analytics concept for financial report and corporate. Monochrome chart representing big data analysis with peaks and valleys, stock market theme for investment strategy and economic forecast using modern digital infographic
Free with trial Reduction chart icon Black line art vector in black and white outline set collection sign. Increase decrease graph vectors Decline Chart Icon Illustrating Decrease in Performance, Economic Downturn, and Analytical Data. Reduction chart icon Black line art vector in black and white outline set collection sign
Free with trial Bar chart with illuminated bars showing an upward trend, depicted against a blurred cityscape at night. Bars increase in height from left to right, symbolizing growth. The glowing blue bars stand out against the dark background, visually representing a bullish financial trend. Various structures and faint lights in the defocused cityscape add context, highlighting the analytical and financial theme. Increase decrease graph illustrations Dynamic stock market chart showing bullish trend after downturn for financial analysis reports and presentations. Bar chart with illuminated bars showing an upward trend, depicted against a blurred cityscape at night. Bars increase in height from left to right, symbolizing growth. The glowing blue bars stand out against the dark background, visually representing a bullish financial trend. Various structures and faint lights in the defocused cityscape add context, highlighting the analytical and financial theme.
Free with trial A vibrant watercolor painting of a colorful tree alongside a bar graph showing fluctuating growth, symbolizing nature, growth, change, resilience, and potential. Elegant empty space crafted for branding, ads, and product presentations. Suitable for marketing campaigns and creative displays. . Generative AI. Increase decrease graph illustrations Watercolor Tree and Growth Chart A vibrant watercolor painting of a colorful tree alongside a bar graph showing fluctuating. A vibrant watercolor painting of a colorful tree alongside a bar graph showing fluctuating growth, symbolizing nature, growth, change, resilience, and potential. Elegant empty space crafted for branding, ads, and product presentations. Suitable for marketing campaigns and creative displays. . Generative AI
Free with trial Profit growing and decrease sumbol. Statistic up and down arrows. Business growths chart. Green and red arrow - stock vector. Increase decrease graph illustrations Profit growing and decrease sumbol. Statistic up and down arrows. Business growths chart. Green and red arrow - stock vector
Free with trial A grid of 28 simple black line art icons on a white background depicting various financial charts graphs and business related symbols including bar charts pie charts computers and money. Increase decrease graph vectors Collection of 28 minimalist line art icons representing financial data charts and business concepts graph. A grid of 28 simple black line art icons on a white background depicting various financial charts graphs and business related symbols including bar charts pie charts computers and money
Free with trial Purple-toned financial visualization depicting stock market volatility, candlestick graph overlaying New York City skyline with currency indicators. Increase decrease graph illustrations Candlestick chart showing stock market volatility with New York City skyline and dollar signs, in purple monochrome. Purple-toned financial visualization depicting stock market volatility, candlestick graph overlaying New York City skyline with currency indicators
Free with trial A captivating stock market analysis chart that visualizes financial data and business growth. The blue background enhances the modern design, perfect for illustrating investment trends and economic reports. Increase decrease graph illustrations Stock market analysis chart financial data graph business investment growth blue background vector illustration. a captivating stock market analysis chart that visualizes financial data and business growth. The blue background enhances the modern design, perfect for illustrating investment trends and economic reports.
Free with trial Set line Cloud computing lock Pie chart infographic Financial growth Search with folder Document and decrease icon. Vector. Increase decrease graph illustrations Set line Cloud computing lock, Pie chart infographic, Financial growth, Search with folder, Document and decrease icon
Free with trial Two hands cradle glowing symbols. On the left, a percentage sign emanates warmth and light, while the right hand holds an upward-trending graph, symbolizing growth. Tiny, shimmering particles float between them, suggesting the exchange of financial concepts. Created ai. Increase decrease graph illustrations Boost your business success with strategic financial growth and rising interest rates now with this dynamic composition. Two hands cradle glowing symbols. On the left, a percentage sign emanates warmth and light, while the right hand holds an upward-trending graph, symbolizing growth. Tiny, shimmering particles float between them, suggesting the exchange of financial concepts. Created ai
Free with trial Sugar cubes pile sits before financial chart screen with market data. Concept of commodity trading, investment in sugar prices. Stock exchange graph shows futures rise, fall. Increase decrease graph illustrations Sugar cubes pile sits before financial chart screen with market data. Concept of commodity trading, investment in sugar prices.
Free with trial Wooden blocks stacked coins illustrate rising inflation and economic growth concept economy. Increase decrease graph illustrations Rising Inflation Economic Growth Financial Crisis Concept Wooden Blocks Stacked Coins Business Chart Graph red risk cost. Wooden blocks stacked coins illustrate rising inflation and economic growth concept economy
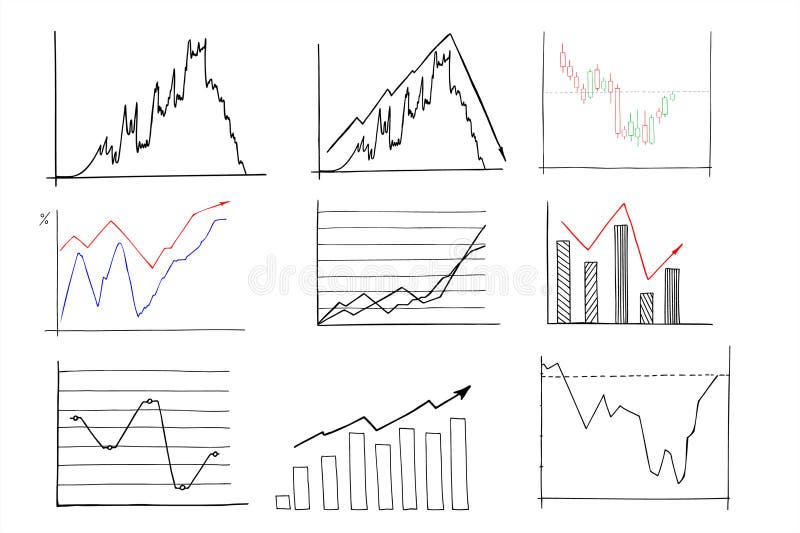
Free with trial Chart line set. Graph, finance report, income growth, economy statistic, diagram, infographic, mind map, data visualization vector illustration. Outline signs of analytic. Editable Stroke. Increase decrease graph vectors Analytical graphic chart with trend lines, columns set hand drawn ink sketch. Change in time of election results or income, plans. Chart line set. Graph, finance report, income growth, economy statistic, diagram, infographic, mind map, data visualization vector illustration. Outline signs of analytic. Editable Stroke
Free with trial Golden dollar coins stack and up arrow. Flat vector icon isolated on white. Economy, finance, money symbol. Currency pictogram. Vector illustration. decrease. Increase decrease graph vectors Golden dollar coins stack and up arrow. Flat vector icon isolated on white. Economy, finance, money symbol. Currency pictogram.
Free with trial Wooden blocks with arrow up, down icons sitting atop stacks of coins. Concept of financial growth decrease, economic market risk, business, banking, finance investment. Increase decrease graph illustrations Wooden blocks with arrow up, down icons sitting atop stacks of coins. Concept of financial growth decrease, economic market risk
Free with trial Purple and gray light graph. Motion. A point moving along a graph line that goes up and down in animation. High quality 4k footage. Increase decrease graph illustrations Purple and gray light graph. Motion.A point moving along a graph line that goes up and down in animation.