Free with trial Collection of simple black vector icons representing financial charts, data analysis graphs, and business statistics. Includes trend arrows, magnifier, and settings symbols. Increase decrease graph illustrations Set of black business graph and chart icons for data analysis. Collection of simple black vector icons representing financial charts, data analysis graphs, and business statistics. Includes trend arrows, magnifier, and settings symbols
Free with trial Stacked coins increase in height with wooden blocks spelling "COST," beside a red arrow pointing left, symbolizing cost reduction or decreasing expenses. Increase decrease graph illustrations Coins increase in height with wooden blocks spelling \'COST,\' beside a red arrow pointing left, cost reduction. Stacked coins increase in height with wooden blocks spelling "COST," beside a red arrow pointing left, symbolizing cost reduction or decreasing expenses.
Free with trial A document with bar and line graphs is being examined with a magnifying glass. This suggests a detailed analysis of data, trends, and insights. It is isolated on white background. Increase decrease graph vectors Vector art of analyzing data with a magnifying glass on a report it shows bar graphs and a line graph indicating trends and. A document with bar and line graphs is being examined with a magnifying glass. This suggests a detailed analysis of data, trends, and insights. It is isolated on white background
Free with trial The image shows an easel holding a canvas with a bar chart. The bar chart displays a series of green vertical bars that initially increase in height but then decrease, illustrating a downward trend. A red line with an arrowhead at the end emphasizes the declining trend. Increase decrease graph illustrations Illustration of a bar chart on an easel showing a downward trend. The image shows an easel holding a canvas with a bar chart. The bar chart displays a series of green vertical bars that initially increase in height but then decrease, illustrating a downward trend. A red line with an arrowhead at the end emphasizes the declining trend
Free with trial Collection of colorful and modern chart and graph icons for business presentations reports and web applications Illustrates various data visualization methods and analytics Perfect for illustrating business success and data trends. Generative AI. Increase decrease graph illustrations Colorful Data Charts Graphs Icons Business Infographic Elements. Collection of colorful and modern chart and graph icons for business presentations reports and web applications Illustrates various data visualization methods and analytics Perfect for illustrating business success and data trends. Generative AI
Free with trial A detailed close-up shot of a stock market chart display featuring multiple graphs and charts divided into sections representing different market aspects, including a red line graph labeled OTC Markets, a blue line graph showing a downward trend, another section with an upward trend marked by a red downward arrow, and additional charts on the right side displaying stock performance over time with. Increase decrease graph illustrations Close-up view of multiple stock market charts and graphs showing OTC markets performance with upward and downward trends. A detailed close-up shot of a stock market chart display featuring multiple graphs and charts divided into sections representing different market aspects, including a red line graph labeled OTC Markets, a blue line graph showing a downward trend, another section with an upward trend marked by a red downward arrow, and additional charts on the right side displaying stock performance over time with
Free with trial Red arrows illustrate upward and downward trends among scattered gold coins and stacks. Increase decrease graph vectors Financial graph showing rise and fall with stacks of gold coins. Red arrows illustrate upward and downward trends among scattered gold coins and stacks
Free with trial This line graph depicts the fluctuating values over a period of four weeks. The values show significant peaks and troughs, indicating variability in the measured parameter. Increase decrease graph illustrations Weekly value fluctuations over four weeks. This line graph depicts the fluctuating values over a period of four weeks. The values show significant peaks and troughs, indicating variability in the measured parameter
Free with trial A collection of nine black depicting various business charts and graphs including bar charts pie charts and line graphs against a white background. Increase decrease graph vectors Set of black business analytics and data charts graph statistics. A collection of nine black depicting various business charts and graphs including bar charts pie charts and line graphs against a white background
Free with trial A black bar chart histogram with varying height bars, tallest in the center, on white. Increase decrease graph illustrations Black Bar Chart Histogram with Tallest Center Bar on White graph data. A black bar chart histogram with varying height bars, tallest in the center, on white
Free with trial The image features two bar graphs isolated on a white background. The graph on the left has green bars with an upward green arrow indicating growth or increase. The graph on the right has red bars with a downward red arrow indicating decline or decrease. The image is simple and uses contrasting colors for clear visual representation. Increase decrease graph illustrations Green and red bar graphs with arrows isolated on white background. The image features two bar graphs isolated on a white background. The graph on the left has green bars with an upward green arrow indicating growth or increase. The graph on the right has red bars with a downward red arrow indicating decline or decrease. The image is simple and uses contrasting colors for clear visual representation
Free with trial The image shows a stylized line graph with a bold upward arrow indicating growth or positive trend, followed by a downward arrow suggesting a dip or decline. The arrows are rendered in a teal color and have a modern, minimalist design. Increase decrease graph illustrations Graphic depicting upward and downward trend with bold arrow design. The image shows a stylized line graph with a bold upward arrow indicating growth or positive trend, followed by a downward arrow suggesting a dip or decline. The arrows are rendered in a teal color and have a modern, minimalist design
Free with trial A white background hosts two prominent 3D rendered thermometers, one red for "HOT" and one blue for "COLD," displaying contrasting temperature levels. Various weather are scattered around them, including suns, clouds with rain, and a snowflake. To the left, red up and down arrows signify rising and falling trends, while to the right, a bar graph with red and blue bars data or statistics,. Increase decrease graph illustrations Hot and cold thermometers with weather and up down arrows. A white background hosts two prominent 3D rendered thermometers, one red for "HOT" and one blue for "COLD," displaying contrasting temperature levels. Various weather are scattered around them, including suns, clouds with rain, and a snowflake. To the left, red up and down arrows signify rising and falling trends, while to the right, a bar graph with red and blue bars data or statistics,
Free with trial A visually appealing bar chart composed of colorful blocks arranged to represent fluctuating data and growth patterns. Increase decrease graph illustrations Colorful bar graph showing upward and downward trends on a clean white surface. A visually appealing bar chart composed of colorful blocks arranged to represent fluctuating data and growth patterns
Free with trial A 3D bar chart with red, blue, and orange bars displayed on a white board with a red frame and easel legs. Isolated on a transparent background. Increase decrease graph vectors 3 D Bar Chart on Easel isolated on a transparent background graph data. A 3D bar chart with red, blue, and orange bars displayed on a white board with a red frame and easel legs. Isolated on a transparent background
Free with trial House icon on wooden cube from stack block with percent and rise arrow, Real estate property investment concept. Asset management, Interest rates, inflation, loan mortgage, increase tax. 3d render. Increase decrease graph illustrations House icon on wooden cube from stack block with percent and rise arrow
Free with trial This graph illustrates the fluctuations in value over a six-month period, from January to June. The values show significant peaks in February, April, and June, indicating periods of high value, while March, May, and June exhibit lower values. Increase decrease graph illustrations Monthly value fluctuations from january to june. This graph illustrates the fluctuations in value over a six-month period, from January to June. The values show significant peaks in February, April, and June, indicating periods of high value, while March, May, and June exhibit lower values
Free with trial A cheerful 3D-rendered cartoon businessman sits confidently beside a rising bar graph, holding a pie chart, symbolizing successful business growth and financial planning. He appears relaxed and optimistic, suggesting achievement and future prosperity. Increase decrease graph illustrations Smiling 3D Cartoon Businessman Analyzing Financial Growth Charts. A cheerful 3D-rendered cartoon businessman sits confidently beside a rising bar graph, holding a pie chart, symbolizing successful business growth and financial planning. He appears relaxed and optimistic, suggesting achievement and future prosperity.
Free with trial The image depicts two business professionals closely examining performance graphs. On the left, a person is looking at a declining trend graph marked with an 'X,' symbolizing failure or underperformance. On the right, another person is inspecting an upward trending graph with a checkmark, indicating success or positive growth. The visual emphasizes the importance of analyzing data trends to. Increase decrease graph illustrations Analyzing performance trends: failure versus success in business metrics. The image depicts two business professionals closely examining performance graphs. On. The image depicts two business professionals closely examining performance graphs. On the left, a person is looking at a declining trend graph marked with an 'X,' symbolizing failure or underperformance. On the right, another person is inspecting an upward trending graph with a checkmark, indicating success or positive growth. The visual emphasizes the importance of analyzing data trends to
Free with trial The image depicts a 3D graph with white blocks forming a staircase pattern. A red arrow points downward, indicating a decline, while a blue arrow points upward, signifying growth. The arrows intersect at the base of the staircase. Increase decrease graph illustrations Graphic representation of upward and downward trends with arrows and blocks. The image depicts a 3D graph with white blocks forming a staircase pattern. A red arrow points downward, indicating a decline, while a blue arrow points upward, signifying growth. The arrows intersect at the base of the staircase
Free with trial This image shows a bar graph with red bars indicating a downward trend, followed by green bars showing an upward trend, symbolizing a reversal from negative to positive. Increase decrease graph illustrations A visual representation of a trend reversing from negative to positive. This image shows a bar graph with red bars indicating a downward trend, followed by green bars showing an upward trend, symbolizing a reversal from negative to positive
Free with trial A colorful 3D pie chart, segmented in blue, pink, and teal, is shown against a light purple background. A yellow coin with an upward arrow is positioned above the chart, and a pink coin with a downward arrow is placed beside it. This imagery represents financial data, growth, and decline. Increase decrease graph illustrations Pie Chart with Up and Down Arrows and Coins for Financial Growth graph data. A colorful 3D pie chart, segmented in blue, pink, and teal, is shown against a light purple background. A yellow coin with an upward arrow is positioned above the chart, and a pink coin with a downward arrow is placed beside it. This imagery represents financial data, growth, and decline
Free with trial The image depicts a bar graph with five bars of varying heights, each accompanied by an arrow indicating the direction of change. The bars are colored in shades of blue and green, with the arrows in black. The first bar is the tallest and has a downward arrow, the second bar is shorter with an upward arrow, the third bar is the shortest with a downward arrow, the fourth bar is taller than the. Increase decrease graph illustrations Visual representation of fluctuating data with upward and downward trends. The image depicts a bar graph with five bars of varying heights, each accompanied by an arrow indicating the direction of change. The bars are colored in shades of blue and green, with the arrows in black. The first bar is the tallest and has a downward arrow, the second bar is shorter with an upward arrow, the third bar is the shortest with a downward arrow, the fourth bar is taller than the
Free with trial Three-dimensional cubes arranged in a bar chart formation, representing data or progress. The cubes are colored blue, green, and pink, and are positioned in descending order of height from left to right. They are rendered with soft edges and cast subtle shadows on the white background. Increase decrease graph illustrations Three 3D Bar Chart Cubes in Ascending Order Keywords: bar chart, graph, data, statistics. Three-dimensional cubes arranged in a bar chart formation, representing data or progress. The cubes are colored blue, green, and pink, and are positioned in descending order of height from left to right. They are rendered with soft edges and cast subtle shadows on the white background
Free with trial This 3D rendered image presents a simple bar chart composed of four colored cubes: blue, yellow, red, and white. The cubes are arranged in ascending order of height from left to right, with the red cube being the tallest. They stand on a plain white surface, creating a clean and minimalist visual. The image is isolated on a white background. Increase decrease graph illustrations 3D Bar Chart with Blue Yellow Red and White Cubes on White Background graph data. This 3D rendered image presents a simple bar chart composed of four colored cubes: blue, yellow, red, and white. The cubes are arranged in ascending order of height from left to right, with the red cube being the tallest. They stand on a plain white surface, creating a clean and minimalist visual. The image is isolated on a white background
Free with trial The image illustrates a combination of bar and line graphs to represent business performance trends. The bars show an overall upward trend in growth, while the red line indicates a recent decline after a period of increase. This visualization is often used in financial reports, market analysis, or business presentations to depict fluctuations in data over time, such as revenue, market share, or. Increase decrease graph illustrations Growth and decline in business performance visualized with bar and line graphs. The image illustrates a combination of bar and line graphs to represent business performance trends. The bars show an overall upward trend in growth, while the red line indicates a recent decline after a period of increase. This visualization is often used in financial reports, market analysis, or business presentations to depict fluctuations in data over time, such as revenue, market share, or
Free with trial This 3D illustration depicts a financial report represented by a document with a bar chart and a line graph. The bar chart shows alternating red and blue bars, while a blue line graph with an upward arrow indicates a positive trend. A yellow and purple magnifying glass is positioned over the chart, suggesting analysis and scrutiny. The artwork is set against a subtle light purple background. Increase decrease graph illustrations 3D illustration of a financial report with a magnifying glass and bar chart on a light purple background. This 3D illustration depicts a financial report represented by a document with a bar chart and a line graph. The bar chart shows alternating red and blue bars, while a blue line graph with an upward arrow indicates a positive trend. A yellow and purple magnifying glass is positioned over the chart, suggesting analysis and scrutiny. The artwork is set against a subtle light purple background
Free with trial The image displays a line graph with a yellow line showing fluctuations in data over a blue grid background. The graph illustrates the rise and fall of data points, indicating trends and patterns. Increase decrease graph illustrations A detailed graphical representation of fluctuating data trends over time. The image displays a line graph with a yellow line showing fluctuations in data over a blue grid background. The graph illustrates the rise and fall of data points, indicating trends and patterns
Free with trial This conceptual diagram visualizes the mechanical relationship between sentencing systems and legislation through interlocking gears labeled Sentencing and Legislation connected by red directional arrows, accompanied by a bar graph on the right showing steady increases in steel value with red trend lines, while smaller gears on the left represent legislation and parole subsystems, creating a. Increase decrease graph illustrations Conceptual diagram illustrating the interconnected relationship between sentencing legislation and parole systems as interlocking. This conceptual diagram visualizes the mechanical relationship between sentencing systems and legislation through interlocking gears labeled Sentencing and Legislation connected by red directional arrows, accompanied by a bar graph on the right showing steady increases in steel value with red trend lines, while smaller gears on the left represent legislation and parole subsystems, creating a
Free with trial The image features a line graph showing upward trends and a bar chart with various colored bars representing different data points. Increase decrease graph illustrations Graphs and charts illustrating data trends and comparisons in a colorful display. The image features a line graph showing upward trends and a bar chart with various colored bars representing different data points
Free with trial The image features two yellow piggy banks, one with a bar graph indicating growth and the other surrounded by coins with a downward line graph, symbolizing financial concepts such as savings, investment, and market fluctuations. Increase decrease graph illustrations Financial growth and market fluctuations illustrated with piggy banks and graphs. The image features two yellow piggy banks, one with a bar graph indicating growth and the other surrounded by coins with a downward line graph, symbolizing financial concepts such as savings, investment, and market fluctuations
Free with trial A collection of six distinct financial icons representing concepts like money, exchange, growth, and investment. Perfect for business, finance, and economic presentations. Increase decrease graph illustrations Financial icons set money bag graph arrows coin exchange and growth concepts. A collection of six distinct financial icons representing concepts like money, exchange, growth, and investment. Perfect for business, finance, and economic presentations
Free with trial This is an detailed collection of minimalist line icons representing various business graphs and data trends. Increase decrease graph vectors Professional business graph and data visualization line icon set for reports. This is an detailed collection of minimalist line icons representing various business graphs and data trends
Free with trial Detailed collection of linear icons representing various business trends, financial growth metrics, and candlestick market data. Increase decrease graph vectors Financial business graph and chart line icons for data analysis and kpi tracking. detailed collection of linear icons representing various business trends, financial growth metrics, and candlestick market data
Free with trial A simple line graph two colored lines, blue and green, with circular data points indicating trends against a white background. Increase decrease graph illustrations Two distinct colored lines with circular markers charting upward and downward trends on a white background. A simple line graph two colored lines, blue and green, with circular data points indicating trends against a white background
Free with trial This 3D illustration depicts a purple calculator as the central element, set against a clean white background. Various colorful, stylized icons float around it, representing concepts related to business and finance. The icons include a percentage sign, an upward trend graph, a dollar sign, a notification bell, and a message bubble. The composition suggests themes of accounting, financial analysis. Increase decrease graph illustrations A purple calculator surrounded by business and financial icons in a 3d cartoon style. This 3D illustration depicts a purple calculator as the central element, set against a clean white background. Various colorful, stylized icons float around it, representing concepts related to business and finance. The icons include a percentage sign, an upward trend graph, a dollar sign, a notification bell, and a message bubble. The composition suggests themes of accounting, financial analysis
Free with trial A 3D bar chart made of red and blue cubes arranged in ascending and descending steps against a white background. Increase decrease graph illustrations 3D Red and Blue Cubes Arranged in Ascending Bar Chart Formation on White graph data. A 3D bar chart made of red and blue cubes arranged in ascending and descending steps against a white background
Free with trial A businessman in a blue shirt sits at a desk with a laptop, analyzing financial data with a mix of increasing and decreasing graphs and charts, indicating market trends. Increase decrease graph illustrations Businessman analyzing financial data on laptop with increasing and decreasing graph. A businessman in a blue shirt sits at a desk with a laptop, analyzing financial data with a mix of increasing and decreasing graphs and charts, indicating market trends
Free with trial Simple black bar chart with two bars of different heights on a white background graph. Increase decrease graph illustrations Simple black bar chart with two bars of different heights on a white background graph
Free with trial A chart with a growing trend. Financial Flat vector illustration isolated on white background. Increase decrease graph illustrations A graph with a dollar sign. A chart with a growing trend. Financial Flat vector illustration isolated on white background.
Free with trial A 3D bar chart and a partial pie chart illustrating data and growth, with percentage labels, on a white background. Increase decrease graph illustrations 3D Bar Chart and Pie Chart Showing Growth and Data Analysis on White Background graph statistics. A 3D bar chart and a partial pie chart illustrating data and growth, with percentage labels, on a white background
Free with trial The image depicts a bar chart showing a progressive increase in values, likely representing investments or costs, while a red downward-sloping line indicates a decrease in profits or returns over the same period. A green dollar sign emphasizes the financial theme. Increase decrease graph vectors Graphic illustration of declining profits despite increasing investments or costs. The image depicts a bar chart showing a progressive increase in values, likely representing investments or costs, while a red downward-sloping line indicates a decrease in profits or returns over the same period. A green dollar sign emphasizes the financial theme
Free with trial The image depicts a gray ladder with black text on each rung, leaning against a blue background with a subtle white graph. Green and red arrows of varying sizes point up and down, indicating change. The ladder's rungs are labeled with 'position' numbers, and a magnifying glass rests on it. The scene symbolizes growth, progress, and examination in a professional or business context, with the arrows. This image was generated using artificial intelligence. Increase decrease graph illustrations A gray ladder with black text leans on a blue background with green and red arrows pointing up and down showing change in position. The image depicts a gray ladder with black text on each rung, leaning against a blue background with a subtle white graph. Green and red arrows of varying sizes point up and down, indicating change. The ladder's rungs are labeled with 'position' numbers, and a magnifying glass rests on it. The scene symbolizes growth, progress, and examination in a professional or business context, with the arrows. This image was generated using artificial intelligence.
Free with trial The image shows a three-dimensional bar chart with alternating red and green bars, each varying in height. The bars are arranged on a green circular base, suggesting a comparison of data points, possibly financial metrics like stock prices, market performance, or growth analysis. The red bars indicate a decline or negative value, while the green bars suggest an increase or positive value. Increase decrease graph illustrations Colorful 3d bar chart illustration depicting financial market trends or growth metrics. The image shows a three-dimensional bar chart with alternating red and green bars, each varying in height. The bars are arranged on a green circular base, suggesting a comparison of data points, possibly financial metrics like stock prices, market performance, or growth analysis. The red bars indicate a decline or negative value, while the green bars suggest an increase or positive value
Free with trial Line art icon of money decreasing over time with bar graph, representing the concept of inflation. Increase decrease graph vectors Money decreasing over time showing inflation concept. Line art icon of money decreasing over time with bar graph, representing the concept of inflation
Free with trial Arrow 3d vector illustration. Web design elements, pointer or cursor sign, increase of decrease financial sign. Up and down forward arrow, motion and navigation symbol. Increase decrease graph vectors Arrow navigation pointer, forward upward. Arrow 3d vector illustration. Web design elements, pointer or cursor sign, increase of decrease financial sign. Up and down forward arrow, motion and navigation symbol
Free with trial Oil industry performance represented with weather icons above graph and barrels below, in a simple, clean and modern graphic style. Increase decrease graph vectors Infographic Showing Oil Industry Performance with Weather Elements and Economic Indicators. Oil industry performance represented with weather icons above graph and barrels below, in a simple, clean and modern graphic style.
Free with trial Financial candlestick chart overlaying Baltimore cityscape, silhouetted against amber evening sky, depicting market volatility. Increase decrease graph illustrations Candle stick graph fluctuating over a Baltimore skyline at sunset, showing the ups and downs of the stock market. Financial candlestick chart overlaying Baltimore cityscape, silhouetted against amber evening sky, depicting market volatility
Free with trial A man is presenting business data on a whiteboard, using a laptop. He is explaining the chart and graph to his colleagues. The scene is set in an office. Increase decrease graph illustrations Man presenting business data on a whiteboard with laptop isolated on white background. A man is presenting business data on a whiteboard, using a laptop. He is explaining the chart and graph to his colleagues. The scene is set in an office
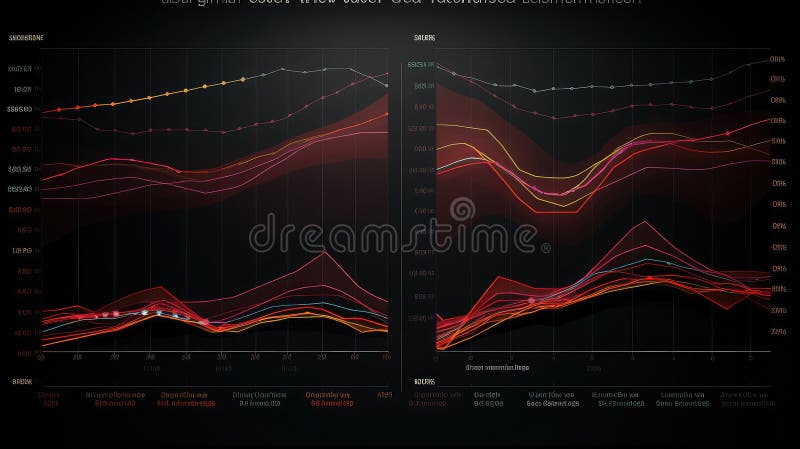
Free with trial This abstract image represents detailed data visualization of financial market trends featuring line graphs and bar charts on a dark backdrop. Increase decrease graph illustrations Abstract Data Visualization of Financial Market Trends with Line Graph and Bar Chart on Dark Background. This abstract image represents detailed data visualization of financial market trends featuring line graphs and bar charts on a dark backdrop
Free with trial Set of chart icons with dollar sign in even silhouette on a white background. The graph shows downward and upward trends. Vector. Increase decrease graph vectors Set of graphic icons with dollar. Set of chart icons with dollar sign in even silhouette on a white background. The graph shows downward and upward trends. Vector
Free with trial Isometric graph with dollar sign. The graph shows a downward trend. Vector. Increase decrease graph vectors Isometric graphic icon with dollar. Isometric graph with dollar sign. The graph shows a downward trend. Vector
Free with trial Simple line graph illustration showing trend fluctuations, ideal for financial concepts. Increase decrease graph illustrations Outline of ups and downs chart vector icon. Simple line graph illustration showing trend fluctuations, ideal for financial concepts
Free with trial Document is being analyzed with a bar graph and pie chart representing market data. Increase decrease graph vectors Document with charts showing market analysis and financial report. Document is being analyzed with a bar graph and pie chart representing market data
Free with trial A professional set of icons depicting various data chart types, including exponential growth, volatility, and linear trends for business analytics and reporting. Increase decrease graph illustrations Collection of professional data graph icons illustrating different growth patterns and financial statistics trends. a professional set of icons depicting various data chart types, including exponential growth, volatility, and linear trends for business analytics and reporting
Free with trial Isometric illustration of a chart board displaying upward and downward trend lines. Increase decrease graph vectors Isometric graph chart with trends on display. Isometric illustration of a chart board displaying upward and downward trend lines
Free with trial This vibrant image features a collection of colorful 3D bar graphs representing data trends, perfect for visualizing statistics in business presentations and analyses. Increase decrease graph illustrations Colorful Bar Graph with 3D Shapes Representing Data Trends and Visualizing Statistics in Business and Finance Environments. This vibrant image features a collection of colorful 3D bar graphs representing data trends, perfect for visualizing statistics in business presentations and analyses
Free with trial This image features an intricate bar graph displaying colorful statistical data trends, perfect for business reports and presentations. Analyze metrics effectively. Increase decrease graph illustrations Colorful Data Visualization with Bar Graphs and Trends Displaying Statistical Information on a White Background. This image features an intricate bar graph displaying colorful statistical data trends, perfect for business reports and presentations. Analyze metrics effectively
Free with trial A three-dimensional chart displaying colorful lines and coin representations illustrates trends in data, highlighting key financial insights and fluctuations over time. Increase decrease graph illustrations Trend Analysis with Colorful Graph Lines and Currency Coins Representing Data Points on a Three-Dimensional Chart. A three-dimensional chart displaying colorful lines and coin representations illustrates trends in data, highlighting key financial insights and fluctuations over time
Free with trial This vibrant image features a collection of colorful 3D bar graphs representing data trends, perfect for visualizing statistics in business presentations and analyses. Increase decrease graph illustrations Colorful Bar Graph with 3D Shapes Representing Data Trends and Visualizing Statistics in Business and Finance Environments. This vibrant image features a collection of colorful 3D bar graphs representing data trends, perfect for visualizing statistics in business presentations and analyses
Free with trial Decrease icon or logo isolated sign symbol vector illustration - Collection of high quality black style vector icons, seles chart icon isolated sign symbol vector illustration - Collection of high quality. Increase decrease graph vectors Decrease icon or logo isolated sign symbol vector illustration
Free with trial Interest growth icon vector logo set collection for web app ui. Increase decrease graph vectors Interest Growth Icon Showing Financial Increase, Investment Success, and Economic Trends. Interest growth icon vector logo set collection for web app ui
Free with trial A visual representation of financial growth, featuring stacked coins and an upward trend graph symbolizing increasing wealth, Generative AI. Increase decrease graph illustrations Stack of coins with a red downward arrow, illustrating the effect of falling interest rates on savings. A visual representation of financial growth, featuring stacked coins and an upward trend graph symbolizing increasing wealth, Generative AI.
Free with trial Interest growth icon logo sign vector outline in black and white color. Increase decrease graph vectors Financial Growth Icon Illustrating Investment Gains, Economic Expansion, and Profit Increase. Interest growth icon logo sign vector outline in black and white color
Free with trial A wooden arrow pointing down is on top of a stack of wooden blocks. The arrow represents a downward trend or a decrease in something generated by AI. Increase decrease graph vectors A wooden arrow pointing down is on top of a stack of wooden blocks generated by AI. A wooden arrow pointing down is on top of a stack of wooden blocks. The arrow represents a downward trend or a decrease in something generated by AI
Free with trial Reduction chart icon Vector symbol or sign set collection in black and white outline. Increase decrease graph vectors Decline Chart Icon Illustrating Decrease in Performance, Economic Downturn, and Analytical Data. Reduction chart icon Vector symbol or sign set collection in black and white outline
Free with trial Set Data analysis, Binary code, Folder and lock, Financial growth, Search data, and decrease icon. Vector. Increase decrease graph vectors Set Data analysis, Binary code, Folder and lock, Financial growth, Search data, and decrease icon. Vector
Free with trial A 3D icon depicting an orange arrow pointing downwards in a zigzag pattern. The icon suggests downward movement, decline, decrease, or negative progress. It's commonly used to represent falling trends, negative changes, or downward movement in data or statistics. Increase decrease graph vectors Arrow Chart Down 3D Icon. A 3D icon depicting an orange arrow pointing downwards in a zigzag pattern. The icon suggests downward movement, decline, decrease, or negative progress. It's commonly used to represent falling trends, negative changes, or downward movement in data or statistics.
Free with trial Trend stretching line chart illustration axis graph, scale plot, point x trend stretching line chart. Increase decrease graph illustrations Trend stretching line chart
Free with trial Stacks of golden coins arranged in ascending order, representing financial growth and investment. The background features a blurred stock market graph, symbolizing market trends and investment opportunities. The image conveys concepts of wealth accumulation, financial planning, and economic prosperity. Suitable for illustrating articles, presentations, or advertisements related to finance, investment, and business. Increase decrease graph illustrations Financial Growth and Investment
Free with trial A minimalist black and white icon representing a financial growth chart. It features a series of vertical bars of varying heights, symbolizing data points or periods, overlaid with a line graph connecting circular nodes. This graphic effectively conveys concepts of financial analysis, business growth, performance tracking, and data visualization. Ideal for presentations, reports, websites, and applications related to finance, economics, and business intelligence. Increase decrease graph vectors Growth Analysis Finance Chart Icon. A minimalist black and white icon representing a financial growth chart. It features a series of vertical bars of varying heights, symbolizing data points or periods, overlaid with a line graph connecting circular nodes. This graphic effectively conveys concepts of financial analysis, business growth, performance tracking, and data visualization. Ideal for presentations, reports, websites, and applications related to finance, economics, and business intelligence.
Free with trial Comparison comparing data illustration analysis graph, traffic website, overlay divergence comparison comparing data. Increase decrease graph illustrations Comparison comparing data
Free with trial A visually striking image capturing a bar chart, line graph, and pie chart meticulously drawn in the wet sand on a beach. The artwork is illuminated by the warm, golden light of a sunset, with gentle waves lapping at the shore. This represents concepts of financial growth, market analysis, and business success in a unique, natural setting. The image evokes themes of planning, progress, and the cyclical nature of markets. Increase decrease graph illustrations Financial Growth Chart and Pie Chart Drawn in Sand at Sunset. A visually striking image capturing a bar chart, line graph, and pie chart meticulously drawn in the wet sand on a beach. The artwork is illuminated by the warm, golden light of a sunset, with gentle waves lapping at the shore. This represents concepts of financial growth, market analysis, and business success in a unique, natural setting. The image evokes themes of planning, progress, and the cyclical nature of markets.
Free with trial Three orange bar graphs illustrating different data patterns increasing, decreasing, and varied. Ideal for presentations or data visualization. Simple and visually appealing design. Increase decrease graph illustrations Orange Bar Graph Variations. Three orange bar graphs illustrating different data patterns increasing, decreasing, and varied. Ideal for presentations or data visualization. Simple and visually appealing design.
Free with trial A collection of hand-drawn, black and white icons representing growth, decline, and financial concepts. The set includes upward and downward arrows, percentage symbols, and a bar graph illustrating trends. The simple line art style makes these icons versatile for various applications, including presentations, infographics, and website design. They convey concepts of progress, success, loss, and market fluctuations. Increase decrease graph illustrations Growth and Decline Icons Set. A collection of hand-drawn, black and white icons representing growth, decline, and financial concepts. The set includes upward and downward arrows, percentage symbols, and a bar graph illustrating trends. The simple line art style makes these icons versatile for various applications, including presentations, infographics, and website design. They convey concepts of progress, success, loss, and market fluctuations.
Free with trial A row of colorful wooden blocks, resembling a bar graph, sits on a dark wooden surface. The blocks are various heights and colors, creating a visually appealing and potentially symbolic representation of growth or data. Increase decrease graph illustrations Colorful Wooden Blocks Chart. A row of colorful wooden blocks, resembling a bar graph, sits on a dark wooden surface. The blocks are various heights and colors, creating a visually appealing and potentially symbolic representation of growth or data.