Free with trial Business graph is being drawn on a piece of paper with a pencil. Infographic financial growth decrease illustrations Pencil drawing business graph on paper with pie chart. Business graph is being drawn on a piece of paper with a pencil
Free with trial Vibrant bar chart visualization with dark background displaying data trends ,Generative ai. Infographic financial growth decrease illustrations Colorful bar chart on dark background, data visualization for business performance analysis and trend insights. Vibrant bar chart visualization with dark background displaying data trends ,Generative ai
Free with trial Red glossy arrow pointing upwards isolated on white background. Direction guide. Close-up. Infographic financial growth decrease illustrations Red glossy arrow pointing upwards isolated on white background. Direction guide
Free with trial 3d illustration of a percentage symbol standing on a pyramid pointing down. Infographic financial growth decrease vectors Percentage symbol standing on a pyramid pointing down
Free with trial A conceptual business image showing a torn paper design with a red downward arrow cutting through the center, symbolizing financial decline. The top portion displays a black and white line graph trending downward, while the bottom reveals bold 'PROFIT LOSS' text and placeholder text below. Ideal for illustrating economic downturn, company loss, financial crisis, negative growth, or poor performance in business reports and presentations. Infographic financial growth decrease illustrations Red Arrow Piercing Paper Over Profit Loss Report with Declining Graph. A conceptual business image showing a torn paper design with a red downward arrow cutting through the center, symbolizing financial decline. The top portion displays a black and white line graph trending downward, while the bottom reveals bold 'PROFIT LOSS' text and placeholder text below. Ideal for illustrating economic downturn, company loss, financial crisis, negative growth, or poor performance in business reports and presentations.
Free with trial Statistics icon set, bar diagram illustration, business graph logo icon vector. Infographic financial growth decrease vectors Statistics icon set, bar diagram illustration, business graph logo icon vector
Free with trial White Bar Chart Decreasing on Blue Background. Infographic financial growth decrease illustrations White Bar Chart Decreasing on Blue Background
Free with trial Colorful graph chart is showing and comparing different data results with lines and dots. Infographic financial growth decrease vectors Colorful graph chart showing different data comparing results. Colorful graph chart is showing and comparing different data results with lines and dots
Free with trial If you are looking for business illustration set, wait no more. We are excited to share these business activities illustration. The simple yet conceptual money illustration collection is must to have for designing finance, money flow, banking, business and other such design projects. Infographic financial growth decrease vectors Set of Business Activities Isometric Illustrations. If you are looking for business illustration set, wait no more. We are excited to share these business activities illustration.The simple yet conceptual money illustration collection is must to have for designing finance, money flow, banking, business and other such design projects
Free with trial Strategic Decisions: Integrating Business Analytics with Strategic Thinking. This visual portrays the dynamic interaction between business analytics and strategic thinking, showcasing how analytical insights drive strategic planning and decision-making. It emphasizes the synergy between data analysis and strategic foresight in achieving business goals. --chaos 10 --ar 16:9 --style raw --stylize, aesthetic wallpaper background. Infographic financial growth decrease illustrations Colorful Pie Charts and Bar Graphs on a White Paper. Strategic Decisions: Integrating Business Analytics with Strategic Thinking. This visual portrays the dynamic interaction between business analytics and strategic thinking, showcasing how analytical insights drive strategic planning and decision-making. It emphasizes the synergy between data analysis and strategic foresight in achieving business goals. --chaos 10 --ar 16:9 --style raw --stylize, aesthetic wallpaper background
Free with trial Business graphic chart line, round and candlestick graph trend with glassmorphism effect. Transparent blur glass on gradient arrow vector set. Financial diagram on black. Marketing analytics. Infographic financial growth decrease illustrations Business graphic chart line round and candlestick graph trend with glassmorphism effect vector set, arrows on black. Business graphic chart line, round and candlestick graph trend with glassmorphism effect. Transparent blur glass on gradient arrow vector set. Financial diagram on black. Marketing analytics
Free with trial Ascending and descending graph set. Vector illustration. Infographic financial growth decrease vectors Ascending and descending graph set.
Free with trial Opportunity cost to compare the return of best foregone option and the chosen option vector. Infographic financial growth decrease vectors Opportunity cost to compare the return of best foregone option and the chosen option
Free with trial Creative Up and Down Arrow Set with Percentage for Business and Finance and Pictogram Element Vector Illustration Isolated on Transparent Background. Infographic financial growth decrease vectors Up and Down Arrow with Percent Set Icon Clipart Vector Illustration. Creative Up and Down Arrow Set with Percentage for Business and Finance and Pictogram Element Vector Illustration Isolated on Transparent Background
Free with trial A vibrant 3D representation of a business graph and chart, showcasing data analysis and financial trends with colorful bars and a dynamic line, isolated on a clean white background. Infographic financial growth decrease illustrations 3d graph and chart icons isolated on white background. A vibrant 3D representation of a business graph and chart, showcasing data analysis and financial trends with colorful bars and a dynamic line, isolated on a clean white background
Free with trial Archive market leadership icon logo sign vector outline in black and white color. Infographic financial growth decrease vectors Market Leadership and Strategy Icon Inspired by Chess Tactics. Archive market leadership icon logo sign vector outline in black and white color
Free with trial Line icon of a flip chart showing decreasing bars, suggesting a negative trend during a business presentation. Infographic financial growth decrease vectors Flip chart showing decreasing bars graphic for business presentation. Line icon of a flip chart showing decreasing bars, suggesting a negative trend during a business presentation
Free with trial Up and Down Arrow Set with Percentage for Business and Finance and Pictogram Element Vector Illustration Isolated on Transparent Background. Infographic financial growth decrease vectors Percentage with Up and Down Arrow Set Icon Clip art Vector Illustration. Up and Down Arrow Set with Percentage for Business and Finance and Pictogram Element Vector Illustration Isolated on Transparent Background
Free with trial Three isometric 3D bar chart columns with a gradient color fill on a light background. Infographic financial growth decrease illustrations Three Isometric 3D Bar Chart Columns with Gradient Colors. Three isometric 3D bar chart columns with a gradient color fill on a light background
Free with trial Up and Down Arrow Set with Percentage for Business and Finance and Pictogram Element Vector Illustration Isolated on Transparent Background. Infographic financial growth decrease vectors Creative Percentage Up and Down Arrow Set Icon Clipart Vector Illustration. Up and Down Arrow Set with Percentage for Business and Finance and Pictogram Element Vector Illustration Isolated on Transparent Background
Free with trial Nine simple black line illustrations of various charts and graphs. Infographic financial growth decrease vectors Collection of Hand Drawn Charts and Graphs for Data Visualization. Nine simple black line illustrations of various charts and graphs
Free with trial Line graph icons set simple clean and smooth line and fill vector icons in black on a white background. Infographic financial growth decrease vectors Line graph icons set simple clean and smooth line and fill vector icons in black
Free with trial White stone arrow pointing right on pink backdrop. Direction guide. Close-up. Infographic financial growth decrease illustrations White stone arrow pointing right on pink backdrop. Direction guide
Free with trial Business chart is displaying market data analytics with a candlestick chart, pie chart and line graph. Infographic financial growth decrease vectors Business chart displaying market data analytics with candlestick chart, pie chart and line graph
Free with trial Digita blue bar charts descend steadily across a digital grid, illustrating a decline in financial performance and market trends. Downward arrows emphasize loss, negative growth, and economic challenges, while smooth transitions and a tech-inspired layout enhance the visual impact of the data downturn. Infographic financial growth decrease illustrations Digital blue bar chart with decreasing business concept. Digita blue bar charts descend steadily across a digital grid, illustrating a decline in financial performance and market trends. Downward arrows emphasize loss, negative growth, and economic challenges, while smooth transitions and a tech-inspired layout enhance the visual impact of the data downturn.
Free with trial White stone arrow pointing right on black backdrop. Direction guide. Close-up. Infographic financial growth decrease illustrations White stone arrow pointing right on black backdrop. Direction guide
Free with trial Presentation board with decreasing bar graph for business statistics. Infographic financial growth decrease vectors Presentation board with decreasing bar graph for business statistics
Free with trial White stone arrow pointing right on yellow backdrop. Direction guide. Close-up. Infographic financial growth decrease illustrations White stone arrow pointing right on yellow backdrop. Direction guide
Free with trial Up and down graph icon on black circle. Outline bar chart with uptrend and downtrend arrow symbol vector. Infographic financial growth decrease vectors Up and down graph icon on black circle. Outline bar chart with uptrend and downtrend arrow symbol
Free with trial Simple bar graph showing downward trend with arrow, decline in progress. Infographic financial growth decrease vectors Simple bar graph showing downward trend with arrow, decline in progress
Free with trial Up and down graph icon vector in circular line. Outline bar chart with uptrend and downtrend arrow symbol. Infographic financial growth decrease vectors Up and down graph icon in circular line. Outline bar chart with uptrend and downtrend arrow symbol
Free with trial Downward trending chart with a declining arrow in vector illustration. Infographic financial growth decrease vectors Downward trending chart with a declining arrow in vector illustration
Free with trial A bold blue percentage symbol, 3D-rendered, ideal for financial, statistical, and business presentations. Clean design. Infographic financial growth decrease illustrations Blue percentage symbol isolated on white background for finance concepts. A bold blue percentage symbol, 3D-rendered, ideal for financial, statistical, and business presentations. Clean design
Free with trial Simple bar chart graphic with rising and falling columns of varying heights. Infographic financial growth decrease vectors Simple bar chart graphic with rising and falling columns of varying heights
Free with trial Teal bar chart illustration for data visualization and statistical analysis. Infographic financial growth decrease vectors Teal bar chart illustration for data visualization and statistical analysis
Free with trial A 3D rendering features a bar graph with three vertical bars in blue and yellow. Above the graph, a molecular structure is depicted with a central yellow sphere connected to three blue spheres by white rods. The entire graphic is isolated on a clean white background. Infographic financial growth decrease illustrations 3D bar graph with molecular structure above on a white background chart data. A 3D rendering features a bar graph with three vertical bars in blue and yellow. Above the graph, a molecular structure is depicted with a central yellow sphere connected to three blue spheres by white rods. The entire graphic is isolated on a clean white background
Free with trial A series of wooden blocks, each marked with a percentage symbol, form a descending staircase. A bold red arrow dramatically points downwards, symbolizing financial decline. Infographic financial growth decrease illustrations A red arrow graph shows a sharp decline, indicating a significant drop in percentages. A series of wooden blocks, each marked with a percentage symbol, form a descending staircase. A bold red arrow dramatically points downwards, symbolizing financial decline
Free with trial Graph going Up and Down sign with green and red arrows vector set. Flat design vector set of a concept of sales bar chart symbol icon with arrow moving down and sales bar chart with arrow moving up. Infographic financial growth decrease vectors Graph going Up and Down sign with green and red arrows vector set. Vector set of a concept of sales bar chart symbol icon. Graph going Up and Down sign with green and red arrows vector set. Flat design vector set of a concept of sales bar chart symbol icon with arrow moving down and sales bar chart with arrow moving up.
Free with trial Yellow glossy arrow pointing right. Isolated on white background. Direction guide. Close-up. Infographic financial growth decrease illustrations Yellow glossy arrow pointing right. Isolated on white background. Direction guide
Free with trial Up and Down sign with green and red arrows set vector illustration. Set of a Concept of sales bar chart symbol icon with arrow moving down and sales bar chart with arrow moving up. Infographic financial growth decrease vectors Up and Down sign with green and red arrows set vector illustration. Set of a Concept of sales bar chart symbol icon with arrows. Up and Down sign with green and red arrows set vector illustration. Set of a Concept of sales bar chart symbol icon with arrow moving down and sales bar chart with arrow moving up.
Free with trial Graph going Up and Down with red arrows vector. Blue chart bar vector illustration concept of sales bar chart symbol icon with arrow moving down and sales bar chart with arrow moving up. Infographic financial growth decrease vectors Graph going Up and Down with red arrows vector. Blue chart bar vector illustration concept of sales bar chart symbol icon
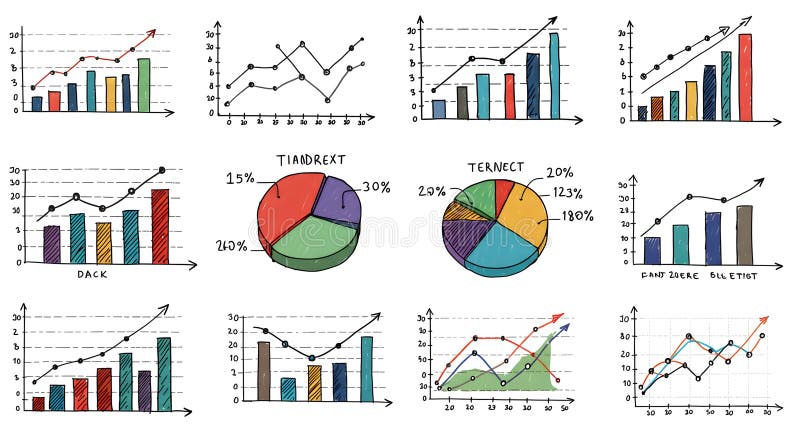
Free with trial A collection of hand-drawn style charts and diagrams that can be used to display data and analyze progress, ideal for business presentations, reports, or data visualizations. Infographic financial growth decrease illustrations Hand-Drawn Collection of Statistical Charts and Diagrams for Business Analytics. A collection of hand-drawn style charts and diagrams that can be used to display data and analyze progress, ideal for business presentations, reports, or data visualizations
Free with trial Graph going Up and Down with green and red arrows vector. Blue chart bar vector illustration concept of sales bar chart symbol icon with arrow moving down and sales bar chart with arrow moving up. Infographic financial growth decrease vectors Graph going Up and Down with green and red arrows vector. Blue chart bar vector illustration concept of sales bar chart symbol. Graph going Up and Down with green and red arrows vector. Blue chart bar vector illustration concept of sales bar chart symbol icon with arrow moving down and sales bar chart with arrow moving up.
Free with trial Colorful bar chart on a blue background illustrating data trends ,Generative ai. Infographic financial growth decrease illustrations Vibrant bar chart on blue background, visualizing data trends and insights colorful. Colorful bar chart on a blue background illustrating data trends ,Generative ai
Free with trial Downward trend chart with falling interest rates or discounts depicted by price tag. Infographic financial growth decrease vectors Downward trend chart with falling interest rates or discounts depicted by price tag
Free with trial A 3D bar chart displays four bars in descending order of height: green, purple, blue, and pink, set against a white background. Clear details and vibrant colors enhance visual appeal. Infographic financial growth decrease illustrations 3D Bar Chart With Green Purple Blue And Pink Bars In Descending Order graph decrease. A 3D bar chart displays four bars in descending order of height: green. A 3D bar chart displays four bars in descending order of height: green, purple, blue, and pink, set against a white background. Clear details and vibrant colors enhance visual appeal
Free with trial 3D Pie chart icon. Circle divided into parts statistical diagram vector illustration. 3D render. Infographic financial growth decrease vectors 3D Pie chart icon circle divided into parts statistical diagram vector illustration. 3D render.
Free with trial Outline bar chart icon vector with upward and downward trend arrow. Uptrend and downtrend business graph symbol in black circle. Infographic financial growth decrease vectors Outline bar chart icon with upward and downward trend arrow. Uptrend and downtrend business graph symbol in black circle
Free with trial Graph going Up and Down sign with blue arrows vector. Flat design vector illustration concept of sales bar chart symbol icon with arrow moving down and sales bar chart with arrow moving up. Infographic financial growth decrease vectors Graph going Up and Down sign with blue arrows vector. Flat design vector illustration concept of sales bar chart symbol icon. Graph going Up and Down sign with blue arrows vector. Flat design vector illustration concept of sales bar chart symbol icon with arrow moving down and sales bar chart with arrow moving up.
Free with trial Wooden Blocks Arranged with a Declining Graph and Arrow Pointing Down on a Red Background Symbolizing Market Analytics and Economic Downturn Concept for Business Finance and Investment Strategies generative ai. Infographic financial growth decrease illustrations Wooden Blocks with Declining Graph and Arrow Representing Market Analytics for Economic Downturn. Wooden Blocks Arranged with a Declining Graph and Arrow Pointing Down on a Red Background Symbolizing Market Analytics and Economic Downturn Concept for Business Finance and Investment Strategies generative ai
Free with trial Colorful bar graph showing data and trends, perfect for business, finance, or analytics presentations. EPS 10. Infographic financial growth decrease vectors Colorful bar graph showing data and trends, perfect for business, finance, or analytics presentations.
Free with trial Chart icons for data analysis vector art design, Minimalist business charts icons bar graphs, line graphs, and pie charts vector illustration on white background the image is generated using AI. Infographic financial growth decrease vectors Chart icons for data analysis vector art design, Minimalist business charts icons bar graphs, line graphs, and pie charts vector
Free with trial Two sets of three dimensional bar charts. One set shows ascending bars in light colors, shows bars in yellow, beige with decreasing trend. Visual representation aids in data analysis. Infographic financial growth decrease illustrations Two sets of three dimensional bar charts. One set shows ascending bars in light colors, shows bars in yellow, beige with
Free with trial Up and Down sign with green and red arrows vector illustration. Concept of sales bar chart symbol icon with arrow moving down and sales bar chart with arrow moving up. Infographic financial growth decrease vectors Up and Down sign with green and red arrows vector illustration. Concept of sales bar chart symbol icon
Free with trial This compelling stock image showcases a stark red arrow pointing downwards, a powerful visual representation of decline. The minimalist design focuses solely on the downward trend, making the message of negative movement immediately apparent. Perfect for conveying a range of concepts, from a downturn in business performance to a falling market share or a project that's fallen behind schedule. Infographic financial growth decrease illustrations Visualizing Declining Trends A Minimalist Stock Photo of a Dramatic Red Arrow Down Illustrating Business Performance. This compelling stock image showcases a stark red arrow pointing downwards, a powerful visual representation of decline. The minimalist design focuses solely on the downward trend, making the message of negative movement immediately apparent. Perfect for conveying a range of concepts, from a downturn in business performance to a falling market share or a project that's fallen behind schedule.
Free with trial This compelling data visualization showcases a clear downward trend, perfect for illustrating declining performance, market share, or other metrics. The dark background provides a striking contrast to the graph's lines, emphasizing the trend's trajectory. The visual clarity makes it an excellent tool for conveying complex information effectively, whether for internal reports, presentations to. Infographic financial growth decrease illustrations Visualizing Declining Trends A Dark Night Graph Depicts a Downward Trajectory in Data Ideal for Reports Presentations. This compelling data visualization showcases a clear downward trend, perfect for illustrating declining performance, market share, or other metrics. The dark background provides a striking contrast to the graph's lines, emphasizing the trend's trajectory. The visual clarity makes it an excellent tool for conveying complex information effectively, whether for internal reports, presentations to
Free with trial Red glossy arrow pointing upwards isolated on white background. Direction guide. Close-up. Infographic financial growth decrease illustrations Red glossy arrow pointing upwards isolated on white background. Direction guide
Free with trial Red glossy arrow pointing upwards isolated on white background. Direction guide. Close-up. Infographic financial growth decrease illustrations Red glossy arrow pointing upwards isolated on white background. Direction guide
Free with trial Red glossy arrow pointing upwards isolated on white background. Direction guide. Close-up. Infographic financial growth decrease illustrations Red glossy arrow pointing upwards isolated on white background. Direction guide
Free with trial Red glossy arrow pointing upwards isolated on white background. Direction guide. Close-up. Infographic financial growth decrease illustrations Red glossy arrow pointing upwards isolated on white background. Direction guide
Free with trial Red glossy arrow pointing upwards isolated on white background. Direction guide. Close-up. Infographic financial growth decrease illustrations Red glossy arrow pointing upwards isolated on white background. Direction guide
Free with trial Red glossy arrow pointing upwards isolated on white background. Direction guide. Close-up. Infographic financial growth decrease illustrations Red glossy arrow pointing upwards isolated on white background. Direction guide
Free with trial Red glossy arrow pointing upwards isolated on white background. Direction guide. Close-up. Infographic financial growth decrease illustrations Red glossy arrow pointing upwards isolated on white background. Direction guide
Free with trial Red glossy arrow pointing upwards isolated on white background. Direction guide. Close-up. Infographic financial growth decrease illustrations Red glossy arrow pointing upwards isolated on white background. Direction guide
Free with trial Green glossy arrow pointing upwards isolated on white background. Direction guide. Close-up. Infographic financial growth decrease illustrations Green glossy arrow pointing upwards isolated on white background. Direction guide
Free with trial Green glossy arrow pointing upwards isolated on white background. Direction guide. Close-up. Infographic financial growth decrease illustrations Green glossy arrow pointing upwards isolated on white background. Direction guide
Free with trial Green glossy arrow pointing upwards isolated on white background. Direction guide. Close-up. Infographic financial growth decrease illustrations Green glossy arrow pointing upwards isolated on white background. Direction guide
Free with trial Green glossy arrow pointing upwards isolated on white background. Direction guide. Close-up. Infographic financial growth decrease illustrations Green glossy arrow pointing upwards isolated on white background. Direction guide
Free with trial Green glossy arrow pointing upwards isolated on white background. Direction guide. Close-up. Infographic financial growth decrease illustrations Green glossy arrow pointing upwards isolated on white background. Direction guide
Free with trial Red wooden arrow points downwards on black background. Image suggests market decline economic crisis. Closeup view shows details of arrow. Potential themes include business loss. Infographic financial growth decrease illustrations Red wooden arrow points downwards on black background. Image suggests market decline economic crisis. Closeup view shows details
Free with trial Graph going Up and Down sign with green and red arrows vector. Flat design vector illustration concept of sales bar chart symbol icon with arrow moving down and sales bar chart with arrow moving up. Infographic financial growth decrease vectors Graph going Up and Down sign with green and red arrows vector. Flat design vector illustration concept of sales bar chart symbol
Free with trial Animation with values of currency exchange rate chart. Motion. Moving stylish chart of bank currencies on stock exchange. Chart with currency values and changing line indicators. Infographic financial growth decrease illustrations Animation with values of currency exchange rate chart. Motion. Moving stylish chart of bank currencies on stock exchange
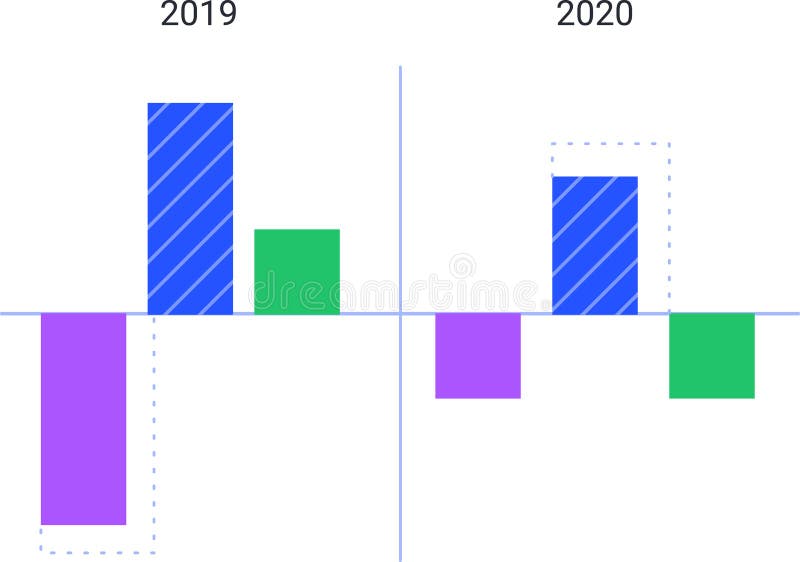
Free with trial Colorful bar charts are comparing data from 2019 and 2020, visualizing trends and statistics with positive and negative values represented by upward and downward bars. Infographic financial growth decrease vectors Colorful bar charts are comparing data from 2019 and 2020, visualizing trends and statistics with positive and negative
Free with trial Colorful bar charts are comparing data from 2019 and 2020, visualizing trends and statistics with positive and negative values represented by upward and downward bars. Infographic financial growth decrease illustrations Colorful bar charts are comparing data from 2019 and 2020, visualizing trends and statistics with positive and negative
Free with trial Set line Pie chart infographic, Financial growth decrease and Hierarchy organogram. Business infographic template. Vector. Infographic financial growth decrease vectors Set line Pie chart infographic, Financial growth decrease and Hierarchy organogram. Business infographic template
Free with trial Set line Financial growth decrease Data analysis Pie chart infographic Search cloud computing Mind map and Cloud download and upload icon. Vector. Infographic financial growth decrease vectors Set line Financial growth decrease, Data analysis, Pie chart infographic, Search cloud computing, Mind map and Cloud. Set line Financial growth decrease Data analysis Pie chart infographic Search cloud computing Mind map and Cloud download and upload icon. Vector.
Free with trial Set Mind map infographic Financial growth decrease Calculator Binary code Search cloud computing Cloud lock and Data analysis icon. Vector. Infographic financial growth decrease illustrations Set Mind map infographic, Financial growth decrease, Calculator, Binary code, Search cloud computing, Cloud lock, and. Set Mind map infographic Financial growth decrease Calculator Binary code Search cloud computing Cloud lock and Data analysis icon. Vector.
Free with trial Set Financial growth decrease, Arrow, Pie chart infographic and Pyramid infographics on wooden background. Vector. Infographic financial growth decrease illustrations Set Financial growth decrease, Arrow, Pie chart infographic and Pyramid infographics on wooden background. Vector
Free with trial Set line Pie chart infographic, Graph, chart, diagram, Project team base and Financial growth decrease icon. Vector. Infographic financial growth decrease vectors Set line Pie chart infographic, Graph, chart, diagram, Project team base and Financial growth decrease icon. Vector
Free with trial Set Arrow Many ways directional arrow Financial growth increase Unknown search decrease Pie chart infographic and Digital speed meter icon. Vector. Infographic financial growth decrease vectors Set Arrow, Many ways directional arrow, Financial growth increase, Unknown search, decrease, Pie chart infographic and. Set Arrow Many ways directional arrow Financial growth increase Unknown search decrease Pie chart infographic and Digital speed meter icon. Vector.