Free with trial Financial data analysis bar chart icon with upward trend showing business growth. Infographic financial growth decrease vectors Financial data analysis bar chart icon with upward trend showing business growth
Free with trial Modern icon set featuring financial growth and decline symbols for business analysis. Infographic financial growth decrease vectors Modern icon set featuring financial growth and decline symbols for business analysis
Free with trial Set line Hierarchy organogram chart Many ways directional arrow Graph diagram Dollar symbol Financial growth decrease Clock Intersection point and Arrow icon. Vector. Infographic financial growth decrease vectors Set line Hierarchy organogram chart, Many ways directional arrow, Graph, diagram, Dollar symbol, Financial growth. Set line Hierarchy organogram chart Many ways directional arrow Graph diagram Dollar symbol Financial growth decrease Clock Intersection point and Arrow icon. Vector.
Free with trial Modern graphic business charts set featuring financial growth and decline for data visualization. Infographic financial growth decrease vectors Modern graphic business charts set featuring financial growth and decline for data visualization
Free with trial Colorful pie chart is showing positive statistics and business growth, target and financial analysis and marketing report, data with copy space. Infographic financial growth decrease illustrations Colorful pie chart is showing positive statistics and business growth, target and financial analysis and marketing
Free with trial Magnifying glass coin graph arrows snail lightbulb financial crisis recession downturn slow growth concept abstract background website banner Vector illustration. Infographic financial growth decrease vectors Magnifying glass coin graph arrows snail lightbulb financial crisis recession downturn slow growth concept abstract background
Free with trial Recession economic crisis slow growth snail dollar coin financial downturn chart minimal website banner template global trade war tariffs war Vector illustration. Infographic financial growth decrease vectors Recession economic crisis slow growth snail dollar coin financial downturn chart minimal website banner template global trade war
Free with trial Declining graph line icon. Decrease diagram symbol of bankrupt, Financial Economy investment crisis, low profit sale growth. Editable stroke. Vector illustration. Design on white background. EPS 10. Infographic financial growth decrease vectors Declining graph line icon. Decrease diagram symbol of bankrupt
Free with trial Vector image charts and diagrams for presentation or financial report. Infographics concept. Increase and decrease of indicators in graphic diagram. Colorful vector illustration. Infographic financial growth decrease vectors Vector image charts and diagrams for presentation or financial report. Infographics concept.Increase and decrease of
Free with trial A visually striking image capturing a bar chart, line graph, and pie chart meticulously drawn in the wet sand on a beach. The artwork is illuminated by the warm, golden light of a sunset, with gentle waves lapping at the shore. This represents concepts of financial growth, market analysis, and business success in a unique, natural setting. The image evokes themes of planning, progress, and the cyclical nature of markets. Infographic financial growth decrease illustrations Financial Growth Chart and Pie Chart Drawn in Sand at Sunset. A visually striking image capturing a bar chart, line graph, and pie chart meticulously drawn in the wet sand on a beach. The artwork is illuminated by the warm, golden light of a sunset, with gentle waves lapping at the shore. This represents concepts of financial growth, market analysis, and business success in a unique, natural setting. The image evokes themes of planning, progress, and the cyclical nature of markets.
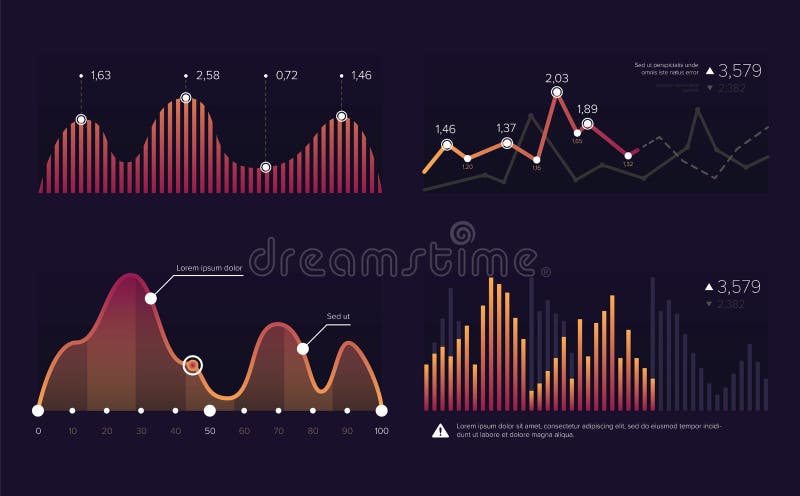
Free with trial A dynamic abstract financial graph with peaks in neon colors against a dark, gradient background, depicting growth and decline trends. Minimalism. Infographic financial growth decrease illustrations A dynamic abstract financial graph with peaks in neon colors against a dark, gradient background, depicting growth and decline
Free with trial Chart showcasing progress. The last bar stands out as a green arrow, symbolising positive growth. Accompanied by cash, it's a powerful representation of financial success. Infographic financial growth decrease vectors Financial Growth Chart with Positive Momentum. Chart showcasing progress. The last bar stands out as a green arrow, symbolising positive growth. Accompanied by cash, it's a powerful representation of financial success...
Free with trial White cylinders with different height. Bar graph. Column chart elements for finance statistical infographic. Growth or decrease signs. Vector 3d illustration. Infographic financial growth decrease vectors White cylinders with different height. Bar graph. Column chart elements for finance statistical infographic. Growth or
Free with trial Vector business, statistical, or economic infographic icon of random percentage increase and decrease. Glass columns in red color isolated on a white background. Infographic financial growth decrease vectors Infographic illustration of histogram. Seven glass columns with red liquid characterizing percentage increase or decrease. Vector business, statistical, or economic infographic icon of random percentage increase and decrease. Glass columns in red color isolated on a white background.
Free with trial This image showcases a striking 3D rendering featuring two sets of colorful bar graphs, one in shades of pink and the other in orange. These graphs are artfully embedded within wave-like, layered forms, creating a visually interesting contrast between the rigid geometry of the bars and the fluidity of the surrounding shapes. The graphs are positioned on separate, circular platforms, and a small, idyllic island with several evergreen trees sits between them, adding a touch of nature to the otherwise abstract composition. The overall aesthetic is minimalist and modern, suggesting a conceptual representation of financial growth within a natural context. Infographic financial growth decrease illustrations Abstract 3D Render of Financial Growth Represented by Colorful Bar Graphs Nestled in Stylized Landscapes. This image showcases a striking 3D rendering featuring two sets of colorful bar graphs, one in shades of pink and the other in orange. These graphs are artfully embedded within wave-like, layered forms, creating a visually interesting contrast between the rigid geometry of the bars and the fluidity of the surrounding shapes. The graphs are positioned on separate, circular platforms, and a small, idyllic island with several evergreen trees sits between them, adding a touch of nature to the otherwise abstract composition. The overall aesthetic is minimalist and modern, suggesting a conceptual representation of financial growth within a natural context.
Free with trial This abstract 3D rendered image showcases three prominent white candlestick-like objects, symbolizing financial growth and market trends. Positioned against a dark, gridded background, a subtle financial chart with smaller red and white candlesticks and wicks extends into the distance, reinforcing the theme of data analysis and investment. The clean, modern aesthetic makes it ideal for illustrating concepts related to stock market performance, cryptocurrency trading, economic growth, financial planning, and digital business strategies. It effectively conveys ideas of progress, success, and the dynamic nature of global markets. Infographic financial growth decrease illustrations 3D Financial Candlestick Chart Representing Market Growth. This abstract 3D rendered image showcases three prominent white candlestick-like objects, symbolizing financial growth and market trends. Positioned against a dark, gridded background, a subtle financial chart with smaller red and white candlesticks and wicks extends into the distance, reinforcing the theme of data analysis and investment. The clean, modern aesthetic makes it ideal for illustrating concepts related to stock market performance, cryptocurrency trading, economic growth, financial planning, and digital business strategies. It effectively conveys ideas of progress, success, and the dynamic nature of global markets.
Free with trial A cheerful cartoon businessman in a suit stands proudly beside a rising bar graph, illustrating positive financial growth and business success. Infographic financial growth decrease illustrations Smiling Businessman Presenting Financial Growth Chart. A cheerful cartoon businessman in a suit stands proudly beside a rising bar graph, illustrating positive financial growth and business success.
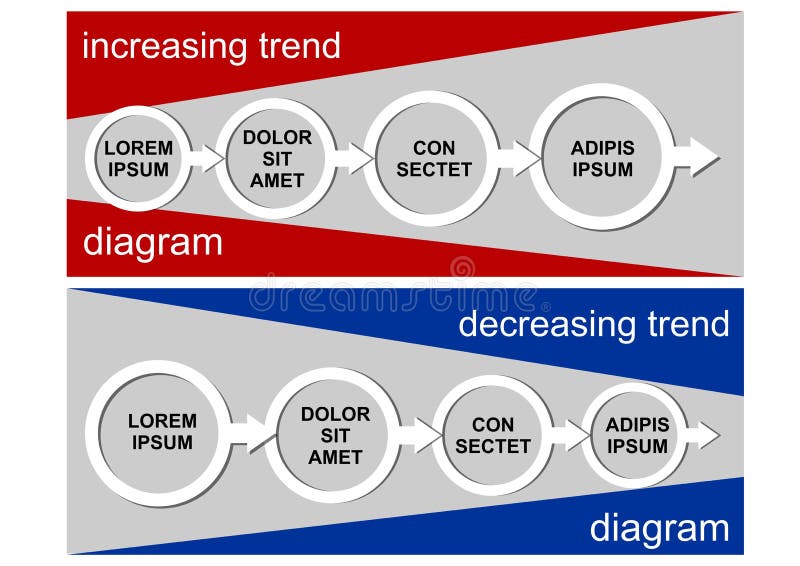
Free with trial Increase diagram and decrease diagram with circles and arrows, infographic template with simple white elements on gray background, red triangles and blue triangles, vector template. Infographic financial growth decrease vectors Increase diagram and decrease diagram with circles and arrows, infographic template with simple white elements on gray
Free with trial A vibrant, modern icon depicting a financial growth chart, representing investment and market analysis. The design features ascending lines and bars, suggesting positive trends. This graphic was generated by AI for illustrative purposes. A representation of financial success. Infographic financial growth decrease illustrations Financial Growth Chart Icon - Business Investment Concept. A vibrant, modern icon depicting a financial growth chart, representing investment and market analysis. The design features ascending lines and bars, suggesting positive trends. This graphic was generated by AI for illustrative purposes. A representation of financial success.
Free with trial This image showcases a vibrant 3D rendering of various financial charts, including bar graphs, pie charts, and a rising arrow, symbolizing growth and profitability. Ideal for presentations, reports, and financial articles. Infographic financial growth decrease illustrations Colorful 3D Financial Charts Showing Growth and Profit. This image showcases a vibrant 3D rendering of various financial charts, including bar graphs, pie charts, and a rising arrow, symbolizing growth and profitability. Ideal for presentations, reports, and financial articles.
Free with trial 3D colorful bar chart, pie chart, rising arrow, dollar sign, and stacks of coins illustrate financial growth and success. Perfect for business, finance, and investment presentations. Infographic financial growth decrease illustrations Financial Growth Chart with Dollar Sign and Coin Stacks. 3D colorful bar chart, pie chart, rising arrow, dollar sign, and stacks of coins illustrate financial growth and success. Perfect for business, finance, and investment presentations.
Free with trial Financial bar chart icon with up and down arrow. Economic growth and decline symbol in black circle. Infographic financial growth decrease vectors Financial bar chart with up and down arrow. Economic growth and decline symbol in black circle
Free with trial Graph down icon. Growth stock diagram financial graph. Vector illustration. Stock image. EPS 10. Infographic financial growth decrease vectors Graph down icon. Growth stock diagram financial graph. Vector illustration. Stock image.
Free with trial This 3D rendering showcases a vibrant bar graph and pie chart, ideal for visualizing business growth, financial reports, and data analysis. The colorful design makes it visually engaging and easy to understand. Infographic financial growth decrease illustrations Colorful 3D Bar and Pie Chart Illustrating Business Growth and Financial Data. This 3D rendering showcases a vibrant bar graph and pie chart, ideal for visualizing business growth, financial reports, and data analysis. The colorful design makes it visually engaging and easy to understand.
Free with trial Graph going up and down sign financial arrows. chart increase, decrease sign with green and red arrows. vector graph with green and red arrows. Infographic financial growth decrease vectors Graph going up and down sign financial arrows. chart increase, decrease sign with green and red arrows. vector graph
Free with trial Set line Graph chart infographic Cloud upload Website with stocks market Financial growth increase Browser window technology data transfer and files icon. Vector. Infographic financial growth decrease vectors Set line Graph chart infographic, Cloud upload, Website with stocks market, Financial growth increase, Browser window. Set line Graph chart infographic Cloud upload Website with stocks market Financial growth increase Browser window technology data transfer and files icon. Vector.
Free with trial This 3D rendering showcases a vibrant bar chart illustrating business growth and financial performance. The colorful cylinders represent data points, rising to show increasing success. A line graph adds additional information about trends over time. Infographic financial growth decrease illustrations Colorful 3D Bar Chart with Growth Graph Showing Business Success and Financial Data. This 3D rendering showcases a vibrant bar chart illustrating business growth and financial performance. The colorful cylinders represent data points, rising to show increasing success. A line graph adds additional information about trends over time.
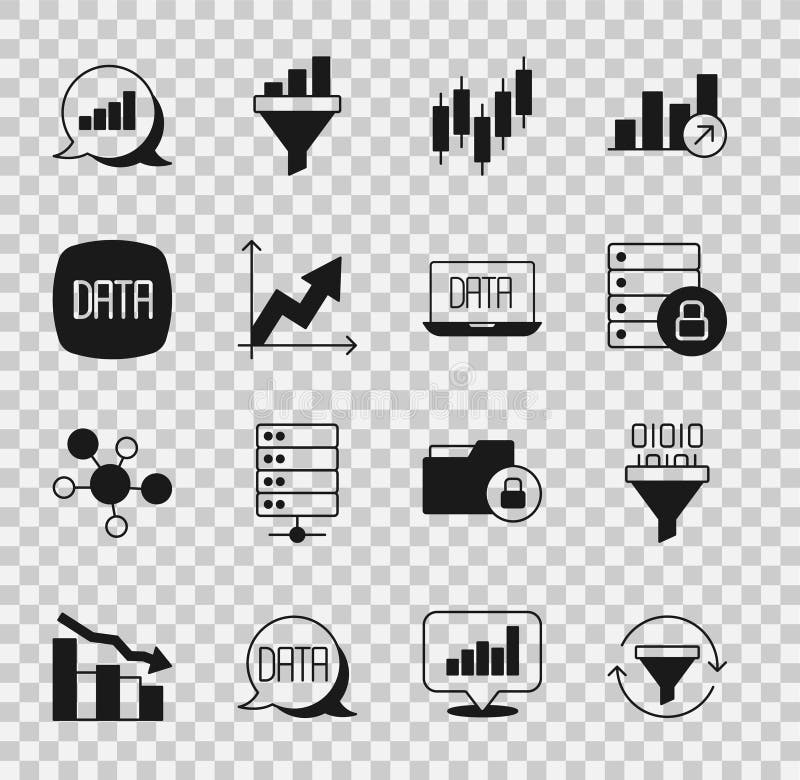
Free with trial Set Sales funnel with chart Binary code Server security padlock Browser stocks market Financial growth Data analysis Pie infographic and icon. Vector. Infographic financial growth decrease vectors Set Sales funnel with chart, Binary code, Server security padlock, Browser stocks market, Financial growth, Data. Set Sales funnel with chart Binary code Server security padlock Browser stocks market Financial growth Data analysis Pie infographic and icon. Vector.
Free with trial Image charts and diagrams for presentation or financial report. Infographics concept. Increase and decrease of indicators in graphic diagram. Colorful illustration illustration. Infographic financial growth decrease illustrations Image charts and diagrams for presentation or financial report. Infographics concept.Increase and decrease of
Free with trial Description: A vibrant 3D rendering showcasing a bar chart with orange, blue, and yellow bars, representing upward financial trends or business growth. Ideal for presentations and reports. Infographic financial growth decrease illustrations Colorful 3D Bar Chart: Business Growth and Financial Success. Description: A vibrant 3D rendering showcasing a bar chart with orange, blue, and yellow bars, representing upward financial trends or business growth. Ideal for presentations and reports.
Free with trial Columns arrows graph. infographic for marketing design. Financial concept. Vector illustration. stock image. EPS 10. Infographic financial growth decrease vectors Columns arrows graph. infographic for marketing design. Financial concept. Vector illustration. stock image.
Free with trial Set paper cut Network cloud connection Sales funnel with chart Folder and lock and Financial growth decrease icon. Paper art style. Vector. Infographic financial growth decrease illustrations Set paper cut Network cloud connection, Sales funnel with chart, Folder and lock and Financial growth decrease icon. Set paper cut Network cloud connection Sales funnel with chart Folder and lock and Financial growth decrease icon. Paper art style. Vector.
Free with trial Colorful Bar Graph Showing Decrease with a Yellow Arrow Signifying a Downward Trend in Financial Performance. Infographic financial growth decrease vectors Colorful Bar Graph Showing Decrease with a Yellow Arrow Signifying a Downward Trend in Financial Performance
Free with trial Set line Search cloud computing Folder and lock Server security with padlock Data analysis folder Financial growth decrease and globe icon. Vector. Infographic financial growth decrease vectors Set line Search cloud computing, Folder and lock, Server security with padlock, Data analysis, folder, Financial growth. Set line Search cloud computing Folder and lock Server security with padlock Data analysis folder Financial growth decrease and globe icon. Vector.
Free with trial Set line Many ways directional arrow Arrow Financial growth increase Intersection point and Pie chart infographic icon. Vector. Infographic financial growth decrease vectors Set line Many ways directional arrow, Arrow, Financial growth increase, Intersection point, and Pie chart infographic
Free with trial Set line Document with graph chart Cloud and shield Processor CPU Data analysis Financial growth Binary code and decrease icon. Vector. Infographic financial growth decrease vectors Set line Document with graph chart, Cloud and shield, Processor CPU, Data analysis, Financial growth, Binary code and. Set line Document with graph chart Cloud and shield Processor CPU Data analysis Financial growth Binary code and decrease icon. Vector.
Free with trial Financial chart graphic with coins, blue bar graph, blurred orange line chart. Business profit, income growth, investment, financial analysis, marketing, economic saving money concept. Infographic financial growth decrease illustrations Financial chart graphic with coins, blue bar graph, blurred orange line chart. Business profit, income growth, investment
Free with trial Set line Browser window Search engine setting Cloud download Magnifying glass with check mark Financial growth decrease and icon. Vector. Infographic financial growth decrease vectors Set line Browser window, Search engine, setting, Cloud download, Magnifying glass with check mark, Financial growth. Set line Browser window Search engine setting Cloud download Magnifying glass with check mark Financial growth decrease and icon. Vector.
Free with trial A captivating stock market analysis chart that visualizes financial data and business growth. The blue background enhances the modern design, perfect for illustrating investment trends and economic reports. Infographic financial growth decrease illustrations Stock market analysis chart financial data graph business investment growth blue background vector illustration. a captivating stock market analysis chart that visualizes financial data and business growth. The blue background enhances the modern design, perfect for illustrating investment trends and economic reports.
Free with trial Watercolor illustration of business growth. Orange bar, pie charts on aged paper show data analysis, market trends, financial progress. Visuals represent success, planning strategic. Infographic financial growth decrease illustrations Watercolor illustration of business growth. Orange bar, pie charts on aged paper show data analysis, market trends, financial
Free with trial Set Arrow, Financial growth, Many ways directional arrow, and Pie chart infographic icon. Vector. Infographic financial growth decrease vectors Set Arrow, Financial growth, Many ways directional arrow, and Pie chart infographic icon. Vector
Free with trial Set Many ways directional arrow Graph chart diagram Financial growth increase Arrow Wrench and gear and icon. Vector. Infographic financial growth decrease vectors Set Many ways directional arrow, Graph, chart, diagram, Financial growth, increase, Arrow, Wrench and gear and icon
Free with trial Graph with financial data, line charts, and growth arrows on a grid background, indicating future trends for 2024 and 2025. 3D Rendering. Infographic financial growth decrease illustrations Financial Data Analysis with Growth Arrows and Global Map. 3D Rendering. Graph with financial data, line charts, and growth arrows on a grid background, indicating future trends for 2024 and 2025. 3D Rendering
Free with trial Set line Old hourglass with sand Arrow Flag Project team base Financial growth increase Graph chart diagram Unknown search and icon. Vector. Infographic financial growth decrease vectors Set line Old hourglass with sand, Arrow, Flag, Project team base, Financial growth increase, Graph, chart, diagram. Set line Old hourglass with sand Arrow Flag Project team base Financial growth increase Graph chart diagram Unknown search and icon. Vector.
Free with trial Set line Many ways directional arrow Digital speed meter Shopping bag with Sale Mountains flag Financial growth decrease Graph chart diagram and Arrow icon. Vector. Infographic financial growth decrease vectors Set line Many ways directional arrow, Digital speed meter, Shopping bag with Sale, Mountains flag, Financial growth. Set line Many ways directional arrow Digital speed meter Shopping bag with Sale Mountains flag Financial growth decrease Graph chart diagram and Arrow icon. Vector.
Free with trial Set line Flag Graph chart diagram Delivery tracking Pyramid infographics Financial growth Project team base and decrease icon. Vector. Infographic financial growth decrease vectors Set line Flag, Graph, chart, diagram, Delivery tracking, Pyramid infographics, Financial growth, Project team base and. Set line Flag Graph chart diagram Delivery tracking Pyramid infographics Financial growth Project team base and decrease icon. Vector.
Free with trial Green up and red down 3d arrow graph showing rising, descending trend, business result, profit or loss symbol symbol. Business arrow, goals concept. 3d world money symbols. Financial growth. Infographic financial growth decrease illustrations Green up and red down 3d arrow graph showing rising, descending trend, business result, 3d world money symbols. Financial growth. Green up and red down 3d arrow graph showing rising, descending trend, business result, profit or loss symbol symbol. Business arrow, goals concept. 3d world money symbols. Financial growth
Free with trial Green up and red down 3d arrow graph showing rising, descending trend, business result, profit or loss symbol symbol. Business arrow, goals concept. 3d world money symbols. Financial growth. Infographic financial growth decrease illustrations Green up and red down 3d arrow graph showing rising, descending trend, business result, 3d world money symbols. Financial growth. Green up and red down 3d arrow graph showing rising, descending trend, business result, profit or loss symbol symbol. Business arrow, goals concept. 3d world money symbols. Financial growth
Free with trial Green up and red down 3d arrow graph showing rising, descending trend, business result, profit or loss symbol symbol. Business arrow, goals concept. 3d world money symbols. Financial growth. Infographic financial growth decrease illustrations Green up and red down 3d arrow graph showing rising, descending trend, business result, 3d world money symbols. Financial growth. Green up and red down 3d arrow graph showing rising, descending trend, business result, profit or loss symbol symbol. Business arrow, goals concept. 3d world money symbols. Financial growth
Free with trial Set Browser window Graph chart infographic Cloud technology data transfer upload Mobile phone incognito and Financial growth decrease icon. Vector. Infographic financial growth decrease illustrations Set Browser window, Graph chart infographic, Cloud technology data transfer, upload, Mobile phone, incognito and. Set Browser window Graph chart infographic Cloud technology data transfer upload Mobile phone incognito and Financial growth decrease icon. Vector.
Free with trial Set Cloud download and upload Browser with exclamation mark Pie chart infographic Folder lock Sales funnel and Financial growth decrease icon. Vector. Infographic financial growth decrease vectors Set Cloud download and upload, Browser with exclamation mark, Pie chart infographic, Folder lock, Sales funnel and. Set Cloud download and upload Browser with exclamation mark Pie chart infographic Folder lock Sales funnel and Financial growth decrease icon. Vector.
Free with trial Set Wrench and gear Shopping bag with Sale Infographic element Light bulb Pie chart infographic Graph chart diagram and Financial growth decrease icon. Vector. Infographic financial growth decrease vectors Set Wrench and gear, Shopping bag with Sale, Infographic element, Light bulb, Pie chart infographic, Graph, chart. Set Wrench and gear Shopping bag with Sale Infographic element Light bulb Pie chart infographic Graph chart diagram and Financial growth decrease icon. Vector.
Free with trial Set line Browser window Cloud technology data transfer Search engine Server Data Graph chart infographic Laptop with browser Financial growth decrease and Online shopping on screen icon. Vector. Infographic financial growth decrease vectors Set line Browser window, Cloud technology data transfer, Search engine, Server, Data, Graph chart infographic, Laptop. Set line Browser window Cloud technology data transfer Search engine Server Data Graph chart infographic Laptop with browser Financial growth decrease and Online shopping on screen icon. Vector.
Free with trial Set line Bitcoin Pie chart infographic Calculator Laptop with dollar Pos terminal Credit card inserted Shopping cart and and Financial growth decrease icon. Vector. Infographic financial growth decrease illustrations Set line Bitcoin, Pie chart infographic, Calculator, Laptop with dollar, Pos terminal, Credit card inserted, Shopping. Set line Bitcoin Pie chart infographic Calculator Laptop with dollar Pos terminal Credit card inserted Shopping cart and and Financial growth decrease icon. Vector.
Free with trial Set Digital speed meter Location Delivery tracking Graph chart diagram Hierarchy organogram Infographic element and Financial growth decrease icon. Vector. Infographic financial growth decrease illustrations Set Digital speed meter, Location, Delivery tracking, Graph, chart, diagram, Hierarchy organogram, Infographic element. Set Digital speed meter Location Delivery tracking Graph chart diagram Hierarchy organogram Infographic element and Financial growth decrease icon. Vector.
Free with trial Set Infographic of city map Server Online shopping on screen Browser files window Cloud technology data transfer Financial growth decrease and icon. Vector. Infographic financial growth decrease vectors Set Infographic of city map, Server, Online shopping on screen, Browser files, window, Cloud technology data transfer. Set Infographic of city map Server Online shopping on screen Browser files window Cloud technology data transfer Financial growth decrease and icon. Vector.
Free with trial Set Browser incognito window Search engine Website with stocks market Online shopping on screen Infographic of city map and Financial growth decrease icon. Vector. Infographic financial growth decrease vectors Set Browser incognito window, Search engine, Website with stocks market, Online shopping on screen, Infographic of city. Set Browser incognito window Search engine Website with stocks market Online shopping on screen Infographic of city map and Financial growth decrease icon. Vector.
Free with trial A simple illustration of a bar chart with a downward arrow showing decline, loss, negative growth, or decreasing business and financial performance. Infographic financial growth decrease vectors Financial Loss Graph Symbol. A simple illustration of a bar chart with a downward arrow showing decline, loss, negative growth, or decreasing business and financial performance
Free with trial A clean and modern vector illustration featuring graphic symbols for business growth and decline. This EPS file shows an upward-trending green arrow for success and a downward-trending red arrow for loss, both depicted on a stylized financial chart. Ideal for corporate presentations, financial reports, economic analysis, and stock market metaphors. Infographic financial growth decrease vectors Growth And Decline Chart Graphic Symbol. A clean and modern vector illustration featuring graphic symbols for business growth and decline. This EPS file shows an upward-trending green arrow for success and a downward-trending red arrow for loss, both depicted on a stylized financial chart. Ideal for corporate presentations, financial reports, economic analysis, and stock market metaphors.
Free with trial Four stylized arrows on a white background, two green and two red. The green arrows curve upwards with a smooth, sweeping motion. The red arrows feature a zigzag pattern before pointing upwards. Positioned in a circular arrangement, alternating colors suggest dynamics of growth and decline, often used in business or financial contexts. The minimalistic style is suitable for illustrating trends or cycles. Infographic financial growth decrease vectors Up and Down Arrow Icons Set for Growth and Decline. Four stylized arrows on a white background, two green and two red. The green arrows curve upwards with a smooth, sweeping motion. The red arrows feature a zigzag pattern before pointing upwards. Positioned in a circular arrangement, alternating colors suggest dynamics of growth and decline, often used in business or financial contexts. The minimalistic style is suitable for illustrating trends or cycles.
Free with trial A businessman in a suit holds a glowing digital interface showing a growth bar chart and the words COST Focusing, representing financial strategy and cost management analysis. Infographic financial growth decrease illustrations A businessman in a suit holds a glowing digital interface showing a growth bar chart and the words COST Focusing, representing
Free with trial A simple flat design graphic illustrates stock market growth and decline using green upward and red downward arrows with bar charts. Ideal for finance and business concepts. Infographic financial growth decrease vectors Bar chart showing financial growth and decline. A simple flat design graphic illustrates stock market growth and decline using green upward and red downward arrows with bar charts. Ideal for finance and business concepts
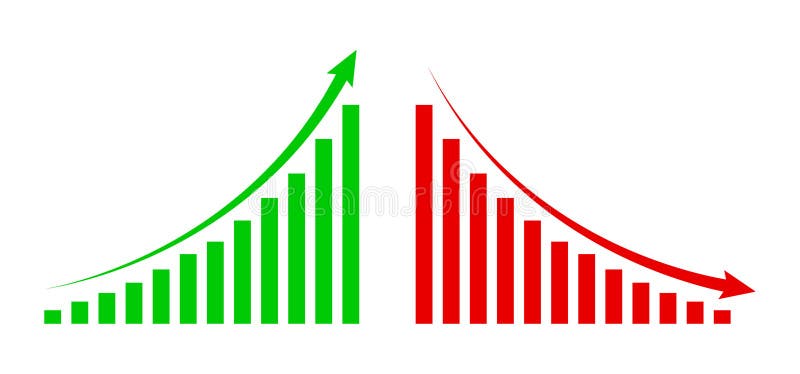
Free with trial A contrasting vector graphic set showing rising green bars with an upward arrow and falling red bars with a downward arrow, representing financial growth and decline. Infographic financial growth decrease vectors Business bar charts indicating growth and decline. A contrasting vector graphic set showing rising green bars with an upward arrow and falling red bars with a downward arrow, representing financial growth and decline
Free with trial Simple black and white vector illustration showing bar charts indicating increase and decrease, perfect for financial or data concepts. Infographic financial growth decrease vectors Bar chart icon showing increase and decrease data. Simple black and white vector illustration showing bar charts indicating increase and decrease, perfect for financial or data concepts
Free with trial Line graph illustrating data analysis and business statistics, charting financial growth, market changes, and performance metrics for visual information and infographic content. Infographic financial growth decrease illustrations Analyzing data with line graph showing business trends. Line graph illustrating data analysis and business statistics, charting financial growth, market changes, and performance metrics for visual information and infographic content
Free with trial A set of financial growth and decline chart icons featuring up and down arrows with colorful bars, indicating economic trends. the concept of financial market increases, decreases and fluctuations. Infographic financial growth decrease vectors Set of Financial Fluctuation Chart Icons in Flat Design. A set of financial growth and decline chart icons featuring up and down arrows with colorful bars, indicating economic trends. the concept of financial market increases, decreases and fluctuations
Free with trial Increasing and decreasing graph set. Red and blue arrows depict growth and recession business. Flat vector chart concept illustration as an element for web, publish infographic and social networks. Infographic financial growth decrease vectors Growth and Recession Business Concept. Increasing and decreasing graph set. Red and blue arrows depict growth and recession business. Flat vector chart concept illustration as an element for web, publish infographic and social networks.
Free with trial This image displays a set of stylized bar chart icons representing financial and business trends. The leftmost icon features green bars increasing in height, accompanied by a green upward-pointing arrow, symbolizing growth and success. The middle icon shows red bars decreasing in height, with a black downward-pointing arrow indicating decline and loss. The right side presents two smaller black and white bar charts, also depicting downward trends. These icons are ideal for illustrating concepts like profit, loss, market trends, economic performance, and data analysis. Infographic financial growth decrease illustrations Growth and Decline Bar Chart Icons. This image displays a set of stylized bar chart icons representing financial and business trends. The leftmost icon features green bars increasing in height, accompanied by a green upward-pointing arrow, symbolizing growth and success. The middle icon shows red bars decreasing in height, with a black downward-pointing arrow indicating decline and loss. The right side presents two smaller black and white bar charts, also depicting downward trends. These icons are ideal for illustrating concepts like profit, loss, market trends, economic performance, and data analysis.
Free with trial A versatile collection of flat vector icons representing key concepts in finance, economics, and security. This comprehensive set includes symbols for market growth, decline, and trends, various currency representations like the Euro and Korean Won, and essential security elements such as open and closed padlocks. Designed with a clean, modern aesthetic, these icons are perfect for enhancing business presentations, financial reports, websites, mobile applications, and infographics, effectively illustrating concepts like investment, market analysis, currency exchange, and data protection. Infographic financial growth decrease vectors Financial and Security Vector Icon Set. A versatile collection of flat vector icons representing key concepts in finance, economics, and security. This comprehensive set includes symbols for market growth, decline, and trends, various currency representations like the Euro and Korean Won, and essential security elements such as open and closed padlocks. Designed with a clean, modern aesthetic, these icons are perfect for enhancing business presentations, financial reports, websites, mobile applications, and infographics, effectively illustrating concepts like investment, market analysis, currency exchange, and data protection.
Free with trial Arrow 3d chart graph pointer, vector illustration. Up and down forward arrow, motion and navigation symbol, financial growth concept. Web design elements crease of decrease sign. Infographic financial growth decrease vectors Arrow navigation pointer, chart graph. Arrow 3d chart graph pointer, vector illustration. Up and down forward arrow, motion and navigation symbol, financial growth concept. Web design elements crease of decrease sign
Free with trial This comprehensive vector icon set illustrates various financial market trends, economic indicators, and potential crises. Featuring line graphs, bar charts, pie charts, dollar signs, piggy banks, and warning sirens, the collection uses a striking red and black color palette to depict both growth and decline. Concepts like stock market volatility, investment risks, economic downturns, and business analytics are visually represented. Ideal for financial reports, business presentations, economic news, investment platforms, and educational materials requiring clear and impactful visual communication of market dynamics. Infographic financial growth decrease vectors Financial Market Trends and Crisis Vector Icons Set. This comprehensive vector icon set illustrates various financial market trends, economic indicators, and potential crises. Featuring line graphs, bar charts, pie charts, dollar signs, piggy banks, and warning sirens, the collection uses a striking red and black color palette to depict both growth and decline. Concepts like stock market volatility, investment risks, economic downturns, and business analytics are visually represented. Ideal for financial reports, business presentations, economic news, investment platforms, and educational materials requiring clear and impactful visual communication of market dynamics.
Free with trial Graphic bar chart illustrating business data analysis, financial statistics, and market trends with both positive growth and negative decline on a clean white background. Infographic financial growth decrease vectors Business financial graph showing increase and decrease. Graphic bar chart illustrating business data analysis, financial statistics, and market trends with both positive growth and negative decline on a clean white background
Free with trial Orange bar chart with downward arrow vector illustration. Financial loss, economic recession, market crash, business failure, negative growth, data analysis. Declining graph with falling trend. Infographic financial growth decrease vectors Decreasing bar chart with downward arrow showing financial loss and economic recession vector illustration. Orange bar chart with downward arrow vector. Orange bar chart with downward arrow vector illustration. Financial loss, economic recession, market crash, business failure, negative growth, data analysis. Declining graph with falling trend
Free with trial An isolated vector illustration featuring two prominent, stylized arrows on a clean white background. One arrow, colored in shades of red and pink, points diagonally upwards and to the right, symbolizing growth, increase, or positive trends. The other arrow, rendered in blue and cyan tones, points diagonally downwards and to the left, representing decline, decrease, or negative movement. Both arrows have a modern, slightly textured or sketchy appearance, making them ideal for infographics, business presentations, financial reports, or conceptual designs illustrating contrasting directions, market changes, or comparative data. Infographic financial growth decrease illustrations Growth and Decline Arrows with Sketchy Style. An isolated vector illustration featuring two prominent, stylized arrows on a clean white background. One arrow, colored in shades of red and pink, points diagonally upwards and to the right, symbolizing growth, increase, or positive trends. The other arrow, rendered in blue and cyan tones, points diagonally downwards and to the left, representing decline, decrease, or negative movement. Both arrows have a modern, slightly textured or sketchy appearance, making them ideal for infographics, business presentations, financial reports, or conceptual designs illustrating contrasting directions, market changes, or comparative data.
Free with trial This vector illustration set features six distinct icons representing key financial and economic concepts. It includes bar charts depicting growth with a green arrow and decline with a red arrow, alongside currency exchange rate indicators for USD, INR, and EUR. Two donut charts visualize data distribution, while a world map colored green and red signifies global market trends or segmentation. Ideal for business presentations, financial reports, economic analysis, and investment-related content, these versatile graphics convey complex data clearly and concisely. Infographic financial growth decrease vectors Financial Growth, Decline, and Global Market Data Visualization Icons Set. This vector illustration set features six distinct icons representing key financial and economic concepts. It includes bar charts depicting growth with a green arrow and decline with a red arrow, alongside currency exchange rate indicators for USD, INR, and EUR. Two donut charts visualize data distribution, while a world map colored green and red signifies global market trends or segmentation. Ideal for business presentations, financial reports, economic analysis, and investment-related content, these versatile graphics convey complex data clearly and concisely.
Free with trial Black and red arrow pointing downward on financial graph showing a decline. Business growth chart with falling trend line for investment analysis. Infographic financial growth decrease illustrations Black and red arrow pointing downward on financial graph showing a decline
Free with trial Collection of business growth and financial analysis icons featuring bar charts and arrows with editable line art and flat shape style. Editable vector icon set. Infographic financial growth decrease vectors Collection of business growth and financial analysis icons featuring bar charts and arrows with editable line art and flat shape
Free with trial This image showcases colorful 3D charts and graphs, representing financial data, generated by AI. It includes bar graphs, pie charts, and other visual representations of financial performance, displayed on a tablet and printed reports. The image suggests growth and positive financial trends. Infographic financial growth decrease illustrations AI-Generated Financial Charts. This image showcases colorful 3D charts and graphs, representing financial data, generated by AI. It includes bar graphs, pie charts, and other visual representations of financial performance, displayed on a tablet and printed reports. The image suggests growth and positive financial trends.
Free with trial A collage of various hand-drawn charts and graphs in shades of blue, illustrating business growth, data analysis, and financial trends. The collection includes bar charts, line graphs, and pie charts, all rendered with a sketchy, artistic style. These visuals are perfect for presentations, reports, or any project requiring a dynamic and informative representation of data and progress. Infographic financial growth decrease illustrations Hand-Drawn Business Growth Charts and Graphs Collection. A collage of various hand-drawn charts and graphs in shades of blue, illustrating business growth, data analysis, and financial trends. The collection includes bar charts, line graphs, and pie charts, all rendered with a sketchy, artistic style. These visuals are perfect for presentations, reports, or any project requiring a dynamic and informative representation of data and progress.
Free with trial Abstract illustration of business growth, featuring bar graphs and line graphs in shades of blue and grey. The image conveys concepts of data analysis, progress, and financial performance. Suitable for presentations, reports, and marketing materials related to business, finance, and technology. Infographic financial growth decrease illustrations Abstract Business Growth Chart. Abstract illustration of business growth, featuring bar graphs and line graphs in shades of blue and grey. The image conveys concepts of data analysis, progress, and financial performance. Suitable for presentations, reports, and marketing materials related to business, finance, and technology.