Free with trial Bar chart with descending arrow showing a significant decrease in data or performance. Performance decrease vectors Bar chart with descending arrow showing a significant decrease in data or performance
Free with trial Woman Kate holding big yellow direction arrow pointing down. Decline, decrease, loss concept. 3d vector people character. Cartoon minimal style. Performance decrease vectors Woman Kate holding big yellow direction arrow pointing down. Decline, decrease, loss concept.
Free with trial Set of six flat design icons related to time measurement and performance trends isolated on transparent background. Performance decrease vectors Collection of flat design time and performance measurement icons. Set of six flat design icons related to time measurement and performance trends isolated on transparent background
Free with trial Next economic recession forecast or prediction, stock market decline or revenue decrease, low performance or GDP falling down concept, businessman investor look through telescope to see despair graph. Performance decrease vectors Next economic recession forecast or prediction, stock market decline or revenue decrease, low performance or GDP falling down
Free with trial Next economic recession forecast or prediction, stock market decline or revenue decrease, low performance or GDP falling down concept, businesswoman investor look through telescope to see despair graph. Performance decrease vectors Next economic recession forecast or prediction, stock market decline or revenue decrease, low performance or GDP falling down
Free with trial Bar Chart Decline Line And Solid Icon Set. Financial Loss, Economic Downturn, And Business Performance Decrease Symbol Collection. Data Analysis And Market Trends. Isolated Vector Illustration. Performance decrease vectors Bar Chart Decline Line And Solid Icon Set. Financial Loss, Economic Downturn, And Business Performance Decrease Symbol
Free with trial Colorful Bar Graph Showing Decrease with a Yellow Arrow Signifying a Downward Trend in Financial Performance. Performance decrease vectors Colorful Bar Graph Showing Decrease with a Yellow Arrow Signifying a Downward Trend in Financial Performance
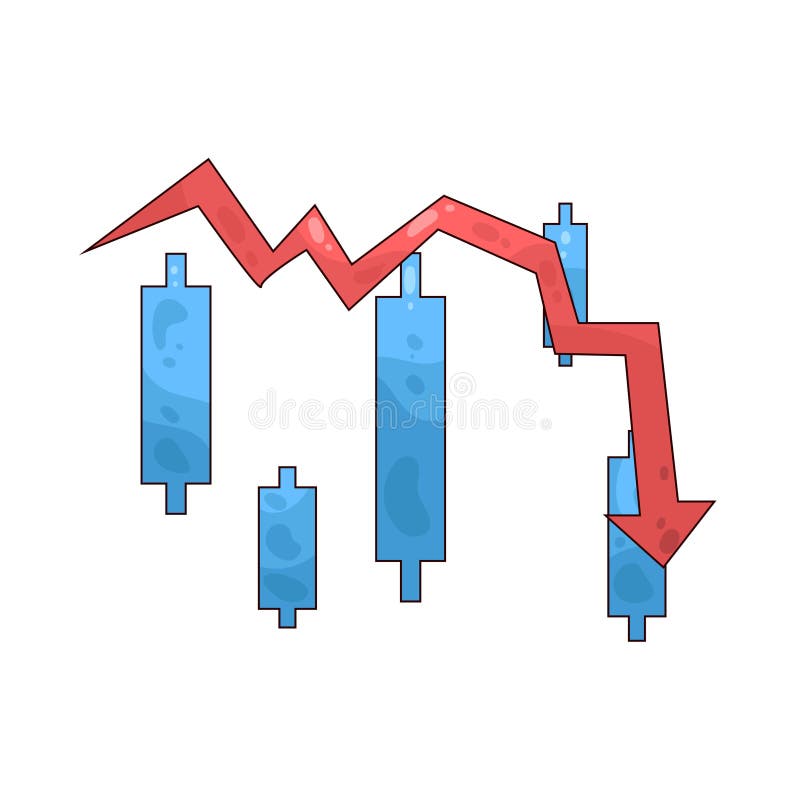
Free with trial Red bar graph shows decline with downward arrow, representing financial loss. Business failure reduced performance or decrease of value. Negative trend report. Performance decrease illustrations Red bar graph shows decline with downward arrow, representing financial loss. Business failure, reduced performance or decrease. Red bar graph shows decline with downward arrow, representing financial loss. Business failure reduced performance or decrease of value. Negative trend report.
Free with trial Line icon of decreasing chart representing reduced productivity, low performance, and efficiency decline. Suitable for business, work, stress, and health related topics. Performance decrease vectors Reduced Productivity Icon Decrease Performance Efficiency Decline Symbol. Line icon of decreasing chart representing reduced productivity, low performance, and efficiency decline. Suitable for business, work, stress, and health related topics.
Free with trial Line icon of decreasing chart representing reduced productivity, low performance, and efficiency decline. Suitable for business, work, stress, and health related topics. Performance decrease vectors Reduced Productivity Icon Decrease Performance Efficiency Decline Symbol black. Line icon of decreasing chart representing reduced productivity, low performance, and efficiency decline. Suitable for business, work, stress, and health related topics.
Free with trial Recession down loss arrows icon simple graphic line stroke and solid bold vector set, decrease negative graph shape silhouette logo, statistics low performance element image clip art. Performance decrease vectors Recession down loss arrows icon simple graphic line stroke and solid bold vector set, decrease negative graph shape silhouette
Free with trial The image depicts a bar graph with a downward trend. The bars, which start at a higher value on the left, progressively decrease in height towards the right. A large red arrow, pointing downwards, emphasizes the declining trend. This visual representation suggests a continuous decrease in performance, sales, or another measured metric over a specified period. Performance decrease illustrations Decline in performance over time. The image depicts a bar graph with a downward trend. The bars, which start at a higher value on the left, progressively decrease in height towards the right. A large red arrow, pointing downwards, emphasizes the declining trend. This visual representation suggests a continuous decrease in performance, sales, or another measured metric over a specified period
Free with trial The image depicts a series of green bars representing data points, with a prominent red downward arrow indicating a decline in performance or values over time. The bars decrease in height from left to right, emphasizing a downward trend. Performance decrease illustrations Decline in performance indicated by downward trend. The image depicts a series of green bars representing data points, with a prominent red downward arrow indicating a decline in performance or values over time. The bars decrease in height from left to right, emphasizing a downward trend
Free with trial A bright glossy red arrow curves downwards indicating a fall or decline. This symbol represents negative trends, decrease, or a downward movement in data or performance. Performance decrease illustrations Glossy red downward curve arrow showing decline fall decrease trend. A bright glossy red arrow curves downwards indicating a fall or decline. This symbol represents negative trends, decrease, or a downward movement in data or performance
Free with trial A vector graphic of a line graph showing a downward trend. Represents decrease, decline, loss, or negative performance. In automotive context, could symbolize falling sales, decreasing fuel efficiency, or a system performance drop. A clear visual for illustrating negative trends, vector design Generative AI. Performance decrease vectors Downtrend graph icon, decrease decline loss symbol, vector design Generative AI. A vector graphic of a line graph showing a downward trend. Represents decrease, decline, loss, or negative performance. In automotive context, could symbolize falling sales, decreasing fuel efficiency, or a system performance drop. A clear visual for illustrating negative trends, vector design Generative AI
Free with trial A modern flat design concept illustrating business analytics and sales performance. The scene features a laptop and smartphone displaying a dashboard with various charts, graphs, and statistics for a Q3 report. A world map with a magnifying glass signifies global market analysis and regional breakdown. Additional elements like a checklist and growth decrease icons represent strategic planning, auditing, and financial review. This versatile vector illustration is perfect for presentations, marketing materials, and web design related to finance, data visualization, and business intelligence. Performance decrease illustrations Business Analytics and Sales Performance Report Dashboard. A modern flat design concept illustrating business analytics and sales performance. The scene features a laptop and smartphone displaying a dashboard with various charts, graphs, and statistics for a Q3 report. A world map with a magnifying glass signifies global market analysis and regional breakdown. Additional elements like a checklist and growth decrease icons represent strategic planning, auditing, and financial review. This versatile vector illustration is perfect for presentations, marketing materials, and web design related to finance, data visualization, and business intelligence.
Free with trial An illuminated downward arrow with a jagged line signifies a decline, representing negative performance and can be used to illustrate a decrease in business or any downward trend. Performance decrease illustrations Declining Arrow Shows Downtrend and Negative Performance. An illuminated downward arrow with a jagged line signifies a decline, representing negative performance and can be used to illustrate a decrease in business or any downward trend
Free with trial Workers Productivity Decrease 3D Icon, symbolizing challenges in workplace efficiency, motivation, and overall performance. Performance decrease illustrations Workers Productivity Decrease 3D Icon
Free with trial This image features four distinct icons representing financial performance indicators. The top left icon shows a green percentage symbol with an upward arrow, indicating growth or increase. The top right icon displays a red percentage symbol with a downward arrow, symbolizing decline or decrease. The bottom left icon illustrates a series of green bar graphs, indicating positive trends or growth. Performance decrease illustrations Financial performance indicators
Free with trial Finance data analytics, decrease graph line icon. Business research report analysis, finance performance analytics or company statistic outline vector icon column infographics and pointing down arrow. Performance decrease illustrations Finance data analytics, decrease graph line icon
Free with trial The image depicts a 3D bar graph with three orange bars of varying heights. A blue arrow curves downward from left to right, pointing to the percentage symbol on the right side of the image. The graph appears to illustrate a substantial decrease in percentage, likely representing a decline in data or performance. The background is a plain white surface, allowing the graph and its elements to take. Performance decrease illustrations A bar graph showing a significant decrease in percentage. The image depicts a 3D bar graph with three orange bars of varying heights. A blue arrow curves downward from left to right, pointing to the percentage symbol on the right side of the image. The graph appears to illustrate a substantial decrease in percentage, likely representing a decline in data or performance. The background is a plain white surface, allowing the graph and its elements to take
Free with trial A businessman's hands interact with a futuristic virtual interface displaying a declining bar chart, symbolizing cost reduction or performance decrease. This central icon is encircled by various business process icons, representing data analysis, management, and strategy. The concept illustrates managing a business downturn, financial crisis, or economic recession through technology and data-driven decisions. It's an ideal visual for topics like risk management, cost optimization, efficiency improvement, and corporate strategy in a challenging economic environment, set against a modern, dark background. Performance decrease illustrations Business Cost Reduction and Performance Decline Analysis Concept. A businessman's hands interact with a futuristic virtual interface displaying a declining bar chart, symbolizing cost reduction or performance decrease. This central icon is encircled by various business process icons, representing data analysis, management, and strategy. The concept illustrates managing a business downturn, financial crisis, or economic recession through technology and data-driven decisions. It's an ideal visual for topics like risk management, cost optimization, efficiency improvement, and corporate strategy in a challenging economic environment, set against a modern, dark background.
Free with trial A concise vector illustration of a red downward trending line graph, indicating an economic downturn or statistical decrease. This graphic is ideal for financial analysis, business reports, performance reviews, or economic forecasts. It clearly represents a decline in data, suitable for analytical and business-oriented designs, vector design Generative AI. Performance decrease vectors Red downward trend line graph, economic downturn, statistical decrease, vector design Generative AI. A concise vector illustration of a red downward trending line graph, indicating an economic downturn or statistical decrease. This graphic is ideal for financial analysis, business reports, performance reviews, or economic forecasts. It clearly represents a decline in data, suitable for analytical and business-oriented designs, vector design Generative AI
Free with trial The image depicts a series of vertical bars in teal color, showing a gradual decrease in height from left to right. A large red downward-pointing arrow overlays the bars, emphasizing the trend of decline in the data represented. This visual is commonly used to illustrate decreasing performance, sales, or other metrics over time. Performance decrease illustrations Declining bar chart with a downward arrow indicating a decrease in values. The image depicts a series of vertical bars in teal color, showing a gradual decrease in height from left to right. A large red downward-pointing arrow overlays the bars, emphasizing the trend of decline in the data represented. This visual is commonly used to illustrate decreasing performance, sales, or other metrics over time
Free with trial A declining bar graph with a downward arrow symbolizes a negative trend, indicating a decrease in business performance, economic downturn, and potential market challenges. Performance decrease vectors Vector art of declining bar graph with downward arrow, illustrating negative trend, decrease, and economic downturn in business. A declining bar graph with a downward arrow symbolizes a negative trend, indicating a decrease in business performance, economic downturn, and potential market challenges
Free with trial The image depicts a bar chart with a downward trend, illustrating a decrease in values or performance over time. An arrow points downward from the last bar to a green dollar sign, symbolizing a decline in financial metrics or economic performance. The visual emphasizes a negative trend in monetary terms or financial health. Performance decrease illustrations Graphic showing decline in value or performance with dollar symbol emphasis. The image depicts a bar chart with a downward trend, illustrating a decrease in values or performance over time. An arrow points downward from the last bar to a green dollar sign, symbolizing a decline in financial metrics or economic performance. The visual emphasizes a negative trend in monetary terms or financial health
Free with trial The image shows a series of vertical bars in descending order of height, colored from dark blue to light purple. A bold red diagonal arrow overlays the bars, pointing downward, symbolizing a decline or reduction in values over time. This visual is often used to represent a decrease in metrics such as sales, performance, or other quantifiable data trends. Performance decrease illustrations Declining bar chart with downward trend arrow indicating a decrease in values. The image shows a series of vertical bars in descending order of height, colored from dark blue to light purple. A bold red diagonal arrow overlays the bars, pointing downward, symbolizing a decline or reduction in values over time. This visual is often used to represent a decrease in metrics such as sales, performance, or other quantifiable data trends
Free with trial The image shows a striking red zigzag arrow pointing downward, symbolizing a sharp decline or downward trend. The arrow is bold and visually emphasizes the concept of a decrease, often used in financial, economic, or performance contexts to represent falling values, losses, or negative growth. Performance decrease illustrations A bold downward zigzag arrow indicating a significant decline or decrease trend. The image shows a striking red zigzag arrow pointing downward, symbolizing a sharp decline or downward trend. The arrow is bold and visually emphasizes the concept of a decrease, often used in financial, economic, or performance contexts to represent falling values, losses, or negative growth
Free with trial This image features a bar chart with orange bars representing performance metrics that steadily decrease over time, accompanied by a downward-sloping line graph that tracks the same trend against a blurred office background. Performance decrease illustrations A bar chart showing a steady decline in performance metrics over a series of sequential periods. This image features a bar chart with orange bars representing performance metrics that steadily decrease over time, accompanied by a downward-sloping line graph that tracks the same trend against a blurred office background
Free with trial The image shows a bold red zigzag arrow pointing downward, symbolizing a trend of decline or reduction. This type of arrow is commonly used in graphs, charts, and presentations to represent a decrease in data, performance, or value over a period of time. Performance decrease illustrations A downward zigzag arrow indicating a decline or decrease in values over time. isolated on white background. The image shows a bold red zigzag arrow pointing downward, symbolizing a trend of decline or reduction. This type of arrow is commonly used in graphs, charts, and presentations to represent a decrease in data, performance, or value over a period of time
Free with trial This is a conceptual image showing a persons hand holding a digital graphic with arrows and percentages representing quality cost This image illustrates the dynamic nature of business finance performance and metrics with the potential for both increases and decreases in quality and costs in the modern business landscape. Performance decrease illustrations Conceptual Hand Holding Quality Cost Graphic Depicting Increase and Decrease Percentages Representing Business Performance and. This is a conceptual image showing a persons hand holding a digital graphic with arrows and percentages representing quality cost This image illustrates the dynamic nature of business finance performance and metrics with the potential for both increases and decreases in quality and costs in the modern business landscape
Free with trial This icon represents a decrease in profit, depicted with a downward-pointing arrow and a bar or line graph. The design is simple and clean, often using red or orange colors to signify a negative change. The icon symbolizes financial loss, declining revenue, or a downturn in business performance, making it a clear visual representation of economic challenges. Performance decrease vectors Profit decrease icon. This icon represents a decrease in profit, depicted with a downward-pointing arrow and a bar or line graph. The design is simple and clean, often using red or orange colors to signify a negative change. The icon symbolizes financial loss, declining revenue, or a downturn in business performance, making it a clear visual representation of economic challenges.
Free with trial A speed arrow pointing down, isolated on a white background, representing a decrease in speed, performance, or quantity. Performance decrease illustrations Speed Arrow Down Isolated on White Background - Symbol of Decrease. A speed arrow pointing down, isolated on a white background, representing a decrease in speed, performance, or quantity.
Free with trial A simple icon of a downward arrow line, symbolizing decline, decrease, negative trends, and falling metrics. Ideal for business, finance, performance analytics, or warning indicators. This clear vector illustration is perfect for websites, apps, and presentations, conveying negative progress or caution, vector design Generative AI. Performance decrease vectors Downward Trend Arrow Icon: Decline, Decrease Negative Trend, vector design Generative AI. A simple icon of a downward arrow line, symbolizing decline, decrease, negative trends, and falling metrics. Ideal for business, finance, performance analytics, or warning indicators. This clear vector illustration is perfect for websites, apps, and presentations, conveying negative progress or caution, vector design Generative AI
Free with trial An abstract icon featuring a line moving downwards, symbolizing a decline, negative trend, or decrease in value or performance. Useful in interfaces and graphics where a simple indicator of negative movement is needed without a full chart context, vector design Generative AI. Performance decrease vectors Abstract Downtrend Line Icon, Representing Negative Performance, vector design Generative AI. An abstract icon featuring a line moving downwards, symbolizing a decline, negative trend, or decrease in value or performance. Useful in interfaces and graphics where a simple indicator of negative movement is needed without a full chart context, vector design Generative AI
Free with trial A striking red downward arrow breaks through charts and data, symbolizing a sharp decrease in market values or performance metrics during a financial analysis session. Performance decrease illustrations Red downward arrow indicates a sudden decline in market performance and trends. A striking red downward arrow breaks through charts and data, symbolizing a sharp decrease in market values or performance metrics during a financial analysis session.
Free with trial A vibrant red arrow sharply points downwards, indicating a significant decrease or negative trend. This visual represents market downturns, business losses, or declining performance metrics. Performance decrease illustrations Sharp red downward trend arrow symbolizing financial decline or negative performance. A vibrant red arrow sharply points downwards, indicating a significant decrease or negative trend. This visual represents market downturns, business losses, or declining performance metrics
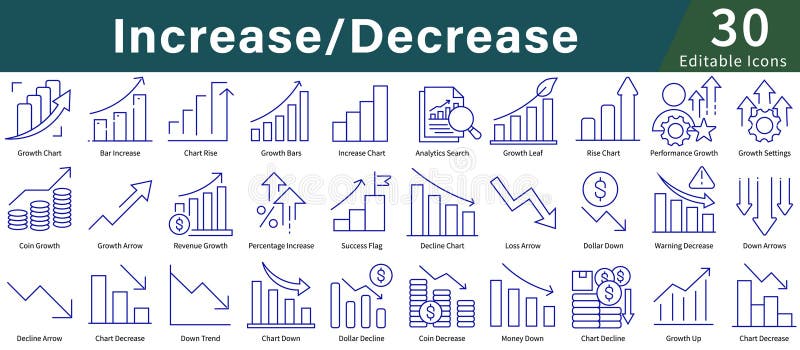
Free with trial Icons illustrating concepts of "Increase Decrease," using simple blue line art. Features include graphs and charts with upward and downward arrows, coins, dollar symbols, and percentage signs. Icons depict growth, decline, analytics, and performance tracking. Suitable for business, finance, or data analysis themes, these icons provide a visual representation of financial trends and statistics, making abstract concepts clear and easily understandable. The design is minimalistic and user-friendly, aimed at enhancing clarity in presentations and reports. Performance decrease vectors Increase Decrease Icon Set in Line Style with Editable Vector for Growth, Analytics, Charts, and Data Visualization. Icons illustrating concepts of "Increase Decrease," using simple blue line art. Features include graphs and charts with upward and downward arrows, coins, dollar symbols, and percentage signs. Icons depict growth, decline, analytics, and performance tracking. Suitable for business, finance, or data analysis themes, these icons provide a visual representation of financial trends and statistics, making abstract concepts clear and easily understandable. The design is minimalistic and user-friendly, aimed at enhancing clarity in presentations and reports.
Free with trial Declining graph icon in line design. decline, graph, chart, analytics, business, decrease, statistics on white background vector. Declining graph editable stroke icon. Performance decrease vectors Declining graph icon in line design. decline, graph, chart, analytics, business, decrease, statistics on white background vector
Free with trial Decrease : Decrease represents a reduction in value, profit, or financial performance over a specific period. Performance decrease vectors Illustration of Decrease. Decrease : Decrease represents a reduction in value, profit, or financial performance over a specific period.
Free with trial Decrease is a reduction in quantity, value, or performance, often shown in business or financial charts. Performance decrease vectors Illustration of decrease. decrease is a reduction in quantity, value, or performance, often shown in business or financial charts.
Free with trial A minimalist black and white icon featuring a lightning bolt symbol within a circle. A jagged arrow, representing a downward trend or decline, originates from the top of the circle and points towards the bottom right. The lightning bolt is positioned to the left of the arrow's path. This graphic symbolizes concepts like energy loss, power decrease, economic downturn, or a negative trend in performance. Its clean design makes it suitable for various digital and print applications. Performance decrease vectors Lightning Bolt Downward Trend Icon. A minimalist black and white icon featuring a lightning bolt symbol within a circle. A jagged arrow, representing a downward trend or decline, originates from the top of the circle and points towards the bottom right. The lightning bolt is positioned to the left of the arrow's path. This graphic symbolizes concepts like energy loss, power decrease, economic downturn, or a negative trend in performance. Its clean design makes it suitable for various digital and print applications.
Free with trial Decrease: Decrease represents a reduction in value, amount, or performance over time. Performance decrease illustrations Illustration of Decrease. Decrease: Decrease represents a reduction in value, amount, or performance over time.
Free with trial A minimalist, black and white graphic representing a downward trend. A thick, bold arrow points diagonally down and to the right, symbolizing a decline. Below it, a jagged, irregular line graph mirrors this downward trajectory, depicting volatility and a general decrease. This imagery is ideal for illustrating financial losses, market downturns, negative performance, or any concept of falling or decreasing values. Performance decrease vectors Down Trend Arrow and Jagged Line Graph. A minimalist, black and white graphic representing a downward trend. A thick, bold arrow points diagonally down and to the right, symbolizing a decline. Below it, a jagged, irregular line graph mirrors this downward trajectory, depicting volatility and a general decrease. This imagery is ideal for illustrating financial losses, market downturns, negative performance, or any concept of falling or decreasing values.
Free with trial Analysis audit sales growth report icon vector modern comparing with loss failure statistics business data performance set sign symbol, progress assessment strategy vs recession decrease graph clipart. Performance decrease vectors Analysis audit sales growth report icon vector modern comparing with loss failure statistics business data performance set sign. Symbol, progress assessment. Analysis audit sales growth report icon vector modern comparing with loss failure statistics business data performance set sign symbol, progress assessment strategy vs recession decrease graph clipart
Free with trial A black bar chart graph with a falling arrow on a white background, indicating decline and decrease in data or business performance. Scalable format print and digital media. and projects. Performance decrease vectors Black bar chart graph with falling arrow decline. A black bar chart graph with a falling arrow on a white background, indicating decline and decrease in data or business performance. Scalable format print and digital media. and projects
Free with trial Line graph showing downward trend, large sad face, smaller happy face, and individual figure. Ideal for performance analysis, emotions tracking, business trends, psychology, market research feedback. Performance decrease vectors Declining Performance Graph with Emotions and Individual Representation. Line graph showing downward trend, large sad face, smaller happy face, and individual figure. Ideal for performance analysis, emotions tracking, business trends, psychology, market research feedback
Free with trial Minimalistic human head profile alongside descending bar chart, showcasing analysis, statistics, and progress trends. Ideal for business, evaluation, decision-making, trends, growth performance. Performance decrease illustrations Human Profile Beside Downward Bar Chart Representing Analytics and Performance Trends. Minimalistic human head profile alongside descending bar chart, showcasing analysis, statistics, and progress trends. Ideal for business, evaluation, decision-making, trends, growth performance
Free with trial Bar chart with descending bars and dashed arrow illustrating decline in value or trend analysis. Ideal for business, finance, economy, performance, forecasting, data, and growth planning. Simple flat. Performance decrease illustrations Declining Bar Chart with Dashed Arrow Representing Decrease and Trend Analysis. Bar chart with descending bars and dashed arrow illustrating decline in value or trend analysis. Ideal for business, finance, economy, performance, forecasting, data, and growth planning. Simple flat
Free with trial Simple black and white vector illustration showing bar charts indicating increase and decrease, perfect for financial or data concepts. Performance decrease vectors Bar chart icon showing increase and decrease data. Simple black and white vector illustration showing bar charts indicating increase and decrease, perfect for financial or data concepts
Free with trial A line art icon depicting business performance analysis. Performance decrease illustrations Gear, Chart, Envelope Business Performance Analysis Icon. A line art icon depicting business performance analysis.
Free with trial Sad face beside a downward trend graph with red nodes, a pointing hand, blue card. Ideal for business loss, economic decline, poor performance, failure, recession, financial crisis simple flat. Performance decrease vectors Declining Line Graph with Sad Face and Pointer Highlighting Negative Performance. Sad face beside a downward trend graph with red nodes, a pointing hand, blue card. Ideal for business loss, economic decline, poor performance, failure, recession, financial crisis simple flat
Free with trial Downward trend line on grid chart with sad face and progress icon signaling mediocre results or declining metrics. Ideal for failure, analytics, market loss, strategy, performance, results, simple. Performance decrease illustrations Declining Trend on Graph with Sad Face Symbolizing Negative Results or Performance. Downward trend line on grid chart with sad face and progress icon signaling mediocre results or declining metrics. Ideal for failure, analytics, market loss, strategy, performance, results, simple
Free with trial Swirling arrow pointing down suitable for concepts related to finance, economy, statistics, business and market trends, expressing a negative performance or decrease. Performance decrease illustrations Swirling arrow pointing down suitable for concepts related to finance, economy, statistics, business and market trends
Free with trial Business decline chart or bar graph icon. Decrease, loss, and financial crisis sign symbol vector. Performance decrease vectors Business decline chart or bar graph icon. Decrease, loss, and financial crisis sign symbol
Free with trial Sad face beside a descending line graph with plotted points, accompanied by a robot holding a data file. Ideal for technology, analytics, business insights, AI impact, performance review. Performance decrease vectors Declining Trends Analyzed by AI Robot with Sad Face Indicating Negative Performance. Sad face beside a descending line graph with plotted points, accompanied by a robot holding a data file. Ideal for technology, analytics, business insights, AI impact, performance review
Free with trial Chart illustrating performance trends with emotive faces, team photos, analytic symbols thumbs up an atom and checkmark. Ideal for teamwork, strategy, data, feedback, process, analysis charts. Performance decrease vectors Business Performance Trends Featuring Emotional Reactions Across Team Members and Analytics. Chart illustrating performance trends with emotive faces, team photos, analytic symbols thumbs up an atom and checkmark. Ideal for teamwork, strategy, data, feedback, process, analysis charts
Free with trial Sad face next to bug and downward bar chart symbolizing technical failures, system errors, or negative trends. Ideal for technology, software development, cybersecurity, troubleshooting, performance. Performance decrease vectors Sad face with bug and declining chart representing software issues or performance failures. Sad face next to bug and downward bar chart symbolizing technical failures, system errors, or negative trends. Ideal for technology, software development, cybersecurity, troubleshooting, performance
Free with trial Statistic Bar Chart Outline Sign Data Stats Business Performance Market Analysis Economic Trend Line Icon Presentation Display Board Symbol. Performance decrease vectors Statistic Bar Chart Outline Sign Data Stats Business Performance Market Analysis Economic Trend Line Icon Presentation Display
Free with trial Colorful bar charts are presenting statistical trends and business performance data across different time periods. Possibly days of the week. Using a vibrant color scheme of blue. Purple. And orange. Performance decrease vectors Colorful bar charts are presenting statistical trends and business performance data across different time periods
Free with trial Gear icon beside descending bar chart emphasizing reduction trends. Ideal for performance assessment, process decline, economic studies, management, analytics, workflow, simple flat metaphor. Performance decrease illustrations Gear and Declining Bar Chart Representing Process Downsizing or Performance Reduction. Gear icon beside descending bar chart emphasizing reduction trends. Ideal for performance assessment, process decline, economic studies, management, analytics, workflow, simple flat metaphor
Free with trial A bold, three-dimensional red arrow illustrates a sharp downward trend, resembling a stock market graph or financial chart. The arrow's segmented, zigzagging path signifies decline, loss, or negative performance. Isolated on a transparent background, this graphic is versatile for representing economic downturns, business failures, or any concept of decrease and regression. Performance decrease illustrations Red Arrow Graph Showing Downward Trend. A bold, three-dimensional red arrow illustrates a sharp downward trend, resembling a stock market graph or financial chart. The arrow's segmented, zigzagging path signifies decline, loss, or negative performance. Isolated on a transparent background, this graphic is versatile for representing economic downturns, business failures, or any concept of decrease and regression.
Free with trial Percentage Decrease Bar Chart Icons for Financial Reports and Analytics vol 34492. Performance decrease vectors Percentage Decrease Bar Chart Icons for Financial Reports and Analytics
Free with trial Business strategy, performance analysis, goal setting, success tracking, financial growth, decision-making. Visual includes bar chart, target with an arrow and directional arrows. Business strategy. Performance decrease vectors Business Growth, Performance Metrics, and Success Concept with Charts, Arrows, and Target Symbol. Business strategy, performance analysis, goal setting, success tracking, financial growth, decision-making. Visual includes bar chart, target with an arrow and directional arrows. Business strategy
Free with trial A vibrant pink 3D bar chart illustrates financial data with a prominent downward-trending arrow superimposed. The bars decrease in height from left to right, signifying a decline. An upward-pointing arrow is positioned at the top left, indicating a contrasting upward trend. The graphic is isolated on a white background, making it suitable for presentations on financial performance, market trends,. Performance decrease illustrations 3D Pink Bar Chart with Downward Trend Arrow and Upward Trend Arrow graph statistics. A vibrant pink 3D bar chart illustrates financial data with a prominent downward-trending arrow superimposed. The bars decrease in height from left to right, signifying a decline. An upward-pointing arrow is positioned at the top left, indicating a contrasting upward trend. The graphic is isolated on a white background, making it suitable for presentations on financial performance, market trends,
Free with trial Computer monitor next to red error mark and downward graph. Ideal for themes of error, data analysis, poor performance, system failure, troubleshooting, warnings, technology issues. Simple flat. Performance decrease vectors Computer screen with error mark and declining graph symbolizing technical issues or performance drop. Computer monitor next to red error mark and downward graph. Ideal for themes of error, data analysis, poor performance, system failure, troubleshooting, warnings, technology issues. Simple flat
Free with trial A 3D financial chart depicting a stock market downturn. The chart features blue and pink bar graphs with numerical values like 45,971 and 37,020. A red downward-curving line with arrows illustrates the declining trend. The background is dark, emphasizing the vibrant colors of the bars and line. Small numbers indicate data points along the bottom, highlighting the decrease in value over time. The visual representation effectively conveys a negative financial trend. Performance decrease illustrations Declining Stock Market Performance Financial Charts Showing Downturn Trend. A 3D financial chart depicting a stock market downturn. The chart features blue and pink bar graphs with numerical values like 45,971 and 37,020. A red downward-curving line with arrows illustrates the declining trend. The background is dark, emphasizing the vibrant colors of the bars and line. Small numbers indicate data points along the bottom, highlighting the decrease in value over time. The visual representation effectively conveys a negative financial trend.
Free with trial A black and white icon depicts a laptop with a downward-trending graph on the screen. The graph features a zigzagging line sloping downward, ending with an arrow. The design implies a decrease, decline, or loss in data or performance, commonly used in financial or business contexts. Simple and minimalistic, it effectively communicates the concept of negative change in a digital context. Performance decrease vectors Laptop with a downward-trending graph
Free with trial Decline bar chart with downward trend arrow outline icon vector. Decrease, loss, and financial drop symbol in black circle. Performance decrease vectors Decline bar chart with downward trend arrow outline icon. Decrease, loss, and financial drop symbol in black circle
Free with trial A single, large, shiny green arrow curves downwards on a white background. The arrow has a smooth, glossy surface that reflects light, giving it a three-dimensional appearance. The arrowhead points directly downwards, indicating a direction of descent or decrease. The vibrant green color and polished finish make the arrow stand out prominently. Performance decrease illustrations Shiny Green Downward Curved Arrow on a White Background direction decrease. A single, large, shiny green arrow curves downwards on a white background. The arrow has a smooth, glossy surface that reflects light, giving it a three-dimensional appearance. The arrowhead points directly downwards, indicating a direction of descent or decrease. The vibrant green color and polished finish make the arrow stand out prominently
Free with trial Decrease : Decrease represents a decline in value, performance, income, or financial resources. Performance decrease vectors Illustration of Decrease. Decrease : Decrease represents a decline in value, performance, income, or financial resources.
Free with trial Analysis growing loss graph illustration data visualization, metrics performance, decrease increase analysis growing loss graph. Performance decrease illustrations Analysis growing loss graph
Free with trial Gear mechanism with people icons falling beneath a large down arrow, illustrating decrease in metrics, performance decline, workflow reduction and lowered efficiency in business or system settings. Performance decrease vectors Gear mechanism indicating reducing downward process. Gear mechanism with people icons falling beneath a large down arrow, illustrating decrease in metrics, performance decline, workflow reduction and lowered efficiency in business or system settings
Free with trial This vector graphic depicts declining performance with a gear, descending graph, downward arrow, and a 24-hour clock. Performance decrease illustrations Declining Performance Gear, Graph, Arrow, 24 Hours Icon. This vector graphic depicts declining performance with a gear, descending graph, downward arrow, and a 24-hour clock.
Free with trial A 3D rendering of a bar chart featuring three colorful columns: blue, orange, and green, increasing in height from left to right. Two prominent red downward arrows are positioned above the tallest green bar, clearly indicating a decline, decrease, or negative trend. The minimalist design on a clean white background makes it ideal for illustrating business performance, financial reports, economic downturns, sales drops, or any data visualization requiring a clear representation of a negative change or warning. Perfect for presentations, infographics, and analytical content. Performance decrease vectors 3D Bar Chart with Red Downward Arrows Showing Decline. A 3D rendering of a bar chart featuring three colorful columns: blue, orange, and green, increasing in height from left to right. Two prominent red downward arrows are positioned above the tallest green bar, clearly indicating a decline, decrease, or negative trend. The minimalist design on a clean white background makes it ideal for illustrating business performance, financial reports, economic downturns, sales drops, or any data visualization requiring a clear representation of a negative change or warning. Perfect for presentations, infographics, and analytical content.
Free with trial A 3D bar chart rendered in a vibrant pink color illustrates a downward trend. The bars decrease in height from left to right, representing a decline in data or performance. A thick pink arrow with a sharp point follows the descending path of the bars, reinforcing the concept of a decrease. The chart is presented in isolation against a clean white background, making the visual elements stand out. Performance decrease illustrations Pink Bar Chart with a Downward Trending Arrow Symbolizing Decline graph magenta. A 3D bar chart rendered in a vibrant pink color illustrates a downward trend. The bars decrease in height from left to right, representing a decline in data or performance. A thick pink arrow with a sharp point follows the descending path of the bars, reinforcing the concept of a decrease. The chart is presented in isolation against a clean white background, making the visual elements stand out
Free with trial This abstract financial graph visually represents a significant economic downturn or market decline. A prominent, bold red arrow sharply points downwards across a blue grid background, symbolizing loss, recession, or a negative trend. A lighter blue fluctuating line also shows a general downward trajectory, indicating market volatility or a secondary metric. This impactful illustration is ideal for conveying concepts of financial crisis, business failure, falling stock prices, or any situation involving a sharp decrease and poor performance. Performance decrease vectors Economic Downturn Graph with Red Arrow Showing Decline. This abstract financial graph visually represents a significant economic downturn or market decline. A prominent, bold red arrow sharply points downwards across a blue grid background, symbolizing loss, recession, or a negative trend. A lighter blue fluctuating line also shows a general downward trajectory, indicating market volatility or a secondary metric. This impactful illustration is ideal for conveying concepts of financial crisis, business failure, falling stock prices, or any situation involving a sharp decrease and poor performance.
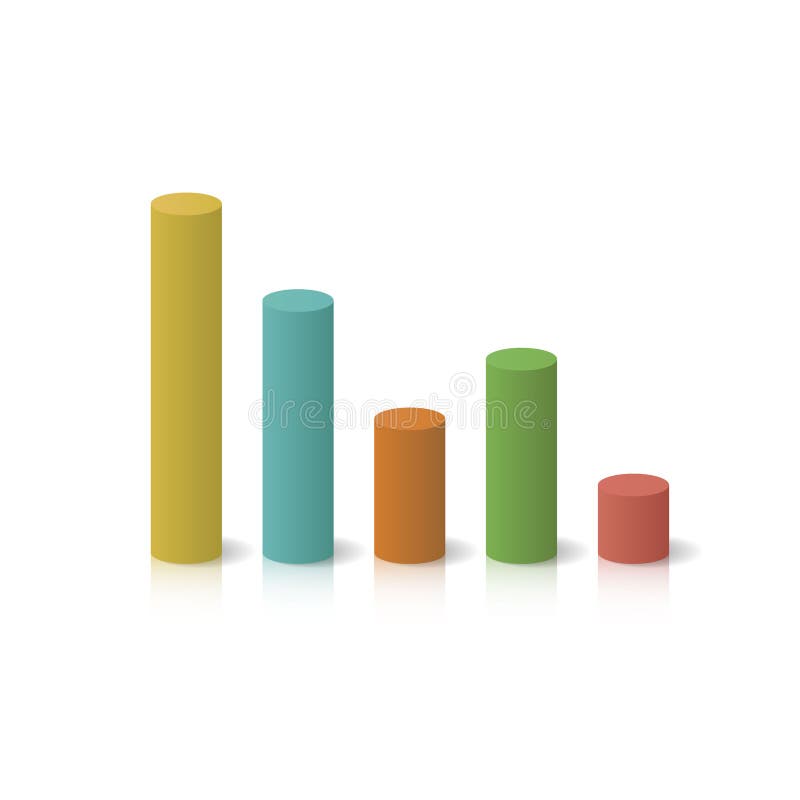
Free with trial Isometric colorful cylinder bar graph showing a financial decline. 3D chart representing loss, decrease, and business drop symbol. Performance decrease vectors Isometric colorful cylinder bar graph showing a financial decline. 3D chart representing loss, decrease, and business drop