Free with trial Sales performance, data analysis, business strategy, financial downturn, decision making, marketing insights. Arrow pointing down with sale text, charts check mark. Sales performance and data. Performance decrease vectors Sales Analytics and Performance Metrics with Downward Trends and Checkmark. Sales performance, data analysis, business strategy, financial downturn, decision making, marketing insights. Arrow pointing down with sale text, charts check mark. Sales performance and data
Free with trial A flat vector icon of a line graph showing a downward trend. Represents financial loss, market decline, negative statistics, or decreasing performance. Suitable for business reports, financial news, or graphics illustrating economic downturns, vector design Generative AI. Performance decrease vectors Downward trending line graph icon financial market decrease, vector design Generative AI. A flat vector icon of a line graph showing a downward trend. Represents financial loss, market decline, negative statistics, or decreasing performance. Suitable for business reports, financial news, or graphics illustrating economic downturns, vector design Generative AI
Free with trial Declining steps with downward arrow symbolizing business market decrease economic downturn. Performance decrease vectors Declining steps with downward arrow symbolizing business market decrease economic downturn
Free with trial An illustration featuring two contrasting arrows against a plain white background. The red arrow shows a wavy upward trend, symbolizing growth, increase, or positive performance with fluctuation. The black arrow shows a wavy downward trend, symbolizing decline, decrease, or negative performance with fluctuation. This visual concept is often used to represent financial market volatility, business. Performance decrease vectors Dynamic business trends illustrated by contrasting red upward and black downward arrows Vector. An illustration featuring two contrasting arrows against a plain white background. The red arrow shows a wavy upward trend, symbolizing growth, increase, or positive performance with fluctuation. The black arrow shows a wavy downward trend, symbolizing decline, decrease, or negative performance with fluctuation. This visual concept is often used to represent financial market volatility, business
Free with trial Outline vector graphic depicting a decline in business performance. Performance decrease illustrations Declining Performance Gear, Man, Graph, Arrow. Business Downturn. Outline vector graphic depicting a decline in business performance.
Free with trial A stylized, flat design illustration of a bar chart depicting a downward trend. The bars are colored red, yellow, and blue, arranged in decreasing height from left to right. A prominent red arrow points downwards across the chart, emphasizing the decline. The graphic is set against a clean white background, making it ideal for presentations, reports, and financial concepts related to loss, decrease, or negative performance. Performance decrease illustrations Declining Bar Chart with Downward Arrow. A stylized, flat design illustration of a bar chart depicting a downward trend. The bars are colored red, yellow, and blue, arranged in decreasing height from left to right. A prominent red arrow points downwards across the chart, emphasizing the decline. The graphic is set against a clean white background, making it ideal for presentations, reports, and financial concepts related to loss, decrease, or negative performance.
Free with trial This image presents a detailed analysis of business performance metrics, including market share, quarterly sales, and key performance indicators (KPIs. Performance decrease illustrations Comprehensive business performance metrics and growth analysis. This image presents a detailed analysis of business performance metrics, including market share, quarterly sales, and key performance indicators (KPIs
Free with trial Business growth and decline icon in black circle. Up and down trend chart symbol illustration. Increase and decrease bar graph concept. Performance decrease vectors Business growth and decline icon in black circle. Up and down trend chart symbol. Increase and decrease bar graph concept
Free with trial A 3D render illustrating a concept of financial decline and economic recession. The image features a red bar chart with progressively shorter bars, indicating a downward trend. A bold, red arrow follows this negative trajectory, pointing sharply downwards. Set against a clean, neutral gray background, this graphic powerfully symbolizes concepts like business failure, stock market crash, investment loss, sales decrease, and economic crisis. It's a perfect visual for presentations, reports, and articles discussing financial downturns, poor performance, and negative growth. Performance decrease illustrations Financial Decline Graph with Red Arrow Down. A 3D render illustrating a concept of financial decline and economic recession. The image features a red bar chart with progressively shorter bars, indicating a downward trend. A bold, red arrow follows this negative trajectory, pointing sharply downwards. Set against a clean, neutral gray background, this graphic powerfully symbolizes concepts like business failure, stock market crash, investment loss, sales decrease, and economic crisis. It's a perfect visual for presentations, reports, and articles discussing financial downturns, poor performance, and negative growth.
Free with trial Minimal light bulb icon with minus symbol representing reduction, decrease, and minimal concepts. Suitable for subtraction, limitation, and simplification themes. Performance decrease vectors Light bulb icon with minus symbol representing reduction decrease and minimal concept idea illustration. Minimal light bulb icon with minus symbol representing reduction, decrease, and minimal concepts. Suitable for subtraction, limitation, and simplification themes
Free with trial This image depicts a bar graph with a clear downward trend. Blue bars decrease in height from left to right, representing a decline in value. A bold red arrow overlays the bars, visually emphasizing the negative trend. A blue line also shows a downward trend. The image conveys a sense of loss, recession, or negative performance and is suitable for illustrating financial or economic concepts. Performance decrease illustrations Declining Bar Graph with Downward Trend Lines. This image depicts a bar graph with a clear downward trend. Blue bars decrease in height from left to right, representing a decline in value. A bold red arrow overlays the bars, visually emphasizing the negative trend. A blue line also shows a downward trend. The image conveys a sense of loss, recession, or negative performance and is suitable for illustrating financial or economic concepts.
Free with trial A 3D golden bar chart illustrates a declining trend, with a sharp downward arrow indicating a significant decrease in performance or value. Isolated on a white background. Performance decrease illustrations Golden downward trending bar chart with arrow. A 3D golden bar chart illustrates a declining trend, with a sharp downward arrow indicating a significant decrease in performance or value. Isolated on a white background
Free with trial A visual representation of a declining trend, depicted by a blue bar chart with a prominent downward-pointing arrow, indicating a decrease in performance or value. Performance decrease illustrations Blue bar chart with a downward trending arrow. A visual representation of a declining trend, depicted by a blue bar chart with a prominent downward-pointing arrow, indicating a decrease in performance or value
Free with trial Percent Arrow Icons Set: Growth, Increase, Decrease Filled Up and Down Arrows. Performance decrease vectors Percent Arrow Icons Set: Growth, Increase, Decrease Filled Up and Down Arrows
Free with trial A clear vector illustration of a line graph showing a downward trend. Represents financial decline, negative performance, market downturns, or decreasing metrics. Ideal for business reports, financial analysis, economic indicators, or risk assessment. It visually communicates a decrease or a challenging period, vector design Generative AI. Performance decrease vectors Downtrend Line Graph Financial Market Decline, vector design Generative AI. A clear vector illustration of a line graph showing a downward trend. Represents financial decline, negative performance, market downturns, or decreasing metrics. Ideal for business reports, financial analysis, economic indicators, or risk assessment. It visually communicates a decrease or a challenging period, vector design Generative AI
Free with trial Symbolizes decline or decrease, often used in financial or performance contexts to represent a downward trend. The arrow is solid red with sharp corners, maintaining a uniform thickness throughout its length. Performance decrease illustrations Red zigzag arrow pointing diagonally downward on a transparent grid background. . Symbolizes decline or decrease, often used in financial or performance contexts to represent a downward trend. The arrow is solid red with sharp corners, maintaining a uniform thickness throughout its length.
Free with trial This vector illustration features a set of two minimalist graphs depicting a significant decline. Each graph includes a downward-sloping line chart with an accompanying filled area, clearly indicating a negative trend. One version is presented in black on a white background, while the other is white on a black background, offering versatile usage. This icon is ideal for illustrating concepts of business loss, economic recession, market downturns, financial crisis, poor performance, or any data showing a decrease. Perfect for presentations, reports, infographics, and web design. Performance decrease vectors Declining Business Graph Icon Set - Negative Trend Chart. This vector illustration features a set of two minimalist graphs depicting a significant decline. Each graph includes a downward-sloping line chart with an accompanying filled area, clearly indicating a negative trend. One version is presented in black on a white background, while the other is white on a black background, offering versatile usage. This icon is ideal for illustrating concepts of business loss, economic recession, market downturns, financial crisis, poor performance, or any data showing a decrease. Perfect for presentations, reports, infographics, and web design.
Free with trial A visual representation of a financial or business trend showing a steady decrease over time. The bar chart illustrates negative performance with a prominent downward arrow. Performance decrease illustrations Declining bar chart showing downward trend with arrow. A visual representation of a financial or business trend showing a steady decrease over time. The bar chart illustrates negative performance with a prominent downward arrow
Free with trial A simple yet effective downward sloping arrow indicating a declining trend or negative progress. This infographic element is ideal for business reports, financial charts, educational materials, or presentations needing to visualize a decrease in value or performance over time. vector design Generative AI. Performance decrease vectors Downward Sloping Graph Arrow for Declining Trends, vector design Generative AI. A simple yet effective downward sloping arrow indicating a declining trend or negative progress. This infographic element is ideal for business reports, financial charts, educational materials, or presentations needing to visualize a decrease in value or performance over time. vector design Generative AI
Free with trial Downward trend line on a graph, sad face emoticon, verified user profile. Ideal for analytics, decline monitoring, user feedback, quality control, performance review, error tracking simple flat. Performance decrease vectors Declining Performance Chart with Sad Face and User Profile Checkmark. Downward trend line on a graph, sad face emoticon, verified user profile. Ideal for analytics, decline monitoring, user feedback, quality control, performance review, error tracking simple flat
Free with trial A modern business analytics dashboard showcasing key performance indicators (KPIs) with engaging charts and graphs for data visualization Ideal for presentations and reports. Generative AI. Performance decrease illustrations Business Analytics Dashboard Graphs Charts Data Performance Growth Metrics KPI. A modern business analytics dashboard showcasing key performance indicators (KPIs) with engaging charts and graphs for data visualization Ideal for presentations and reports. Generative AI
Free with trial Data Stats Board Display Line Icon Downward Down Trend Statistic Performance Market Decline Economy Downturn Bar Graph Progress Outline Presentation. Performance decrease vectors Data Stats Board Display Line Icon Downward Down Trend Statistic Performance Market Decline Economy Downturn Bar Graph
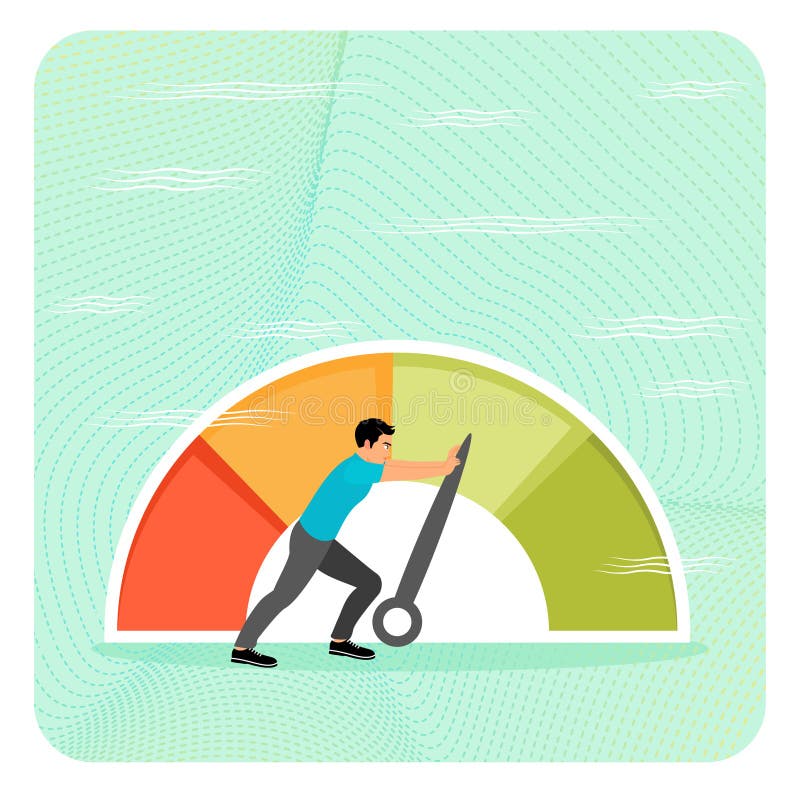
Free with trial Reduce risk level concept or decrease stress anxiety meter. Effort and drive as a person pushes a big gauge toward green, symbolizing reduce risk or stress level. Performance decrease vectors Reduce risk level concept or decrease stress anxiety meter
Free with trial Crypto currency crash and going down, Entrepreneurial investor participating in rodeo experiences a decrease in the red arrow graph, facing uncertainty. Performance decrease vectors Crypto currency crash and going down, Entrepreneurial investor participating in rodeo experiences a decrease in the red arrow
Free with trial A pair of minimalist line graphs illustrating a downward trend, presented in a high-contrast black on white and white on black design. The arrow at the end clearly indicates a decline, representing concepts like loss, decrease, negative growth, or recession. Ideal for financial reports, business presentations, economic news, data visualization, or any content requiring a clear symbol for falling statistics or poor performance. Performance decrease vectors Downward Trend Graph Icon Set - Black and White Decline Chart. A pair of minimalist line graphs illustrating a downward trend, presented in a high-contrast black on white and white on black design. The arrow at the end clearly indicates a decline, representing concepts like loss, decrease, negative growth, or recession. Ideal for financial reports, business presentations, economic news, data visualization, or any content requiring a clear symbol for falling statistics or poor performance.
Free with trial Gear beside a chart showing a declining line and sad face emphasizes failure, setback, frustration. Ideal for business analytics, challenges, productivity, negativity, technology, performance drop. Performance decrease illustrations Declining Performance Representation with Sad Face and Falling Graph Line. Gear beside a chart showing a declining line and sad face emphasizes failure, setback, frustration. Ideal for business analytics, challenges, productivity, negativity, technology, performance drop
Free with trial Data Stats Board Display Icon Downward Down Trend Statistic Performance Market Decline Economy Downturn Bar Graph Progress Sign Symbol Presentation. Performance decrease vectors Data Stats Board Display Icon Downward Down Trend Statistic Performance Market Decline Economy Downturn Bar Graph Progress
Free with trial Businessman lifting up percentage sign. concept of Inflation or interest rate falling down, decrease, profit fall in economic recession. Performance decrease vectors Businessman lifting up percentage sign. concept of Inflation or interest rate falling down, decrease, profit fall in economic
Free with trial A hand in a black suit sleeve points downward against a red background. A jagged downward arrow, representing decline or decrease, is displayed in the background. The color palette includes flesh tones for the hand and bright red for the background. The image conveys a sense of negative economic or financial performance. Performance decrease illustrations A hand in a black suit sleeve points downward against a red background. A jagged
Free with trial A bright yellow arrow curves downwards indicating a downward trend, decrease, or decline. Ideal for presentations on finance, market analysis, or performance changes. Performance decrease illustrations Yellow arrow pointing downward showing a decline or falling trend. A bright yellow arrow curves downwards indicating a downward trend, decrease, or decline. Ideal for presentations on finance, market analysis, or performance changes
Free with trial A hand holds a glowing digital display showing a percentage increase in quality and a percentage decrease in cost symbolizing business success and efficiency. Performance decrease illustrations Business growth conceptual hand displaying quality percentage increase and cost percentage decrease. A hand holds a glowing digital display showing a percentage increase in quality and a percentage decrease in cost symbolizing business success and efficiency
Free with trial A clear vector illustration of a declining line graph, symbolizing market downturn, economic challenges, and negative trends. Ideal for financial reports, business analysis, and risk assessment. Represents a decrease in performance and a need for strategic adjustments, vector design Generative AI. Performance decrease vectors Declining Line Graph for Market Downturn and Economic Challenges, vector design Generative AI. A clear vector illustration of a declining line graph, symbolizing market downturn, economic challenges, and negative trends. Ideal for financial reports, business analysis, and risk assessment. Represents a decrease in performance and a need for strategic adjustments, vector design Generative AI
Free with trial A vibrant, flat-design illustration depicts a bar graph with a downward-trending arrow, suggesting a decline in data. The graph features bars in red, yellow, green, and blue, set against a clean white background. The composition is simple, yet conveys a clear message of financial or performance decrease. Performance decrease illustrations Colorful Bar Graph with Declining Trend and Arrows, Business Concept. A vibrant, flat-design illustration depicts a bar graph with a downward-trending arrow, suggesting a decline in data. The graph features bars in red, yellow, green, and blue, set against a clean white background. The composition is simple, yet conveys a clear message of financial or performance decrease
Free with trial A vector icon of a descending line graph on a green base, illustrating a downward trend, decrease, or decline in data. Represents financial loss, reduced performance, or negative growth. Suitable for business reports, statistical analysis, and economic presentations, vector design Generative AI. Performance decrease vectors Descending Line Graph Decline Trend Chart Icon, vector design Generative AI. A vector icon of a descending line graph on a green base, illustrating a downward trend, decrease, or decline in data. Represents financial loss, reduced performance, or negative growth. Suitable for business reports, statistical analysis, and economic presentations, vector design Generative AI
Free with trial A simple red line graph showing a sharp downward trend with an arrow indicating a significant decrease, symbolizing loss or decline in performance. Performance decrease illustrations Red downward trending graph isolated on white background. A simple red line graph showing a sharp downward trend with an arrow indicating a significant decrease, symbolizing loss or decline in performance
Free with trial This graphic depicts a bar chart with a downward trending line, observed closely with a magnifying glass, symbolizing scrutiny, analysis, and potential performance decline or investigation of data. Performance decrease vectors Declining Chart with Magnifying Glass: Analysis and Performance Review. This graphic depicts a bar chart with a downward trending line, observed closely with a magnifying glass, symbolizing scrutiny, analysis, and potential performance decline or investigation of data.
Free with trial Reduce risk level or decrease stress anxiety meter concept. Determined businessman pulling the needle on a multicolored gauge scale, representing effort to reduce risk or stress level. Performance decrease vectors Reduce risk level or decrease stress anxiety meter concept. Businessman pull meter. Reduce risk level or decrease stress anxiety meter concept. Determined businessman pulling the needle on a multicolored gauge scale, representing effort to reduce risk or stress level
Free with trial A collection of icons featuring increase and decrease symbols in various styles, ideal for financial and business presentations on white background. Performance decrease vectors A collection of icons featuring increase and decrease symbols in various styles, ideal for financial and business presentations
Free with trial This infographic-style image visually represents business growth and financial performance through various charts and graphs. A line graph illustrates revenue trends with percentage markers, a donut chart displays market share distribution, and a bar chart shows quarterly profit figures. Icons representing data, growth, and reports are subtly integrated into the background, creating a professional and informative visual for business and finance-related content. Performance decrease illustrations Business Growth and Financial Performance Analytics. This infographic-style image visually represents business growth and financial performance through various charts and graphs. A line graph illustrates revenue trends with percentage markers, a donut chart displays market share distribution, and a bar chart shows quarterly profit figures. Icons representing data, growth, and reports are subtly integrated into the background, creating a professional and informative visual for business and finance-related content.
Free with trial Downward blue arrow, hand gesture, and declining bar graph. Ideal for business loss, negative trends, economy, failure, recession setback performance. Simple flat metaphor. Performance decrease illustrations Downward Arrow with Hand and Declining Bar Graph Representing Business Loss or Decrease. Downward blue arrow, hand gesture, and declining bar graph. Ideal for business loss, negative trends, economy, failure, recession setback performance. Simple flat metaphor
Free with trial Laptop financial loss. Screen dollar decrease. Business decline graph. Vector economy illustration. EPS 10. Performance decrease vectors Laptop financial loss. Screen dollar decrease. Business decline graph. Vector economy illustration.
Free with trial Increase and Decrease Stroke icon collections. Containing Increase, Decrease, Growth, Fall, up, down icons. Editable Stroke icon collections. Performance decrease vectors Increase and Decrease Stroke icon collections.
Free with trial A stacked area chart performance data with distinct colored segments in a rainbow gradient. The vertical axis percentages from 0% to 170%, and the horizontal axis percentage values. Performance decrease illustrations Stacked area chart showing level performance with rainbow colors and percentage axis graph data. A stacked area chart performance data with distinct colored segments in a rainbow gradient. The vertical axis percentages from 0% to 170%, and the horizontal axis percentage values
Free with trial A bold, glossy red arrow curves downwards, signifying a decrease in business performance, economic downturn, or negative trend. Its sleek design conveys a clear message of decline. Performance decrease illustrations Glossy red downward arrow symbolizing decline progress and business trends. A bold, glossy red arrow curves downwards, signifying a decrease in business performance, economic downturn, or negative trend. Its sleek design conveys a clear message of decline
Free with trial A sharp red arrow points downwards, illustrating a significant decrease or failure. This visual metaphor is commonly used to represent economic recession, stock market losses, or declining performance. Performance decrease illustrations Red downward trend arrow symbolizing financial decline and market downturn. A sharp red arrow points downwards, illustrating a significant decrease or failure. This visual metaphor is commonly used to represent economic recession, stock market losses, or declining performance
Free with trial Business performance decline icon vector. Productivity drop and process efficiency loss symbol. Performance decrease vectors Business performance decline icon. Productivity drop and process efficiency loss symbol
Free with trial A vivid red arrow signifies a downward trend or negative movement. This impactful graphic represents decline loss decrease and is ideal for illustrating financial reports or data trends. Performance decrease illustrations Bold red arrow points downward showing decline loss decrease trend direction. A vivid red arrow signifies a downward trend or negative movement. This impactful graphic represents decline loss decrease and is ideal for illustrating financial reports or data trends
Free with trial A simple line graph icon showing a downward trend, representing statistics, data, or a decline in performance. Useful for financial reports, market analysis, or educational materials. Its clear visual direction conveys negative momentum or a decrease, vector design Generative AI. Performance decrease vectors Downward Trend Line Graph Icon for Statistics and Data, vector design Generative AI. A simple line graph icon showing a downward trend, representing statistics, data, or a decline in performance. Useful for financial reports, market analysis, or educational materials. Its clear visual direction conveys negative momentum or a decrease, vector design Generative AI
Free with trial Increase and decrease arrows on black background. Performance decrease illustrations Increase and decrease arrows on black
Free with trial Colorful Bar Chart Graph Showing Growth and Performance Over Time with Upward Trend. Performance decrease vectors Colorful Bar Chart Graph Showing Growth and Performance Over Time with Upward Trend
Free with trial A flat vector icon showing a line graph with a distinct downward trend. Represents decline, decrease, negative growth, or falling performance. Suitable for business analysis, financial reports, or graphics illustrating negative progress or statistics, vector design Generative AI. Performance decrease vectors Downward line graph icon representing negative trend decline, vector design Generative AI. A flat vector icon showing a line graph with a distinct downward trend. Represents decline, decrease, negative growth, or falling performance. Suitable for business analysis, financial reports, or graphics illustrating negative progress or statistics, vector design Generative AI
Free with trial A simple bar chart with a falling line, symbolizing financial decline, economic downturn, decreased profits, market loss, or negative business results. Ideal for illustrating risks, challenges, crisis situations, and economic analysis. Performance decrease vectors Declining financial chart icon with downward trend showing loss, decrease and negative business performance. A simple bar chart with a falling line, symbolizing financial decline, economic downturn, decreased profits, market loss, or negative business results. Ideal for illustrating risks, challenges, crisis situations, and economic analysis.
Free with trial Outline vector icon of a line graph showing a downward trend. Represents decline, loss, decrease, failure, or negative performance in line art. Suitable for financial reports, data analysis, business presentations, and illustrating negative change, vector design Generative AI. Performance decrease vectors Downward Trend Graph Icon Outline, Decline Loss Failure Symbol, vector design Generative AI. Outline vector icon of a line graph showing a downward trend. Represents decline, loss, decrease, failure, or negative performance in line art. Suitable for financial reports, data analysis, business presentations, and illustrating negative change, vector design Generative AI
Free with trial Business decline, performance decrease, market loss or economic failure. Data download. Black cube is showing an arrow symbol on a dark background with reflection. 3d render. Performance decrease illustrations Black cube showing download symbol with yellow glowing light. Business decline, performance decrease, market loss or economic failure. Data download. Black cube is showing an arrow symbol on a dark background with reflection. 3d render
Free with trial Hand drawn style bar graph displaying a continuous downward trend and data decrease arrow. Performance decrease vectors Hand drawn style bar graph displaying a continuous downward trend and data decrease arrow
Free with trial The image depicts a downward trending graph with a red background. The graph bars start high and gradually decrease, culminating in a large downward arrow on the right side. This visual representation suggests a decline in economic performance, sales, or other measured metrics. Performance decrease illustrations Downward economic trend. The image depicts a downward trending graph with a red background. The graph bars start high and gradually decrease, culminating in a large downward arrow on the right side. This visual representation suggests a decline in economic performance, sales, or other measured metrics
Free with trial A stark bar graph illustrates a clear downward trend, symbolized by a descending arrow. This image represents decline, decrease, or negative progression in data. Performance decrease vectors Vector art of bar graph with a downward trend line indicating decline or decrease in data. A stark bar graph illustrates a clear downward trend, symbolized by a descending arrow. This image represents decline, decrease, or negative progression in data
Free with trial A visual representation of market fluctuations and business performance, with a red downward arrow indicating a decrease and a green upward arrow signifying growth and positive trends. Performance decrease illustrations Red down arrow and green up arrow symbols representing financial market trends and business growth. A visual representation of market fluctuations and business performance, with a red downward arrow indicating a decrease and a green upward arrow signifying growth and positive trends
Free with trial This image displays a bar graph visualizing a clear downward trend. Nine vertical blue bars gradually decrease in height from left to right, signifying a consistent decline in values. A white arrowed line diagonally descends across the graph, reinforcing the negative trend. Blue horizontal and vertical grid lines aid in alignment. The background is green screen, allowing for chroma key use. This chart effectively communicates decline in areas like business, finance, or performance. Performance decrease illustrations Downward Bar Graph Showing Financial Decline on Green Screen. This image displays a bar graph visualizing a clear downward trend. Nine vertical blue bars gradually decrease in height from left to right, signifying a consistent decline in values. A white arrowed line diagonally descends across the graph, reinforcing the negative trend. Blue horizontal and vertical grid lines aid in alignment. The background is green screen, allowing for chroma key use. This chart effectively communicates decline in areas like business, finance, or performance.
Free with trial A vibrant red, three-dimensional zigzag arrow sharply points downwards and to the right, set against a transparent background. This striking graphic effectively symbolizes decline, loss, and negative trends across various sectors. It is ideal for illustrating financial downturns, market crashes, economic recessions, falling stock prices, or any situation depicting a decrease in performance. Perfect for business presentations, financial reports, infographics, and news articles requiring a clear visual representation of a downward trajectory or crisis. Performance decrease illustrations Red Downward Zigzag Arrow on Transparent Background. A vibrant red, three-dimensional zigzag arrow sharply points downwards and to the right, set against a transparent background. This striking graphic effectively symbolizes decline, loss, and negative trends across various sectors. It is ideal for illustrating financial downturns, market crashes, economic recessions, falling stock prices, or any situation depicting a decrease in performance. Perfect for business presentations, financial reports, infographics, and news articles requiring a clear visual representation of a downward trajectory or crisis.
Free with trial The image depicts a bar graph with three vertical bars of decreasing height, accompanied by a red downward arrow. The tallest bar is dark blue, the middle bar is light blue, and the shortest bar is light cyan. The red arrow signifies a downward trend or decline in performance or data. Performance decrease illustrations Decline in performance graph. The image depicts a bar graph with three vertical bars of decreasing height, accompanied by a red downward arrow. The tallest bar is dark blue, the middle bar is light blue, and the shortest bar is light cyan. The red arrow signifies a downward trend or decline in performance or data
Free with trial Abstract illustration of a downward trending arrow chart. The arrows are depicted in varying shades of blue and green, suggesting a gradual decline. This image can be used to represent concepts such as loss, decrease, negative growth, or a downward trend in various fields like finance, sales, or performance metrics. The clean background and simple design make it versatile for presentations, reports, and infographics. Performance decrease illustrations Decreasing Trend Arrow Chart. Abstract illustration of a downward trending arrow chart. The arrows are depicted in varying shades of blue and green, suggesting a gradual decline. This image can be used to represent concepts such as loss, decrease, negative growth, or a downward trend in various fields like finance, sales, or performance metrics. The clean background and simple design make it versatile for presentations, reports, and infographics.
Free with trial Business decline bar chart icon vector. Decrease, loss, and financial collapse sign symbol on black circle. Performance decrease vectors Business decline bar chart icon. Decrease, loss, and financial collapse sign symbol on black circle
Free with trial Bar chart icon with downward arrow showing declining business performance, financial loss, recession, negative trend, market crash analytics and falling sales report. Performance decrease vectors Bar chart icon with downward arrow showing declining business performance, financial
Free with trial Trend disintegrating revenue chart illustration decrease loss, downturn metrics, performance data trend disintegrating revenue chart. Performance decrease illustrations Trend disintegrating revenue chart
Free with trial Chart icon showing declining business performance with downward trend, dollar symbol, and briefcase loss marker, monochrome finance analytics graphic on white. Performance decrease vectors Chart icon showing declining business performance with downward trend, dollar symbol, and
Free with trial A 3D rendered bar chart encased in clear glass, displaying year-end business performance. The chart features three vertical bars in blue, pink, and yellow, representing 61%, 24%, and 35% respectively. The clean, modern design and transparent material create a sophisticated visual suitable for presentations, reports, and data visualization concepts related to business growth, financial analysis, and success metrics. Performance decrease illustrations Year End Business Performance Chart. A 3D rendered bar chart encased in clear glass, displaying year-end business performance. The chart features three vertical bars in blue, pink, and yellow, representing 61%, 24%, and 35% respectively. The clean, modern design and transparent material create a sophisticated visual suitable for presentations, reports, and data visualization concepts related to business growth, financial analysis, and success metrics.
Free with trial A minimalist black line graph icon on a clean white background, clearly illustrating a downward trend. The zigzagging line culminates in a sharp arrow pointing downwards, symbolizing decline, decrease, or negative performance. This versatile vector illustration is ideal for representing financial losses, economic downturns, sales drops, market crashes, or any data indicating a negative trajectory. Perfect for business reports, presentations, websites, apps, and infographics requiring a clear visual indicator of reduction or poor results. Performance decrease vectors Downward Trend Graph with Arrow Icon. A minimalist black line graph icon on a clean white background, clearly illustrating a downward trend. The zigzagging line culminates in a sharp arrow pointing downwards, symbolizing decline, decrease, or negative performance. This versatile vector illustration is ideal for representing financial losses, economic downturns, sales drops, market crashes, or any data indicating a negative trajectory. Perfect for business reports, presentations, websites, apps, and infographics requiring a clear visual indicator of reduction or poor results.
Free with trial Bar graph with a downward arrow on a school hallway floor. Concept of declining performance, budget cuts, or failure in education and student outcomes. Performance decrease illustrations Bar graph with a downward arrow on a school hallway floor. Concept of declining performance, budget cuts, or failure in education
Free with trial A versatile vector icon representing a decrease or download process. Performance decrease vectors Data Download or Decrease Vector Icon. A versatile vector icon representing a decrease or download process
Free with trial This minimalist vector illustration depicts a retail store icon integrated into a shopping cart, positioned against a declining line graph. The visual metaphor highlights a negative economic trend or a decrease in consumer activity. The color palette uses muted tones with a bold red accent to emphasize the downward trajectory of the market performance. Performance decrease vectors A line graph showing a downward trend for a retail business concept. This minimalist vector illustration depicts a retail store icon integrated into a shopping. This minimalist vector illustration depicts a retail store icon integrated into a shopping cart, positioned against a declining line graph. The visual metaphor highlights a negative economic trend or a decrease in consumer activity. The color palette uses muted tones with a bold red accent to emphasize the downward trajectory of the market performance
Free with trial A flat design illustration of a bar chart showing a declining trend, with a red arrow pointing downwards, symbolizing a decrease in performance or value. Performance decrease illustrations Bar chart with a downward trend isolated on white background. A flat design illustration of a bar chart showing a declining trend, with a red arrow pointing downwards, symbolizing a decrease in performance or value
Free with trial Decline bar chart with downward trend arrow icon vector. Decrease, loss, and financial drop symbol. Editable stroke. Performance decrease vectors Decline bar chart with downward trend arrow icon. Decrease, loss, and financial drop symbol. Editable stroke
Free with trial The image shows two hands each holding a sign. The left hand holds a sign with a green upward arrow labeled 'Quality,' indicating an increase. The right hand holds a sign with a red downward arrow labeled 'Cost,' indicating a decrease. Performance decrease illustrations Hands holding signs indicating increase in quality and decrease in cost. The image shows two hands each holding a sign. The left hand holds a sign with a green upward arrow labeled 'Quality,' indicating an increase. The right hand holds a sign with a red downward arrow labeled 'Cost,' indicating a decrease
Free with trial Business decline bar chart icon. Decrease, loss, and financial collapse sign symbol vector. Performance decrease vectors Business decline bar chart icon. Decrease, loss, and financial collapse sign symbol