Free with trial Nazca tectonic plate on the solid contour map in the Patterson Cylindrical projection centered meridionally. Distribution of known volcanoes. Plate boundary illustrations Nazca tectonic plate. Contour. Patterson Cylindrical. Volcanoes. Nazca tectonic plate on the solid contour map in the Patterson Cylindrical projection centered meridionally. Distribution of known volcanoes
Free with trial Amur tectonic plate on the solid contour map in the Patterson Cylindrical Oblique projection centered meridionally and latitudinally. Boundaries of other plates. Plate boundary illustrations Amur tectonic plate. Contour. Patterson Cylindrical Oblique. Bou. Amur tectonic plate on the solid contour map in the Patterson Cylindrical Oblique projection centered meridionally and latitudinally. Boundaries of other plates
Free with trial Antarctica tectonic plate on the Blue Marble satellite map in the Patterson Cylindrical projection centered meridionally. Boundaries of other plates. Plate boundary illustrations Antarctica tectonic plate. Satellite. Patterson Cylindrical. Bou. Antarctica tectonic plate on the Blue Marble satellite map in the Patterson Cylindrical projection centered meridionally. Boundaries of other plates
Free with trial Tectonic plate boundaries on the world wikipedia style elevation map in the Times projection centered on the date line. Plate boundary illustrations Tectonic plate boundaries on the world wiki map - 180 PM. Times. Tectonic plate boundaries on the world wikipedia style elevation map in the Times projection centered on the date line
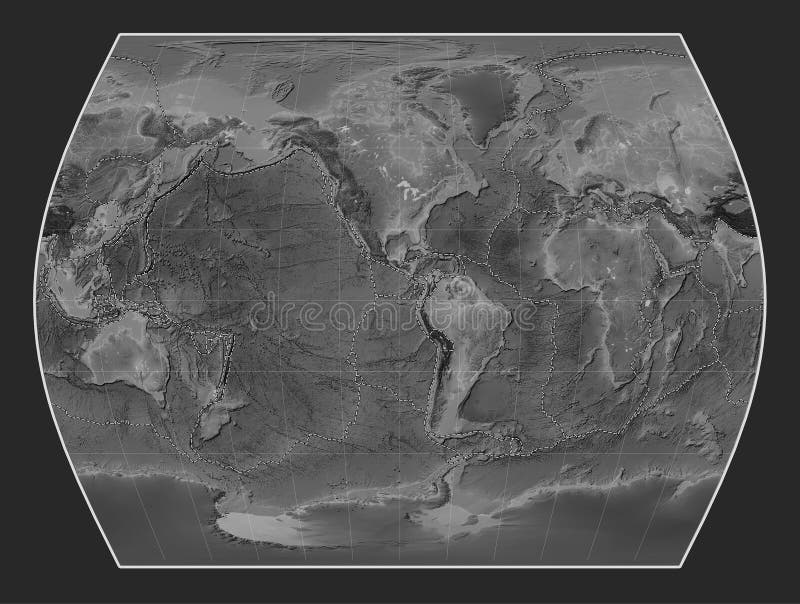
Free with trial Tectonic plate boundaries on the world grayscale elevation map in the Times projection centered on the 90th meridian west longitude. Plate boundary illustrations Tectonic plate boundaries on the world grayscale map - -90 PM. T. Tectonic plate boundaries on the world grayscale elevation map in the Times projection centered on the 90th meridian west longitude
Free with trial Amur tectonic plate on the bilevel elevation map in the Patterson Cylindrical projection centered meridionally. Boundaries of other plates. Plate boundary illustrations Amur tectonic plate. Bilevel. Patterson Cylindrical. Boundaries. Amur tectonic plate on the bilevel elevation map in the Patterson Cylindrical projection centered meridionally. Boundaries of other plates
Free with trial Tectonic plate boundaries on the world blue Marble satellite map in the Times projection centered on the 90th meridian west longitude. Plate boundary illustrations Tectonic plate boundaries on the world satellite map - -90 PM. T. Tectonic plate boundaries on the world blue Marble satellite map in the Times projection. Tectonic plate boundaries on the world blue Marble satellite map in the Times projection centered on the 90th meridian west longitude
Free with trial Amur tectonic plate on the solid contour map in the Patterson Cylindrical projection centered meridionally. Boundaries of other plates. Plate boundary illustrations Amur tectonic plate. Contour. Patterson Cylindrical. Boundaries. Amur tectonic plate on the solid contour map in the Patterson Cylindrical projection centered meridionally. Boundaries of other plates
Free with trial Somalian tectonic plate on the Wiki style elevation map in the Patterson Cylindrical projection centered meridionally. Distribution of known volcanoes. Plate boundary illustrations Somalian tectonic plate. Wiki. Patterson Cylindrical. Volcanoes. Somalian tectonic plate on the Wiki style elevation map in the Patterson Cylindrical projection centered meridionally. Distribution of known volcanoes
Free with trial Okhotsk tectonic plate on the Wiki style elevation map in the Patterson Cylindrical projection centered meridionally. Boundaries of other plates. Plate boundary illustrations Okhotsk tectonic plate. Wiki. Patterson Cylindrical. Boundaries. Okhotsk tectonic plate on the Wiki style elevation map in the Patterson Cylindrical projection centered meridionally. Boundaries of other plates
Free with trial Indian tectonic plate on the Wiki style elevation map in the Patterson Cylindrical projection centered meridionally. Locations of earthquakes above 6. 5 magnitude recorded since the early 17th century. Plate boundary illustrations Indian tectonic plate. Wiki. Patterson Cylindrical. Earthquakes. Indian tectonic plate on the Wiki style elevation map in the Patterson Cylindrical projection centered meridionally. Locations of earthquakes above 6.5 magnitude recorded since the early 17th century
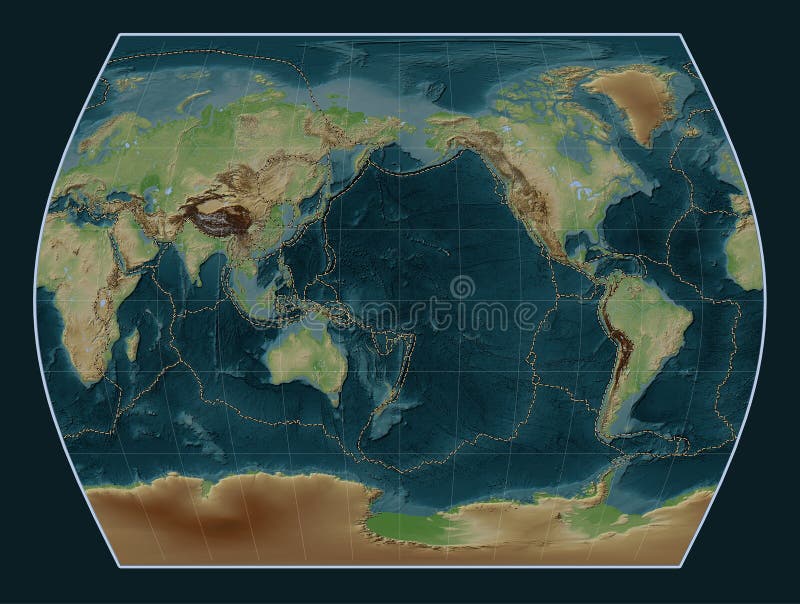
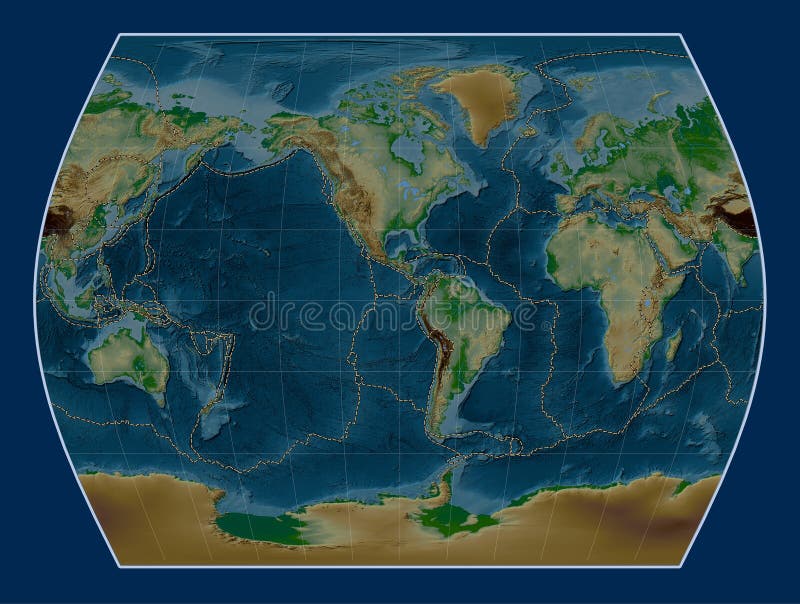
Free with trial Tectonic plate boundaries on the world physical elevation map in the Times projection centered on the 90th meridian west longitude. Plate boundary illustrations Tectonic plate boundaries on the world physical map - -90 PM. Ti. Tectonic plate boundaries on the world physical elevation map in the Times projection centered on the 90th meridian west longitude
Free with trial Okhotsk tectonic plate on the grayscale elevation map in the Patterson Cylindrical projection centered meridionally. Locations of earthquakes above 6. 5 magnitude recorded since the early 17th century. Plate boundary illustrations Okhotsk tectonic plate. Grayscale. Patterson Cylindrical. Earthq. Okhotsk tectonic plate on the grayscale elevation map in the Patterson Cylindrical projection centered meridionally. Locations of earthquakes above 6.5 magnitude recorded since the early 17th century
Free with trial Sunda tectonic plate on the Blue Marble satellite map in the Patterson Cylindrical projection centered meridionally. Distribution of known volcanoes. Plate boundary illustrations Sunda tectonic plate. Satellite. Patterson Cylindrical. Volcanoe. Sunda tectonic plate on the Blue Marble satellite map in the Patterson Cylindrical projection centered meridionally. Distribution of known volcanoes
Free with trial Pacific tectonic plate on the physical elevation map in the Patterson Cylindrical projection centered meridionally. Locations of earthquakes above 6. 5 magnitude recorded since the early 17th century. Plate boundary illustrations Pacific tectonic plate. Physical. Patterson Cylindrical. Earthqu. Pacific tectonic plate on the physical elevation map in the Patterson Cylindrical projection centered meridionally. Locations of earthquakes above 6.5 magnitude recorded since the early 17th century
Free with trial Philippine Sea tectonic plate on the bilevel elevation map in the Patterson Cylindrical projection centered meridionally. Locations of earthquakes above 6. 5 magnitude recorded since the early 17th century. Plate boundary illustrations Philippine Sea tectonic plate. Bilevel. Patterson Cylindrical. E. Philippine Sea tectonic plate on the bilevel elevation map in the Patterson Cylindrical projection centered meridionally. Locations of earthquakes above 6.5 magnitude recorded since the early 17th century
Free with trial Amur tectonic plate on the physical elevation map in the Patterson Cylindrical projection centered meridionally. Locations of earthquakes above 6. 5 magnitude recorded since the early 17th century. Plate boundary illustrations Amur tectonic plate. Physical. Patterson Cylindrical. Earthquake. Amur tectonic plate on the physical elevation map in the Patterson Cylindrical projection centered meridionally. Locations of earthquakes above 6.5 magnitude recorded since the early 17th century
Free with trial Australian tectonic plate on the Blue Marble satellite map in the Patterson Cylindrical projection centered meridionally. Locations of earthquakes above 6. 5 magnitude recorded since the early 17th century. Plate boundary illustrations Australian tectonic plate. Satellite. Patterson Cylindrical. Ear. Australian tectonic plate on the Blue Marble satellite map in the Patterson Cylindrical projection centered meridionally. Locations of earthquakes above 6.5 magnitude recorded since the early 17th century
Free with trial Eurasian tectonic plate on the Wiki style elevation map in the Patterson Cylindrical Oblique projection centered meridionally and latitudinally. Locations of earthquakes above 6. 5 magnitude recorded since the early 17th century. Plate boundary illustrations Eurasian tectonic plate. Wiki. Patterson Cylindrical Oblique. Ea. Eurasian tectonic plate on the Wiki style elevation map in the Patterson Cylindrical Oblique projection centered meridionally and latitudinally. Locations of earthquakes above 6.5 magnitude recorded since the early 17th century
Free with trial Indian tectonic plate on the grayscale elevation map in the Patterson Cylindrical projection centered meridionally. Boundaries of other plates. Plate boundary illustrations Indian tectonic plate. Grayscale. Patterson Cylindrical. Boundar. Indian tectonic plate on the grayscale elevation map in the Patterson Cylindrical projection centered meridionally. Boundaries of other plates
Free with trial Okhotsk tectonic plate on the Wiki style elevation map in the Patterson Cylindrical Oblique projection centered meridionally and latitudinally. Distribution of known volcanoes. Plate boundary illustrations Okhotsk tectonic plate. Wiki. Patterson Cylindrical Oblique. Vol. Okhotsk tectonic plate on the Wiki style elevation map in the Patterson Cylindrical Oblique projection centered meridionally and latitudinally. Distribution of known volcanoes
Free with trial Philippine Sea tectonic plate on the Wiki style elevation map in the Patterson Cylindrical projection centered meridionally. Locations of earthquakes above 6. 5 magnitude recorded since the early 17th century. Plate boundary illustrations Philippine Sea tectonic plate. Wiki. Patterson Cylindrical. Eart. Philippine Sea tectonic plate on the Wiki style elevation map in the Patterson Cylindrical projection centered meridionally. Locations of earthquakes above 6.5 magnitude recorded since the early 17th century
Free with trial Somalian tectonic plate on the Blue Marble satellite map in the Patterson Cylindrical projection centered meridionally. Locations of earthquakes above 6. 5 magnitude recorded since the early 17th century. Plate boundary illustrations Somalian tectonic plate. Satellite. Patterson Cylindrical. Earth. Somalian tectonic plate on the Blue Marble satellite map in the Patterson Cylindrical projection centered meridionally. Locations of earthquakes above 6.5 magnitude recorded since the early 17th century
Free with trial Amur tectonic plate on the solid contour map in the Patterson Cylindrical Oblique projection centered meridionally and latitudinally. Locations of earthquakes above 6. 5 magnitude recorded since the early 17th century. Plate boundary illustrations Amur tectonic plate. Contour. Patterson Cylindrical Oblique. Ear. Amur tectonic plate on the solid contour map in the Patterson Cylindrical Oblique projection centered meridionally and latitudinally. Locations of earthquakes above 6.5 magnitude recorded since the early 17th century
Free with trial Antarctica tectonic plate on the Blue Marble satellite map in the Patterson Cylindrical projection centered meridionally. Distribution of known volcanoes. Plate boundary illustrations Antarctica tectonic plate. Satellite. Patterson Cylindrical. Vol. Antarctica tectonic plate on the Blue Marble satellite map in the Patterson Cylindrical projection centered meridionally. Distribution of known volcanoes
Free with trial Okhotsk tectonic plate on the solid contour map in the Patterson Cylindrical projection centered meridionally. Distribution of known volcanoes. Plate boundary illustrations Okhotsk tectonic plate. Contour. Patterson Cylindrical. Volcanoe. Okhotsk tectonic plate on the solid contour map in the Patterson Cylindrical projection centered meridionally. Distribution of known volcanoes
Free with trial African tectonic plate on the bilevel elevation map in the Patterson Cylindrical projection centered meridionally. Locations of earthquakes above 6. 5 magnitude recorded since the early 17th century. Plate boundary illustrations African tectonic plate. Bilevel. Patterson Cylindrical. Earthqua. African tectonic plate on the bilevel elevation map in the Patterson Cylindrical projection centered meridionally. Locations of earthquakes above 6.5 magnitude recorded since the early 17th century
Free with trial Philippine Sea tectonic plate on the solid contour map in the Patterson Cylindrical projection centered meridionally. Locations of earthquakes above 6. 5 magnitude recorded since the early 17th century. Plate boundary illustrations Philippine Sea tectonic plate. Contour. Patterson Cylindrical. E. Philippine Sea tectonic plate on the solid contour map in the Patterson Cylindrical projection centered meridionally. Locations of earthquakes above 6.5 magnitude recorded since the early 17th century
Free with trial Somalian tectonic plate on the bilevel elevation map in the Patterson Cylindrical projection centered meridionally. Boundaries of other plates. Plate boundary illustrations Somalian tectonic plate. Bilevel. Patterson Cylindrical. Boundar. Somalian tectonic plate on the bilevel elevation map in the Patterson Cylindrical projection centered meridionally. Boundaries of other plates
Free with trial Sunda tectonic plate on the bilevel elevation map in the Patterson Cylindrical Oblique projection centered meridionally and latitudinally. Locations of earthquakes above 6. 5 magnitude recorded since the early 17th century. Plate boundary illustrations Sunda tectonic plate. Bilevel. Patterson Cylindrical Oblique. Ea. Sunda tectonic plate on the bilevel elevation map in the Patterson Cylindrical Oblique projection centered meridionally and latitudinally. Locations of earthquakes above 6.5 magnitude recorded since the early 17th century
Free with trial Arabian tectonic plate on the physical elevation map in the Patterson Cylindrical projection centered meridionally. Distribution of known volcanoes. Plate boundary illustrations Arabian tectonic plate. Physical. Patterson Cylindrical. Volcano. Arabian tectonic plate on the physical elevation map in the Patterson Cylindrical projection centered meridionally. Distribution of known volcanoes
Free with trial Somalian tectonic plate on the grayscale elevation map in the Patterson Cylindrical projection centered meridionally. Boundaries of other plates. Plate boundary illustrations Somalian tectonic plate. Grayscale. Patterson Cylindrical. Bound. Somalian tectonic plate on the grayscale elevation map in the Patterson Cylindrical projection centered meridionally. Boundaries of other plates
Free with trial Tectonic plate boundaries on the world grayscale elevation map in the Times projection centered on the prime meridian. Plate boundary illustrations Tectonic plate boundaries on the world grayscale map - 0 PM. Tim. Tectonic plate boundaries on the world grayscale elevation map in the Times projection centered on the prime meridian
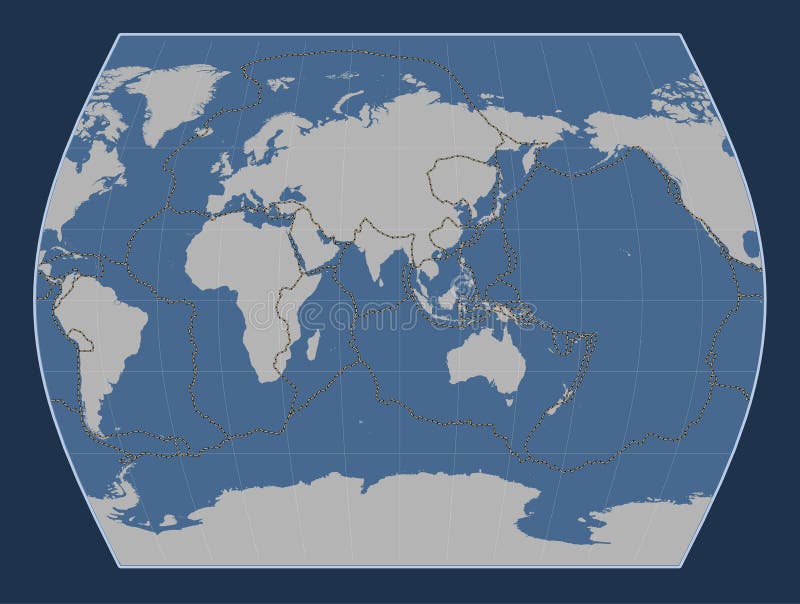
Free with trial Tectonic plate boundaries on the world solid contour map in the Times projection centered on the 90th meridian east longitude. Plate boundary illustrations Tectonic plate boundaries on the world contour map - 90 PM. Time. Tectonic plate boundaries on the world solid contour map in the Times projection centered on the 90th meridian east longitude
Free with trial Australian tectonic plate on the bilevel elevation map in the Patterson Cylindrical projection centered meridionally. Boundaries of other plates. Plate boundary illustrations Australian tectonic plate. Bilevel. Patterson Cylindrical. Bound. Australian tectonic plate on the bilevel elevation map in the Patterson Cylindrical projection centered meridionally. Boundaries of other plates
Free with trial Australian tectonic plate on the physical elevation map in the Patterson Cylindrical projection centered meridionally. Distribution of known volcanoes. Plate boundary illustrations Australian tectonic plate. Physical. Patterson Cylindrical. Volc. Australian tectonic plate on the physical elevation map in the Patterson Cylindrical projection centered meridionally. Distribution of known volcanoes
Free with trial Nazca tectonic plate on the grayscale elevation map in the Patterson Cylindrical projection centered meridionally. Boundaries of other plates. Plate boundary illustrations Nazca tectonic plate. Grayscale. Patterson Cylindrical. Boundari. Nazca tectonic plate on the grayscale elevation map in the Patterson Cylindrical projection centered meridionally. Boundaries of other plates
Free with trial Okhotsk tectonic plate on the Blue Marble satellite map in the Patterson Cylindrical projection centered meridionally. Boundaries of other plates. Plate boundary illustrations Okhotsk tectonic plate. Satellite. Patterson Cylindrical. Bounda. Okhotsk tectonic plate on the Blue Marble satellite map in the Patterson Cylindrical projection centered meridionally. Boundaries of other plates
Free with trial Somalian tectonic plate on the Blue Marble satellite map in the Patterson Cylindrical projection centered meridionally. Boundaries of other plates. Plate boundary illustrations Somalian tectonic plate. Satellite. Patterson Cylindrical. Bound. Somalian tectonic plate on the Blue Marble satellite map in the Patterson Cylindrical projection centered meridionally. Boundaries of other plates
Free with trial Somalian tectonic plate on the Wiki style elevation map in the Patterson Cylindrical projection centered meridionally. Locations of earthquakes above 6. 5 magnitude recorded since the early 17th century. Plate boundary illustrations Somalian tectonic plate. Wiki. Patterson Cylindrical. Earthquake. Somalian tectonic plate on the Wiki style elevation map in the Patterson Cylindrical projection centered meridionally. Locations of earthquakes above 6.5 magnitude recorded since the early 17th century
Free with trial African tectonic plate on the Blue Marble satellite map in the Patterson Cylindrical projection centered meridionally. Boundaries of other plates. Plate boundary illustrations African tectonic plate. Satellite. Patterson Cylindrical. Bounda. African tectonic plate on the Blue Marble satellite map in the Patterson Cylindrical projection centered meridionally. Boundaries of other plates
Free with trial Amur tectonic plate on the Wiki style elevation map in the Patterson Cylindrical projection centered meridionally. Locations of earthquakes above 6. 5 magnitude recorded since the early 17th century. Plate boundary illustrations Amur tectonic plate. Wiki. Patterson Cylindrical. Earthquakes an. Amur tectonic plate on the Wiki style elevation map in the Patterson Cylindrical projection centered meridionally. Locations of earthquakes above 6.5 magnitude recorded since the early 17th century
Free with trial Arabian tectonic plate on the solid contour map in the Patterson Cylindrical projection centered meridionally. Distribution of known volcanoes. Plate boundary illustrations Arabian tectonic plate. Contour. Patterson Cylindrical. Volcanoe. Arabian tectonic plate on the solid contour map in the Patterson Cylindrical projection centered meridionally. Distribution of known volcanoes
Free with trial Australian tectonic plate on the Blue Marble satellite map in the Patterson Cylindrical projection centered meridionally. Boundaries of other plates. Plate boundary illustrations Australian tectonic plate. Satellite. Patterson Cylindrical. Bou. Australian tectonic plate on the Blue Marble satellite map in the Patterson Cylindrical projection centered meridionally. Boundaries of other plates
Free with trial Eurasian tectonic plate on the physical elevation map in the Patterson Cylindrical projection centered meridionally. Locations of earthquakes above 6. 5 magnitude recorded since the early 17th century. Plate boundary illustrations Eurasian tectonic plate. Physical. Patterson Cylindrical. Earthq. Eurasian tectonic plate on the physical elevation map in the Patterson Cylindrical projection centered meridionally. Locations of earthquakes above 6.5 magnitude recorded since the early 17th century
Free with trial Indian tectonic plate on the solid contour map in the Patterson Cylindrical Oblique projection centered meridionally and latitudinally. Locations of earthquakes above 6. 5 magnitude recorded since the early 17th century. Plate boundary illustrations Indian tectonic plate. Contour. Patterson Cylindrical Oblique. E. Indian tectonic plate on the solid contour map in the Patterson Cylindrical Oblique projection centered meridionally and latitudinally. Locations of earthquakes above 6.5 magnitude recorded since the early 17th century
Free with trial Somalian tectonic plate on the solid contour map in the Patterson Cylindrical projection centered meridionally. Distribution of known volcanoes. Plate boundary illustrations Somalian tectonic plate. Contour. Patterson Cylindrical. Volcano. Somalian tectonic plate on the solid contour map in the Patterson Cylindrical projection centered meridionally. Distribution of known volcanoes
Free with trial African tectonic plate on the solid contour map in the Patterson Cylindrical projection centered meridionally. Locations of earthquakes above 6. 5 magnitude recorded since the early 17th century. Plate boundary illustrations African tectonic plate. Contour. Patterson Cylindrical. Earthqua. African tectonic plate on the solid contour map in the Patterson Cylindrical projection centered meridionally. Locations of earthquakes above 6.5 magnitude recorded since the early 17th century
Free with trial Pacific tectonic plate on the bilevel elevation map in the Patterson Cylindrical projection centered meridionally. Boundaries of other plates. Plate boundary illustrations Pacific tectonic plate. Bilevel. Patterson Cylindrical. Boundari. Pacific tectonic plate on the bilevel elevation map in the Patterson Cylindrical projection centered meridionally. Boundaries of other plates
Free with trial Philippine Sea tectonic plate on the Wiki style elevation map in the Patterson Cylindrical projection centered meridionally. Boundaries of other plates. Plate boundary illustrations Philippine Sea tectonic plate. Wiki. Patterson Cylindrical. Boun. Philippine Sea tectonic plate on the Wiki style elevation map in the Patterson Cylindrical projection centered meridionally. Boundaries of other plates
Free with trial Somalian tectonic plate on the Wiki style elevation map in the Patterson Cylindrical projection centered meridionally. Boundaries of other plates. Plate boundary illustrations Somalian tectonic plate. Wiki. Patterson Cylindrical. Boundaries. Somalian tectonic plate on the Wiki style elevation map in the Patterson Cylindrical projection centered meridionally. Boundaries of other plates
Free with trial Amur tectonic plate on the bilevel elevation map in the Patterson Cylindrical Oblique projection centered meridionally and latitudinally. Locations of earthquakes above 6. 5 magnitude recorded since the early 17th century. Plate boundary illustrations Amur tectonic plate. Bilevel. Patterson Cylindrical Oblique. Ear. Amur tectonic plate on the bilevel elevation map in the Patterson Cylindrical Oblique projection centered meridionally and latitudinally. Locations of earthquakes above 6.5 magnitude recorded since the early 17th century
Free with trial Amur tectonic plate on the Blue Marble satellite map in the Patterson Cylindrical Oblique projection centered meridionally and latitudinally. Locations of earthquakes above 6. 5 magnitude recorded since the early 17th century. Plate boundary illustrations Amur tectonic plate. Satellite. Patterson Cylindrical Oblique. E. Amur tectonic plate on the Blue Marble satellite map in the Patterson Cylindrical Oblique projection centered meridionally and latitudinally. Locations of earthquakes above 6.5 magnitude recorded since the early 17th century
Free with trial Arabian tectonic plate on the physical elevation map in the Patterson Cylindrical projection centered meridionally. Locations of earthquakes above 6. 5 magnitude recorded since the early 17th century. Plate boundary illustrations Arabian tectonic plate. Physical. Patterson Cylindrical. Earthqu. Arabian tectonic plate on the physical elevation map in the Patterson Cylindrical projection centered meridionally. Locations of earthquakes above 6.5 magnitude recorded since the early 17th century
Free with trial Australian tectonic plate on the solid contour map in the Patterson Cylindrical projection centered meridionally. Locations of earthquakes above 6. 5 magnitude recorded since the early 17th century. Plate boundary illustrations Australian tectonic plate. Contour. Patterson Cylindrical. Earth. Australian tectonic plate on the solid contour map in the Patterson Cylindrical projection centered meridionally. Locations of earthquakes above 6.5 magnitude recorded since the early 17th century
Free with trial Okhotsk tectonic plate on the physical elevation map in the Patterson Cylindrical projection centered meridionally. Locations of earthquakes above 6. 5 magnitude recorded since the early 17th century. Plate boundary illustrations Okhotsk tectonic plate. Physical. Patterson Cylindrical. Earthqu. Okhotsk tectonic plate on the physical elevation map in the Patterson Cylindrical projection centered meridionally. Locations of earthquakes above 6.5 magnitude recorded since the early 17th century
Free with trial South American tectonic plate on the bilevel elevation map in the Patterson Cylindrical projection centered meridionally. Locations of earthquakes above 6. 5 magnitude recorded since the early 17th century. Plate boundary illustrations South American tectonic plate. Bilevel. Patterson Cylindrical. E. South American tectonic plate on the bilevel elevation map in the Patterson Cylindrical projection centered meridionally. Locations of earthquakes above 6.5 magnitude recorded since the early 17th century
Free with trial Sunda tectonic plate on the bilevel elevation map in the Patterson Cylindrical Oblique projection centered meridionally and latitudinally. Boundaries of other plates. Plate boundary illustrations Sunda tectonic plate. Bilevel. Patterson Cylindrical Oblique. Bo. Sunda tectonic plate on the bilevel elevation map in the Patterson Cylindrical Oblique projection centered meridionally and latitudinally. Boundaries of other plates
Free with trial Sunda tectonic plate on the physical elevation map in the Patterson Cylindrical projection centered meridionally. Locations of earthquakes above 6. 5 magnitude recorded since the early 17th century. Plate boundary illustrations Sunda tectonic plate. Physical. Patterson Cylindrical. Earthquak. Sunda tectonic plate on the physical elevation map in the Patterson Cylindrical projection centered meridionally. Locations of earthquakes above 6.5 magnitude recorded since the early 17th century
Free with trial Indian tectonic plate on the bilevel elevation map in the Patterson Cylindrical projection centered meridionally. Locations of earthquakes above 6. 5 magnitude recorded since the early 17th century. Plate boundary illustrations Indian tectonic plate. Bilevel. Patterson Cylindrical. Earthquak. Indian tectonic plate on the bilevel elevation map in the Patterson Cylindrical projection centered meridionally. Locations of earthquakes above 6.5 magnitude recorded since the early 17th century
Free with trial Amur tectonic plate on the bilevel elevation map in the Patterson Cylindrical projection centered meridionally. Locations of earthquakes above 6. 5 magnitude recorded since the early 17th century. Plate boundary illustrations Amur tectonic plate. Bilevel. Patterson Cylindrical. Earthquakes. Amur tectonic plate on the bilevel elevation map in the Patterson Cylindrical projection centered meridionally. Locations of earthquakes above 6.5 magnitude recorded since the early 17th century
Free with trial Arabian tectonic plate on the solid contour map in the Patterson Cylindrical projection centered meridionally. Boundaries of other plates. Plate boundary illustrations Arabian tectonic plate. Contour. Patterson Cylindrical. Boundari. Arabian tectonic plate on the solid contour map in the Patterson Cylindrical projection centered meridionally. Boundaries of other plates
Free with trial Nazca tectonic plate on the physical elevation map in the Patterson Cylindrical projection centered meridionally. Locations of earthquakes above 6. 5 magnitude recorded since the early 17th century. Plate boundary illustrations Nazca tectonic plate. Physical. Patterson Cylindrical. Earthquak. Nazca tectonic plate on the physical elevation map in the Patterson Cylindrical projection centered meridionally. Locations of earthquakes above 6.5 magnitude recorded since the early 17th century
Free with trial Nazca tectonic plate on the solid contour map in the Patterson Cylindrical projection centered meridionally. Boundaries of other plates. Plate boundary illustrations Nazca tectonic plate. Contour. Patterson Cylindrical. Boundaries. Nazca tectonic plate on the solid contour map in the Patterson Cylindrical projection centered meridionally. Boundaries of other plates
Free with trial Pacific tectonic plate on the physical elevation map in the Patterson Cylindrical projection centered meridionally. Distribution of known volcanoes. Plate boundary illustrations Pacific tectonic plate. Physical. Patterson Cylindrical. Volcano. Pacific tectonic plate on the physical elevation map in the Patterson Cylindrical projection centered meridionally. Distribution of known volcanoes
Free with trial Sunda tectonic plate on the physical elevation map in the Patterson Cylindrical projection centered meridionally. Distribution of known volcanoes. Plate boundary illustrations Sunda tectonic plate. Physical. Patterson Cylindrical. Volcanoes. Sunda tectonic plate on the physical elevation map in the Patterson Cylindrical projection centered meridionally. Distribution of known volcanoes
Free with trial Nazca tectonic plate on the physical elevation map in the Patterson Cylindrical projection centered meridionally. Boundaries of other plates. Plate boundary illustrations Nazca tectonic plate. Physical. Patterson Cylindrical. Boundarie. Nazca tectonic plate on the physical elevation map in the Patterson Cylindrical projection centered meridionally. Boundaries of other plates
Free with trial Pacific tectonic plate on the Blue Marble satellite map in the Patterson Cylindrical projection centered meridionally. Boundaries of other plates. Plate boundary illustrations Pacific tectonic plate. Satellite. Patterson Cylindrical. Bounda. Pacific tectonic plate on the Blue Marble satellite map in the Patterson Cylindrical projection centered meridionally. Boundaries of other plates
Free with trial Sunda tectonic plate on the grayscale elevation map in the Patterson Cylindrical projection centered meridionally. Boundaries of other plates. Plate boundary illustrations Sunda tectonic plate. Grayscale. Patterson Cylindrical. Boundari. Sunda tectonic plate on the grayscale elevation map in the Patterson Cylindrical projection centered meridionally. Boundaries of other plates
Free with trial Amur tectonic plate on the grayscale elevation map in the Patterson Cylindrical projection centered meridionally. Locations of earthquakes above 6. 5 magnitude recorded since the early 17th century. Plate boundary illustrations Amur tectonic plate. Grayscale. Patterson Cylindrical. Earthquak. Amur tectonic plate on the grayscale elevation map in the Patterson Cylindrical projection centered meridionally. Locations of earthquakes above 6.5 magnitude recorded since the early 17th century
Free with trial Antarctica tectonic plate on the physical elevation map in the Patterson Cylindrical projection centered meridionally. Distribution of known volcanoes. Plate boundary illustrations Antarctica tectonic plate. Physical. Patterson Cylindrical. Volc. Antarctica tectonic plate on the physical elevation map in the Patterson Cylindrical projection centered meridionally. Distribution of known volcanoes
Free with trial Arabian tectonic plate on the bilevel elevation map in the Patterson Cylindrical projection centered meridionally. Locations of earthquakes above 6. 5 magnitude recorded since the early 17th century. Plate boundary illustrations Arabian tectonic plate. Bilevel. Patterson Cylindrical. Earthqua. Arabian tectonic plate on the bilevel elevation map in the Patterson Cylindrical projection centered meridionally. Locations of earthquakes above 6.5 magnitude recorded since the early 17th century
Free with trial Arabian tectonic plate on the Wiki style elevation map in the Patterson Cylindrical projection centered meridionally. Locations of earthquakes above 6. 5 magnitude recorded since the early 17th century. Plate boundary illustrations Arabian tectonic plate. Wiki. Patterson Cylindrical. Earthquakes. Arabian tectonic plate on the Wiki style elevation map in the Patterson Cylindrical projection centered meridionally. Locations of earthquakes above 6.5 magnitude recorded since the early 17th century
Free with trial Indian tectonic plate on the Blue Marble satellite map in the Patterson Cylindrical projection centered meridionally. Distribution of known volcanoes. Plate boundary illustrations Indian tectonic plate. Satellite. Patterson Cylindrical. Volcano. Indian tectonic plate on the Blue Marble satellite map in the Patterson Cylindrical projection centered meridionally. Distribution of known volcanoes
Free with trial Nazca tectonic plate on the solid contour map in the Patterson Cylindrical Oblique projection centered meridionally and latitudinally. Boundaries of other plates. Plate boundary illustrations Nazca tectonic plate. Contour. Patterson Cylindrical Oblique. Bo. Nazca tectonic plate on the solid contour map in the Patterson Cylindrical Oblique projection centered meridionally and latitudinally. Boundaries of other plates
Free with trial Okhotsk tectonic plate on the bilevel elevation map in the Patterson Cylindrical projection centered meridionally. Boundaries of other plates. Plate boundary illustrations Okhotsk tectonic plate. Bilevel. Patterson Cylindrical. Boundari. Okhotsk tectonic plate on the bilevel elevation map in the Patterson Cylindrical projection centered meridionally. Boundaries of other plates
Free with trial Okhotsk tectonic plate on the physical elevation map in the Patterson Cylindrical projection centered meridionally. Distribution of known volcanoes. Plate boundary illustrations Okhotsk tectonic plate. Physical. Patterson Cylindrical. Volcano. Okhotsk tectonic plate on the physical elevation map in the Patterson Cylindrical projection centered meridionally. Distribution of known volcanoes
Free with trial Somalian tectonic plate on the Blue Marble satellite map in the Patterson Cylindrical projection centered meridionally. Distribution of known volcanoes. Plate boundary illustrations Somalian tectonic plate. Satellite. Patterson Cylindrical. Volca. Somalian tectonic plate on the Blue Marble satellite map in the Patterson Cylindrical projection centered meridionally. Distribution of known volcanoes
Free with trial Sunda tectonic plate on the solid contour map in the Patterson Cylindrical Oblique projection centered meridionally and latitudinally. Locations of earthquakes above 6. 5 magnitude recorded since the early 17th century. Plate boundary illustrations Sunda tectonic plate. Contour. Patterson Cylindrical Oblique. Ea. Sunda tectonic plate on the solid contour map in the Patterson Cylindrical Oblique projection centered meridionally and latitudinally. Locations of earthquakes above 6.5 magnitude recorded since the early 17th century
Free with trial Australian tectonic plate on the bilevel elevation map in the Patterson Cylindrical projection centered meridionally. Locations of earthquakes above 6. 5 magnitude recorded since the early 17th century. Plate boundary illustrations Australian tectonic plate. Bilevel. Patterson Cylindrical. Earth. Australian tectonic plate on the bilevel elevation map in the Patterson Cylindrical projection centered meridionally. Locations of earthquakes above 6.5 magnitude recorded since the early 17th century