Free with trial A clean, minimalist flat design vector illustration featuring two opposite arrows, one pointing up and the other down, symbolizing change and balance. Progress decrease vectors Up and down arrows indicating data flow. A clean, minimalist flat design vector illustration featuring two opposite arrows, one pointing up and the other down, symbolizing change and balance
Free with trial Abstract green line graph on black background. Stock photo of financial chart. Progress decrease illustrations Vibrant Green Lightning Bolt on Black Background, Electric Energy Discharge. Abstract green line graph on black background. Stock photo of financial chart
Free with trial A clean and simple seamless pattern featuring an array of black arrows uniformly pointing downwards on a crisp white background, ideal for various design projects. Progress decrease illustrations Seamless pattern of black downward arrows on white background. A clean and simple seamless pattern featuring an array of black arrows uniformly pointing downwards on a crisp white background, ideal for various design projects.
Free with trial Bull vs bear stock market sentiment concept background vector. Progress decrease vectors Bull vs bear stock market sentiment concept background
Free with trial Vibrant vector illustration featuring business data charts and graphs, including bar graphs, line graphs, pie charts, and a roller coaster metaphor for market trends. This eye-catching design is perfect for presentations, infographics, and financial reports. Progress decrease illustrations Business Data Charts Graphs Vector Illustration, Statistics. Vibrant vector illustration featuring business data charts and graphs, including bar graphs, line graphs, pie charts, and a roller coaster metaphor for market trends. This eye-catching design is perfect for presentations, infographics, and financial reports.
Free with trial A clean graphic illustration featuring two circular icons with contrasting arrows: one pointing up, the other down. Ideal for representing growth, decline, or choices in flat design. Progress decrease vectors Circular icons for up and down direction. A clean graphic illustration featuring two circular icons with contrasting arrows: one pointing up, the other down. Ideal for representing growth, decline, or choices in flat design
Free with trial A gold bar graph with an arrow pointing down at the end. Progress decrease illustrations A gold bar graph with an arrow
Free with trial A bold red arrow pointing downward right, isolated as a transparent background design element. Progress decrease vectors Bright Red Downward Arrow Icon Illustration. A bold red arrow pointing downward right, isolated as a transparent background design element.
Free with trial A clean and modern vector illustration featuring graphic symbols for business growth and decline. This EPS file shows an upward-trending green arrow for success and a downward-trending red arrow for loss, both depicted on a stylized financial chart. Ideal for corporate presentations, financial reports, economic analysis, and stock market metaphors. Progress decrease vectors Growth And Decline Chart Graphic Symbol. A clean and modern vector illustration featuring graphic symbols for business growth and decline. This EPS file shows an upward-trending green arrow for success and a downward-trending red arrow for loss, both depicted on a stylized financial chart. Ideal for corporate presentations, financial reports, economic analysis, and stock market metaphors.
Free with trial Downward arrow, clock face, and cloud symbolizing time tracking, efficiency, focus, digital minimalism, productivity, data flow, and workflow optimization as a simple flat metaphor. Progress decrease illustrations Downward Arrow, Clock, and Cloud Representing Time Management and Efficiency. Downward arrow, clock face, and cloud symbolizing time tracking, efficiency, focus, digital minimalism, productivity, data flow, and workflow optimization as a simple flat metaphor
Free with trial Black silhouette arrows illustrate financial growth and decline against a white background, perfect for business concepts. Flat design graphic. Progress decrease vectors Multiple upward and downward trend arrows. Black silhouette arrows illustrate financial growth and decline against a white background, perfect for business concepts. Flat design graphic
Free with trial Vector arrow featuring green up arrow and red down arrow with text vector. Scalable design suitable for various applications. Scalable vector format suitable for print and digital media. Progress decrease illustrations Green Up Arrow and Red Down Arrow with Text vector
Free with trial Bull growth vs bear decline stock trade concept background vector. Progress decrease vectors Bull growth vs bear decline stock trade concept background
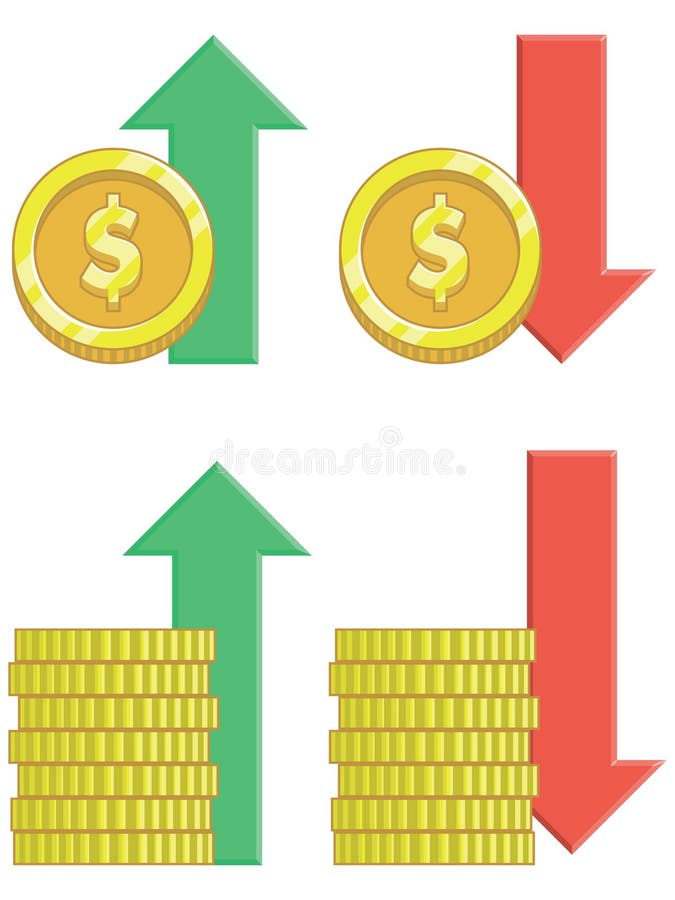
Free with trial An illustration set of Coin with up and down Arrows as a symbol for Value Changes. Progress decrease vectors Coin Arrows Up Down Value Changes. An illustration set of Coin with up and down Arrows as a symbol for Value Changes.
Free with trial Four stylized arrows on a white background, two green and two red. The green arrows curve upwards with a smooth, sweeping motion. The red arrows feature a zigzag pattern before pointing upwards. Positioned in a circular arrangement, alternating colors suggest dynamics of growth and decline, often used in business or financial contexts. The minimalistic style is suitable for illustrating trends or cycles. Progress decrease vectors Up and Down Arrow Icons Set for Growth and Decline. Four stylized arrows on a white background, two green and two red. The green arrows curve upwards with a smooth, sweeping motion. The red arrows feature a zigzag pattern before pointing upwards. Positioned in a circular arrangement, alternating colors suggest dynamics of growth and decline, often used in business or financial contexts. The minimalistic style is suitable for illustrating trends or cycles.
Free with trial A clean flat design vector illustration featuring opposing arrows symbolizing growth and decline, perfect for financial or business concepts. Progress decrease vectors Black zigzag arrows indicating market trends. A clean flat design vector illustration featuring opposing arrows symbolizing growth and decline, perfect for financial or business concepts
Free with trial Icon set depicting financial growth and decline with upward and downward arrows over bar charts, perfect for business analytics and presentations. Progress decrease vectors Bar charts with curved arrows showing trends. Icon set depicting financial growth and decline with upward and downward arrows over bar charts, perfect for business analytics and presentations
Free with trial Wavy green arrows visualizing market movement, trend fluctuation, and economic volatility, depicting both growth and decline, ideal for financial data and business analytics concepts. Progress decrease illustrations Wavy arrows showing up and down fluctuation trend. Wavy green arrows visualizing market movement, trend fluctuation, and economic volatility, depicting both growth and decline, ideal for financial data and business analytics concepts
Free with trial Percentage symbol inside a circular arrow illustrating financial performance, interest rates, tax calculations, market fluctuations, or economic cycles in a modern sketch style illustration. Progress decrease illustrations Percentage symbol revolving looping business icon. Percentage symbol inside a circular arrow illustrating financial performance, interest rates, tax calculations, market fluctuations, or economic cycles in a modern sketch style illustration
Free with trial Abstract design creating a falling arrow symbol surrounded by fluid, wavy lines, illustrating motion, flow, and downward direction in a minimalist style. Progress decrease illustrations Falling direction concept with flowing wavy lines. Abstract design creating a falling arrow symbol surrounded by fluid, wavy lines, illustrating motion, flow, and downward direction in a minimalist style
Free with trial A professional collection of 16 business and financial icons featuring various bar charts and line graphs. Perfect for UI dashboards, corporate presentations, and data-heavy infographics showing market growth or decline. Progress decrease vectors Business Growth Bar Charts and Financial Trend Line Graph Vector Icons Set. A professional collection of 16 business and financial icons featuring various bar charts and line graphs. Perfect for UI dashboards, corporate presentations, and data-heavy infographics showing market growth or decline.
Free with trial A professional collection of 16 business and financial icons featuring various bar charts and line graphs. Perfect for UI dashboards, corporate presentations, and data-heavy infographics showing market growth or decline. Progress decrease vectors Business Growth Bar Charts and Financial Trend Line Graph Vector Icons Set. A professional collection of 16 business and financial icons featuring various bar charts and line graphs. Perfect for UI dashboards, corporate presentations, and data-heavy infographics showing market growth or decline.
Free with trial Bar chart icon showing three declining bars within a circular interface, symbolizing decreasing data, analytical trends, and financial performance concepts. Progress decrease vectors Decreasing bar chart data analysis statistics icon. Bar chart icon showing three declining bars within a circular interface, symbolizing decreasing data, analytical trends, and financial performance concepts
Free with trial A businessman in a suit holds a glowing digital interface showing a growth bar chart and the words COST Focusing, representing financial strategy and cost management analysis. Progress decrease illustrations A businessman in a suit holds a glowing digital interface showing a growth bar chart and the words COST Focusing, representing
Free with trial A simple flat design graphic illustrates stock market growth and decline using green upward and red downward arrows with bar charts. Ideal for finance and business concepts. Progress decrease vectors Bar chart showing financial growth and decline. A simple flat design graphic illustrates stock market growth and decline using green upward and red downward arrows with bar charts. Ideal for finance and business concepts
Free with trial Black arrows illustrating an upward and downward zigzag fluctuation, symbolizing a dynamic process of movement, change, and varying trends on a clean white background. Progress decrease vectors Fluctuation movement with up and down zigzag arrows. Black arrows illustrating an upward and downward zigzag fluctuation, symbolizing a dynamic process of movement, change, and varying trends on a clean white background
Free with trial Abstract financial data display showing fluctuating market trends. Progress decrease illustrations Glowing Financial Stock Market Data Analysis Chart. Abstract financial data display showing fluctuating market trends
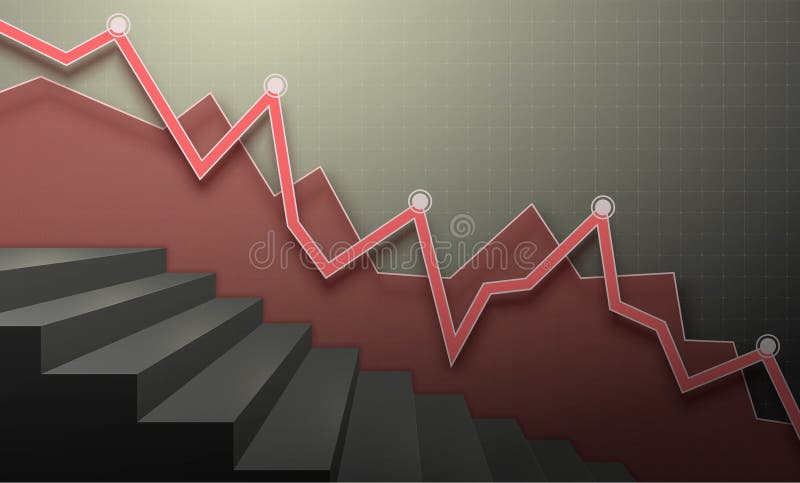
Free with trial Red financial chart with descending lines and a ladder. Vector 3D illustration. Progress decrease vectors Red financial chart with descending lines and a ladder. Vector 3D
Free with trial Bullish profit vs bearish loss stock market price chart design vector. Progress decrease vectors Bullish profit vs bearish loss stock market price chart design
Free with trial Sad face beside a chart showing a downward curve, circular target design, and finger tap icon. Ideal for business losses, failure, feedback, analytics, disappointment usability data trends. Simple. Progress decrease vectors Declining Trend Displayed with Sad Face, Downward Graph Line, and Finger Tap Icon. Sad face beside a chart showing a downward curve, circular target design, and finger tap icon. Ideal for business losses, failure, feedback, analytics, disappointment usability data trends. Simple
Free with trial Red and green arrows with percent sign Sale concept 3D rendering illustration isolated on white background. Progress decrease illustrations Red and green arrows with percent sign Sale concept 3D
Free with trial A flat illustration of business graphs and charts showing analysis results. Featuring clean design and vibrant color scheme. Progress decrease vectors Colorful business graph and chart flat style design. A flat illustration of business graphs and charts showing analysis results. Featuring clean design and vibrant color scheme.
Free with trial A contrasting vector graphic set showing rising green bars with an upward arrow and falling red bars with a downward arrow, representing financial growth and decline. Progress decrease vectors Business bar charts indicating growth and decline. A contrasting vector graphic set showing rising green bars with an upward arrow and falling red bars with a downward arrow, representing financial growth and decline
Free with trial A clean flat design graphic illustrating contrasting upward growth arrows and downward decline arrows, perfect for financial or performance concepts. Progress decrease vectors Stacked arrows indicating business growth decline. A clean flat design graphic illustrating contrasting upward growth arrows and downward decline arrows, perfect for financial or performance concepts
Free with trial Line graph illustrating data analysis and business statistics, charting financial growth, market changes, and performance metrics for visual information and infographic content. Progress decrease illustrations Analyzing data with line graph showing business trends. Line graph illustrating data analysis and business statistics, charting financial growth, market changes, and performance metrics for visual information and infographic content
Free with trial Simple black icons representing financial growth and decline, perfect for business analytics and reporting. This scalable vector graphic is versatile for web and print. Progress decrease vectors Bar charts with arrows indicating growth or decline. Simple black icons representing financial growth and decline, perfect for business analytics and reporting. This scalable vector graphic is versatile for web and print
Free with trial Abstract bull and bear market graph. Progress decrease illustrations Bull and Bear Neon Silhouettes on Stock Market Data Chart Background. Abstract bull and bear market graph
Free with trial Flat design vector illustration of a green arrow pointing up with a percent sign and a red arrow pointing down with a percent sign, representing growth and decline. Progress decrease vectors Statistical change with up and down percentage icons. Flat design vector illustration of a green arrow pointing up with a percent sign and a red arrow pointing down with a percent sign, representing growth and decline
Free with trial Financial bar chart with green up and red down arrow. Economic growth and decline symbol vector. Progress decrease vectors Financial bar chart with green up and red down arrow. Economic growth and decline symbol
Free with trial This cartoon illustration features two distinct arrow characters against a white background. The red arrow, pointing upwards, displays a distressed facial expression with sweat droplets, conveying a sense of struggle or decline. In contrast, the green arrow, pointing downwards, has a serene, smiling face, suggesting ease or positive movement in a downward direction. This visual metaphor can represent contrasting trends, emotions, or outcomes. Progress decrease vectors Sad Up Arrow and Happy Down Arrow Cartoon Characters. This cartoon illustration features two distinct arrow characters against a white background. The red arrow, pointing upwards, displays a distressed facial expression with sweat droplets, conveying a sense of struggle or decline. In contrast, the green arrow, pointing downwards, has a serene, smiling face, suggesting ease or positive movement in a downward direction. This visual metaphor can represent contrasting trends, emotions, or outcomes.
Free with trial 3D graph going up and down with red arrows, blue bar chart icon vector, sales chart with 3D arrow down and arrow up, financial analytics symbol, EPS 10. Progress decrease vectors 3D graph going up and down with red arrows, blue bar chart icon vector, sales chart symbol. 3D graph going up and down with red arrows, blue bar chart icon vector, sales chart with 3D arrow down and arrow up, financial analytics symbol, EPS 10
Free with trial Abstract financial data visualization graphic. Progress decrease illustrations Blue Digital Data Visualization Abstract Background with Bars and Lines. Abstract financial data visualization graphic
Free with trial Downward arrow, bar chart in browser window, abstract leaf shape. Ideal for business, analytics, environment, economy, growth planning strategy concepts. Simple flat metaphor. Progress decrease vectors Data Chart with Downward Arrow and Leaf Element for Trend Analysis and Growth Concept. Downward arrow, bar chart in browser window, abstract leaf shape. Ideal for business, analytics, environment, economy, growth planning strategy concepts. Simple flat metaphor
Free with trial The image depicts a bar graph with a downward trend. The bars start at a higher value and progressively decrease, indicating a decline. An arrow at the end of the graph further emphasizes the downward direction. Progress decrease illustrations Decreasing bar graph. The image depicts a bar graph with a downward trend. The bars start at a higher value and progressively decrease, indicating a decline. An arrow at the end of the graph further emphasizes the downward direction
Free with trial Flat icon set of solid black, colored, and outlined downward arrows, vector illustration isolated on white background. Progress decrease vectors Set of Downward Arrows in Flat Design Vector Illustration. Flat icon set of solid black, colored, and outlined downward arrows, vector illustration isolated on white background
Free with trial Medicine bottle surrounded by upward and downward arrows with bar chart illustrating statistics and growth. Ideal for health, medicine, pharmaceutical industry, research, statistics, marketing, data. Progress decrease vectors Medicine Bottle with Rising Arrow and Bar Chart Representing Growth and Decline Trends. Medicine bottle surrounded by upward and downward arrows with bar chart illustrating statistics and growth. Ideal for health, medicine, pharmaceutical industry, research, statistics, marketing, data
Free with trial Business trends, financial shifts, growth, decline, recovery, cloud computing. Downward blue arrow and upward symbol towards a cloud. financial shifts and growth concepts. Progress decrease vectors Decrease and Growth Concept with Downward Arrow and Rising Symbol Towards a Cloud. Business trends, financial shifts, growth, decline, recovery, cloud computing. Downward blue arrow and upward symbol towards a cloud. financial shifts and growth concepts
Free with trial Bold red arrow, clean white background. dynamic direction symbol, graphic design element. sleek, modern, simple design. Progress decrease vectors Red arrow pointing down and to the left vector illustration. Bold red arrow, clean white background. dynamic direction symbol, graphic design element. sleek, modern, simple design
Free with trial Flat vector illustration of a colorful bar graph showing a decreasing trend with an arrow on a black backdrop. Progress decrease vectors Decreasing bar graph with downward arrow on black background. Flat vector illustration of a colorful bar graph showing a decreasing trend with an arrow on a black backdrop.
Free with trial Up and down sign with green and red arrows vector illustration, sales bar chart symbol icon with arrow moving down and bar chart with arrow moving up, EPS 10. Progress decrease vectors Up and down sign with green and red arrows vector illustration, sales bar chart symbol icon. Up and down sign with green and red arrows vector illustration, sales bar chart symbol icon with arrow moving down and bar chart with arrow moving up, EPS 10
Free with trial A clean, minimalist vector graphic featuring two solid black arrow icons stacked vertically against a pure white background. The top arrow points upwards, while the bottom arrow points downwards. This simple yet impactful design is ideal for representing concepts like direction, movement, selection, sorting, or comparison in digital interfaces, presentations, and infographics. Progress decrease illustrations Up and Down Arrow Icons. A clean, minimalist vector graphic featuring two solid black arrow icons stacked vertically against a pure white background. The top arrow points upwards, while the bottom arrow points downwards. This simple yet impactful design is ideal for representing concepts like direction, movement, selection, sorting, or comparison in digital interfaces, presentations, and infographics.
Free with trial A flat style graph depicting a downward trend with declining bars and arrow. Strong use of contrasting colors. Progress decrease vectors Declining bar graph showing negative trend with falling arrow. A flat style graph depicting a downward trend with declining bars and arrow. Strong use of contrasting colors.
Free with trial Colorful pie chart is showing positive statistics and business growth, target and financial analysis and marketing report, data with copy space. Progress decrease vectors Colorful pie chart is showing positive statistics and business growth, target and financial analysis and marketing
Free with trial Flat vector illustration of a user icon with downward arrows symbolizing download or data transfer process in turquoise and blue. Progress decrease vectors User Icon with Downward Arrows Indicating Download or Transfer. Flat vector illustration of a user icon with downward arrows symbolizing download or data transfer process in turquoise and blue.
Free with trial Flat style illustration showcasing business financial data analysis via a magnifying glass and graph chart visualization, isolated on black. Progress decrease vectors Analyzing Financial Data with Magnifying Glass and Graph Chart. Flat style illustration showcasing business financial data analysis via a magnifying glass and graph chart visualization, isolated on black.
Free with trial An abstract visual representation of data, featuring a vibrant red bar chart resembling a cityscape or sound wave, overlaid with a line graph and connecting dots. This dynamic graphic is ideal for concepts related to financial analysis, business intelligence, or data visualization. Progress decrease illustrations Red Abstract Bar Chart Waveform with Connecting Dots and Lines - Data Analysis. An abstract visual representation of data, featuring a vibrant red bar chart resembling a cityscape or sound wave, overlaid with a line graph and connecting dots. This dynamic graphic is ideal for concepts related to financial analysis, business intelligence, or data visualization.
Free with trial Data trends. Data with arrows indicating increase and decrease, growth chart, and audio waveform. Data trends highlight growth, performance tracking, and communication analysis. Suitable. Progress decrease illustrations Data Trends and Analysis with Arrows, Graph, and Audio Waveform Communication Metrics. Data trends. Data with arrows indicating increase and decrease, growth chart, and audio waveform. Data trends highlight growth, performance tracking, and communication analysis. Suitable
Free with trial Modern data decline visualization icons with colorful gradient. Set of icons representing data decline and financial loss business charts graphs arrows isolated. Progress decrease vectors Modern data decline visualization icons with colorful gradient. Set of icons representing data decline and financial loss business charts graphs arrows isolated
Free with trial A bright, shiny red arrow points directly downwards. The arrow has a three-dimensional appearance with highlights and shadows, giving it a glossy finish. It is presented in isolation against a stark white background. Progress decrease illustrations Shiny Red Downward Pointing Arrow on White Background direction. A bright, shiny red arrow points directly downwards. The arrow has a three-dimensional appearance with highlights and shadows, giving it a glossy finish. It is presented in isolation against a stark white background
Free with trial Bar graph with an upward trend, blue downward arrow, and percentage sign. Ideal for business analysis, finance, growth, decline trends, statistics economics comparison. Flat simple metaphor. Progress decrease vectors Financial chart with growth trend, declining arrow, and percentage symbol representing data analysis. Bar graph with an upward trend, blue downward arrow, and percentage sign. Ideal for business analysis, finance, growth, decline trends, statistics economics comparison. Flat simple metaphor
Free with trial A logo for a data visualization service, a simple chart bar forming a sharp, singular peak, vector graphic design on a white background, simple minimalistic style, flat color, sunflower yellow color palette, vector graphics, vector illustration, logo, professional logo, logo design, high-quality graphic designer work, logo icon --chaos 30 --ar 16:9 --v 7 Job ID: a54fbe77-4416-47fc-b767-. Progress decrease illustrations Yellow Waveform Graph on White Background, Representing Data, Analytics, or Sound. a logo for a data visualization service, a simple chart bar forming a sharp, singular peak, vector graphic design on a white background, simple minimalistic style, flat color, sunflower yellow color palette, vector graphics, vector illustration, logo, professional logo, logo design, high-quality graphic designer work, logo icon --chaos 30 --ar 16:9 --v 7 Job ID: a54fbe77-4416-47fc-b767-
Free with trial Chart illustrating performance trends with emotive faces, team photos, analytic symbols thumbs up an atom and checkmark. Ideal for teamwork, strategy, data, feedback, process, analysis charts. Progress decrease vectors Business Performance Trends Featuring Emotional Reactions Across Team Members and Analytics. Chart illustrating performance trends with emotive faces, team photos, analytic symbols thumbs up an atom and checkmark. Ideal for teamwork, strategy, data, feedback, process, analysis charts
Free with trial Up and down arrows, bar graph, and fingerprint emphasize data analysis, growth, security, identity, biometrics, trends and technology. Ideal for business analytics privacy security technology. Progress decrease illustrations Arrows Indicating Trends With Bar Graph and Digital Fingerprint for Data and Security Concepts. Up and down arrows, bar graph, and fingerprint emphasize data analysis, growth, security, identity, biometrics, trends and technology. Ideal for business analytics privacy security technology
Free with trial Set of six flat design icons related to time measurement and performance trends isolated on transparent background. Progress decrease vectors Collection of flat design time and performance measurement icons. Set of six flat design icons related to time measurement and performance trends isolated on transparent background
Free with trial Illustration of a growing business intelligence with a dashboard displaying high metrics, a stack of data chips, and a simple magnifying glass. Vector flat icon design on a white background for a data analysis illustration --chaos 30 --ar 16:9 --v 7 Job ID: cfbe4cc3-3bae-455f-ac79-f340192ae4d4. Progress decrease illustrations Data Analysis and Reporting Concept Computer Screen with Charts and Magnifying Glass. Illustration of a growing business intelligence with a dashboard displaying high metrics, a stack of data chips, and a simple magnifying glass. Vector flat icon design on a white background for a data analysis illustration --chaos 30 --ar 16:9 --v 7 Job ID: cfbe4cc3-3bae-455f-ac79-f340192ae4d4
Free with trial Minimalist black downward arrow symbol on clean white background, ideal for business, marketing, infographics, and directional signage in presentations and web design. Progress decrease illustrations Black curved arrow pointing downwards isolated on white background. Minimalist black downward arrow symbol on clean white background, ideal for business, marketing, infographics, and directional signage in presentations and web design
Free with trial Statistic Bar Chart Outline Sign Data Stats Business Performance Market Analysis Economic Trend Line Icon Presentation Display Board Symbol. Progress decrease vectors Statistic Bar Chart Outline Sign Data Stats Business Performance Market Analysis Economic Trend Line Icon Presentation Display
Free with trial A vertical split image featuring a green upward arrow labeled 'UP' and a red downward arrow labeled 'DOWN. Progress decrease illustrations Green up arrow symbolizing growth and red down arrow representing decline. A vertical split image featuring a green upward arrow labeled 'UP' and a red downward arrow labeled 'DOWN
Free with trial A series of glowing blue arrows curve upwards against a dark background, symbolizing growth and success. The arrows decrease in size from left to right, creating a sense of movement and progress. The largest arrow is at the top, indicating a peak or goal. The blue gradient enhances the sense of dynamism and forward momentum, typical in business and financial contexts. Progress decrease illustrations Abstract Upward Trend Arrow Symbolizing Growth and Success. A series of glowing blue arrows curve upwards against a dark background, symbolizing growth and success. The arrows decrease in size from left to right, creating a sense of movement and progress. The largest arrow is at the top, indicating a peak or goal. The blue gradient enhances the sense of dynamism and forward momentum, typical in business and financial contexts.
Free with trial Minimalist outline drawing of a bar chart representing data analysis and statistical information. Great for presentations and data representations. Progress decrease vectors Simple Outline Bar Chart Sign Statistical Data Analysis Diagram Icon. Minimalist outline drawing of a bar chart representing data analysis and statistical information. Great for presentations and data representations.
Free with trial Pink and blue arrows 3d pointing in opposite directions. Progress decrease illustrations Pink and blue arrows pointing in opposite directions 3d