Free with trial Outline vector graphic depicting a decline in business performance. Progress decrease illustrations Declining Performance Gear, Man, Graph, Arrow. Business Downturn. Outline vector graphic depicting a decline in business performance.
Free with trial A comprehensive collection of hand-drawn business and data visualization icons. This doodle-style set features a variety of essential elements, including different types of arrows, bar graphs, line charts, and pie charts. The sketchy, black and white illustrations are perfect for infographics, presentations, financial reports, and marketing materials. Each icon is isolated on a white background, representing concepts like growth, statistics, process flow, and direction. This versatile vector set is ideal for adding a creative, hand-made touch to any project related to analytics, finance, or strategy. Progress decrease illustrations Hand Drawn Business and Finance Doodle Icon Set. A comprehensive collection of hand-drawn business and data visualization icons. This doodle-style set features a variety of essential elements, including different types of arrows, bar graphs, line charts, and pie charts. The sketchy, black and white illustrations are perfect for infographics, presentations, financial reports, and marketing materials. Each icon is isolated on a white background, representing concepts like growth, statistics, process flow, and direction. This versatile vector set is ideal for adding a creative, hand-made touch to any project related to analytics, finance, or strategy.
Free with trial This vector illustration set features six distinct icons representing key financial and economic concepts. It includes bar charts depicting growth with a green arrow and decline with a red arrow, alongside currency exchange rate indicators for USD, INR, and EUR. Two donut charts visualize data distribution, while a world map colored green and red signifies global market trends or segmentation. Ideal for business presentations, financial reports, economic analysis, and investment-related content, these versatile graphics convey complex data clearly and concisely. Progress decrease vectors Financial Growth, Decline, and Global Market Data Visualization Icons Set. This vector illustration set features six distinct icons representing key financial and economic concepts. It includes bar charts depicting growth with a green arrow and decline with a red arrow, alongside currency exchange rate indicators for USD, INR, and EUR. Two donut charts visualize data distribution, while a world map colored green and red signifies global market trends or segmentation. Ideal for business presentations, financial reports, economic analysis, and investment-related content, these versatile graphics convey complex data clearly and concisely.
Free with trial A 3D rendered graphic depicts a simplified bar chart with pastel colored bars in pink, yellow, and blue. A line graph with white lines and orange and yellow nodes crosses diagonally above the bars. The elements are set against a light blue background with a light tan border, all isolated on a white background. Progress decrease vectors 3 D cartoon bar chart with line graph on blue background data. A 3D rendered graphic depicts a simplified bar chart with pastel colored bars in pink, yellow, and blue. A line graph with white lines and orange and yellow nodes crosses diagonally above the bars. The elements are set against a light blue background with a light tan border, all isolated on a white background
Free with trial This comprehensive vector illustration features a set of 18 flat icons depicting various financial trends, market indicators, and warning signals. The collection includes rising and falling line graphs, bar charts, currency symbols (dollar and euro) indicating fluctuations, and alert symbols like sirens and exclamation marks. Ideal for illustrating concepts of economic growth, decline, market volatility, financial crisis, investment risks, and business performance. Perfect for presentations, reports, websites, and applications related to finance, economics, and stock markets. Progress decrease vectors Financial Trends, Market Indicators and Crisis Alert Icons Set. This comprehensive vector illustration features a set of 18 flat icons depicting various financial trends, market indicators, and warning signals. The collection includes rising and falling line graphs, bar charts, currency symbols (dollar and euro) indicating fluctuations, and alert symbols like sirens and exclamation marks. Ideal for illustrating concepts of economic growth, decline, market volatility, financial crisis, investment risks, and business performance. Perfect for presentations, reports, websites, and applications related to finance, economics, and stock markets.
Free with trial Close-up of neatly stacked coins, arranged in an ascending and descending pattern, symbolizing financial growth, savings, and investment progress. The blurred background features a dynamic financial market chart with glowing lines, representing stock market trends, economic data, or cryptocurrency fluctuations. This image effectively illustrates concepts of wealth management, business success, risk, and the fluctuating nature of the global economy. It's ideal for financial articles, presentations, and advertisements related to banking, investment, budgeting, and economic analysis. Progress decrease illustrations Financial Growth Concept with Stacks of Coins and Stock Market Chart. Close-up of neatly stacked coins, arranged in an ascending and descending pattern, symbolizing financial growth, savings, and investment progress. The blurred background features a dynamic financial market chart with glowing lines, representing stock market trends, economic data, or cryptocurrency fluctuations. This image effectively illustrates concepts of wealth management, business success, risk, and the fluctuating nature of the global economy. It's ideal for financial articles, presentations, and advertisements related to banking, investment, budgeting, and economic analysis.
Free with trial Collection of simple black vector icons representing financial charts, data analysis graphs, and business statistics. Includes trend arrows, magnifier, and settings symbols. Progress decrease vectors Set of black business graph and chart icons for data analysis. Collection of simple black vector icons representing financial charts, data analysis graphs, and business statistics. Includes trend arrows, magnifier, and settings symbols
Free with trial This set of four flat design icons visually represents key concepts related to climate change and sustainable energy. It includes a thermometer with a rising graph indicating global warming, a stylized Earth with continents and oceans, a young plant sprout symbolizing growth and nature, and a wind turbine representing renewable energy. These icons are ideal for illustrating environmental issues, conservation efforts, and the transition to clean power sources in presentations, articles, and educational materials. Progress decrease illustrations Climate Change and Green Energy Icons. This set of four flat design icons visually represents key concepts related to climate change and sustainable energy. It includes a thermometer with a rising graph indicating global warming, a stylized Earth with continents and oceans, a young plant sprout symbolizing growth and nature, and a wind turbine representing renewable energy. These icons are ideal for illustrating environmental issues, conservation efforts, and the transition to clean power sources in presentations, articles, and educational materials.
Free with trial A striking 3D render showcases the numbers '638' in a brushed gold metallic finish. The numbers have a substantial, three-dimensional quality with subtle highlights and shadows that emphasize their form. They are positioned against a soft, out-of-focus background of deep blue and purple hues, creating a sense of depth and sophistication. This image is ideal for representing data, statistics, financial figures, achievements, or any concept related to numerical value and success. Progress decrease illustrations Golden 3D Numbers 638 with Metallic Texture and Soft Bokeh Background. A striking 3D render showcases the numbers '638' in a brushed gold metallic finish. The numbers have a substantial, three-dimensional quality with subtle highlights and shadows that emphasize their form. They are positioned against a soft, out-of-focus background of deep blue and purple hues, creating a sense of depth and sophistication. This image is ideal for representing data, statistics, financial figures, achievements, or any concept related to numerical value and success.
Free with trial This image depicts a combination of line and bar graphs showing comparative data analysis over a period of time. Progress decrease illustrations Comparative data analysis over time with line and bar graphs. This image depicts a combination of line and bar graphs showing comparative data analysis over a period of time
Free with trial Doodle Graph icon. Blue pen hand drawn infographic symbol on a notepaper piece. Line art style graphic design element. Web button with shadow. Decline, save on expences concept. Progress decrease vectors Doodle Graph icon
Free with trial Orange bar chart with downward arrow vector illustration. Financial loss, economic recession, market crash, business failure, negative growth, data analysis. Declining graph with falling trend. Progress decrease vectors Decreasing bar chart with downward arrow showing financial loss and economic recession vector illustration. Orange bar chart with downward arrow vector illustration. Financial loss, economic recession, market crash, business failure, negative growth, data analysis. Declining graph with falling trend
Free with trial This image shows a simple line graph with increasing and decreasing trends, ideal for visualizing data analysis and presenting key findings. The graph uses a clean, minimalist design to highlight the data points and overall trend. Perfect for presentations and reports. Progress decrease illustrations Analyze Your Data. This image shows a simple line graph with increasing and decreasing trends, ideal for visualizing data analysis and presenting key findings. The graph uses a clean, minimalist design to highlight the data points and overall trend. Perfect for presentations and reports.
Free with trial A dollar bill connected to a bar graph resembling a sound wave with an arrow. Clear details and vibrant colors. Progress decrease illustrations Dollar Bill and Sound Wave Bar Graph with Arrow money finance. A dollar bill connected to a bar graph resembling a sound wave with an arrow. Clear details and vibrant colors
Free with trial A circular icon containing a stylized representation of financial data. The icon features a series of black vertical bars of varying heights, suggesting a bar chart. Overlaid on the bars are two thin lines, one black and one grey, depicting line graphs with peaks and troughs, indicating fluctuating trends. The overall design is minimalist and symbolic, suitable for representing business analytics. Progress decrease illustrations Circular Graph Icon with Bar and Line Charts Representing Financial Data and Trends business. A circular icon containing a stylized representation of financial data. The icon features a series of black vertical bars of varying heights, suggesting a bar chart. Overlaid on the bars are two thin lines, one black and one grey, depicting line graphs with peaks and troughs, indicating fluctuating trends. The overall design is minimalist and symbolic, suitable for representing business analytics
Free with trial Bar chart icon representing data visualization, financial growth, business analytics, and market trends, indicating increasing and decreasing values for decision making. Progress decrease vectors Bar chart icon showing data analysis and statistics. Bar chart icon representing data visualization, financial growth, business analytics, and market trends, indicating increasing and decreasing values for decision making
Free with trial Circular maze with a descending bar chart icon, symbolizing the challenge of navigating business data and analytics amid declines, obstacles, and the search for strategic solutions and recovery. Progress decrease illustrations Navigating complex data decline challenges and finding solutions. Circular maze with a descending bar chart icon, symbolizing the challenge of navigating business data and analytics amid declines, obstacles, and the search for strategic solutions and recovery
Free with trial A striking digital illustration features a bold red and white bullseye target with a prominent red percentage symbol at its precise center, set against a stark black background and surrounded by a constellation of smaller white and red percentage signs that radiate outward, creating a modern and minimalist visual metaphor for goals, accuracy, metrics, business growth, and data-driven success. Progress decrease illustrations A digital illustration of a red and white target with a percentage sign in the center, surrounded by smaller percentage symbols on. A striking digital illustration features a bold red and white bullseye target with a prominent red percentage symbol at its precise center, set against a stark black background and surrounded by a constellation of smaller white and red percentage signs that radiate outward, creating a modern and minimalist visual metaphor for goals, accuracy, metrics, business growth, and data-driven success
Free with trial An artistic creation that reflects beauty in simplicity. The design highlights precision, clean details, and a harmonious flow, resulting in a versatile and professional visual outcome. Progress decrease vectors Business lion Presenting bar graph chart. An artistic creation that reflects beauty in simplicity. The design highlights precision, clean details, and a harmonious flow, resulting in a versatile and professional visual outcome
Free with trial A thick, red, zigzagging line, potentially a stock chart, is superimposed over a dark background with glowing green and red data points and lines. Image. Progress decrease illustrations Red Zigzag Line Overlaying Financial Data. A thick, red, zigzagging line, potentially a stock chart, is superimposed over a dark background with glowing green and red data points and lines. Image
Free with trial A versatile set of business and teamwork concept icons and illustrations representing innovation, leadership, planning, communication, and productivity. Ideal for corporate presentations, HR materials, project management visuals, and strategic planning content. Progress decrease vectors Gradient Teamwork Icons Collection. A versatile set of business and teamwork concept icons and illustrations representing innovation, leadership, planning, communication, and productivity. Ideal for corporate presentations, HR materials, project management visuals, and strategic planning content.
Free with trial Eight battery icons showing a gradual charging process from nearly empty to full, using green and light-yellow gradients to represent charge levels. Progress decrease illustrations Eight battery icons showing a gradual charging process from near
Free with trial Blue heart with heartbeat line, upward and downward arrows suggesting change. Ideal for health tracking, fitness, wellness, analytics, growth, decline, and simple landing page. Progress decrease vectors Heartbeat and Arrows Indicating Increase and Decrease in Health and Wellness Indicators. Blue heart with heartbeat line, upward and downward arrows suggesting change. Ideal for health tracking, fitness, wellness, analytics, growth, decline, and simple landing page
Free with trial A bold, glossy red arrow curves downwards, pointing sharply to the left. It signifies a downward trend or direction. Progress decrease illustrations Vibrant red downward curved arrow symbol. A bold, glossy red arrow curves downwards, pointing sharply to the left. It signifies a downward trend or direction
Free with trial A clean, minimalist line art icon representing settings and configuration. The central element is a gear, symbolizing mechanics, operations, or system adjustments. Encircling the gear are three distinct symbols: a plus sign (+) for adding or increasing, a minus sign (-) for subtracting or decreasing, and an information icon (i) for help or details. This graphic is ideal for representing user interface controls, technical configurations, or operational adjustments in digital or mechanical contexts. Progress decrease illustrations Gear Settings Icon with Plus, Minus, and Info Symbols. A clean, minimalist line art icon representing settings and configuration. The central element is a gear, symbolizing mechanics, operations, or system adjustments. Encircling the gear are three distinct symbols: a plus sign (+) for adding or increasing, a minus sign (-) for subtracting or decreasing, and an information icon (i) for help or details. This graphic is ideal for representing user interface controls, technical configurations, or operational adjustments in digital or mechanical contexts.
Free with trial Futuristic Robotic Hand Pointing Towards Computer Display with Cost Analysis Concept and Digital Connections Representing Innovation and Technology Quark. Progress decrease illustrations Futuristic Robotic Hand Pointing Towards Computer Display with Cost Analysis Concept and Digital Connections
Free with trial Arrow Direction and Percentage Icons for Business Growth Concept. Progress decrease illustrations Arrow Direction and Percentage Icons for Business Growth Concept
Free with trial A 3D rendered icon depicting a blue document with a raised bar graph. The bar graph features alternating blue, orange, and yellow bars of varying heights. White lines and a circular orange and white element are also present on the blue document surface. The icon is isolated on a white background. Progress decrease vectors 3 D blue document icon with orange and blue bar graph and white lines image. A 3D rendered icon depicting a blue document with a raised bar graph. The bar graph features alternating blue, orange, and yellow bars of varying heights. White lines and a circular orange and white element are also present on the blue document surface. The icon is isolated on a white background
Free with trial This infographic features a collection of colorful charts and graphs on a white background, surrounded by arrows pointing in different directions. The image represents business and finance concepts, such as data analysis, statistics, and trends. The vibrant colors and dynamic design make it visually appealing and engaging. Progress decrease vectors A colorful infographic with arrows and charts on a white background. This infographic features a collection of colorful charts and graphs on a white background, surrounded by arrows pointing in different directions. The image represents business and finance concepts, such as data analysis, statistics, and trends. The vibrant colors and dynamic design make it visually appealing and engaging.
Free with trial A black icon representing a bar chart with bars decreasing in height Clear details and vibrant colors enhance. Progress decrease illustrations Black descending bar chart icon on white background graph decline. A black icon representing a bar chart with bars decreasing in height Clear details and vibrant colors enhance
Free with trial Conceptual Illustration of Cost Analysis and Research Strategy with a Computer Screen and Hand Gestures in a Modern Digital Environment Quark. Progress decrease illustrations Conceptual Illustration of Cost Analysis and Research Strategy with a Computer Screen and Hand Gestures in a Modern
Free with trial Dollar Coins with Upward and Downward Arrows Representing Financial Growth and Decline in Minimalist Flat Style. Progress decrease vectors Dollar Coins with Upward and Downward Arrows Representing Financial Growth and Decline in Minimalist Flat Style
Free with trial A 3D render of a shiny red arrow curving downwards, indicating a negative trend or decline. Isolated on a clean white background for clarity. Progress decrease illustrations A glossy red arrow pointing downwards, isolated on white background. A 3D render of a shiny red arrow curving downwards, indicating a negative trend or decline. Isolated on a clean white background for clarity
Free with trial This image showcases a red piggy bank, calculator, and pen, symbolizing financial planning. The realistic scene was generated by AI, emphasizing the tools needed for effective savings and budgeting. Perfect for financial literacy resources. Progress decrease illustrations Saving & Budgeting Tools. This image showcases a red piggy bank, calculator, and pen, symbolizing financial planning. The realistic scene was generated by AI, emphasizing the tools needed for effective savings and budgeting. Perfect for financial literacy resources.
Free with trial This image features an abstract illustration of a bar graph against a dark gray background. The graph consists of three vertical bars of varying heights, each with horizontal rectangles inside. The bars are shades of white and gray, creating a minimalist and modern design. This image can be used to represent data, growth, statistics, or business performance in a visually appealing manner. Progress decrease vectors Abstract Bar Graph Illustration. This image features an abstract illustration of a bar graph against a dark gray background. The graph consists of three vertical bars of varying heights, each with horizontal rectangles inside. The bars are shades of white and gray, creating a minimalist and modern design. This image can be used to represent data, growth, statistics, or business performance in a visually appealing manner.
Free with trial Bar chart representation of data increase growth and finance. Data analysis. Progress decrease vectors Bar chart representation of data increase growth and finance. Data analysis
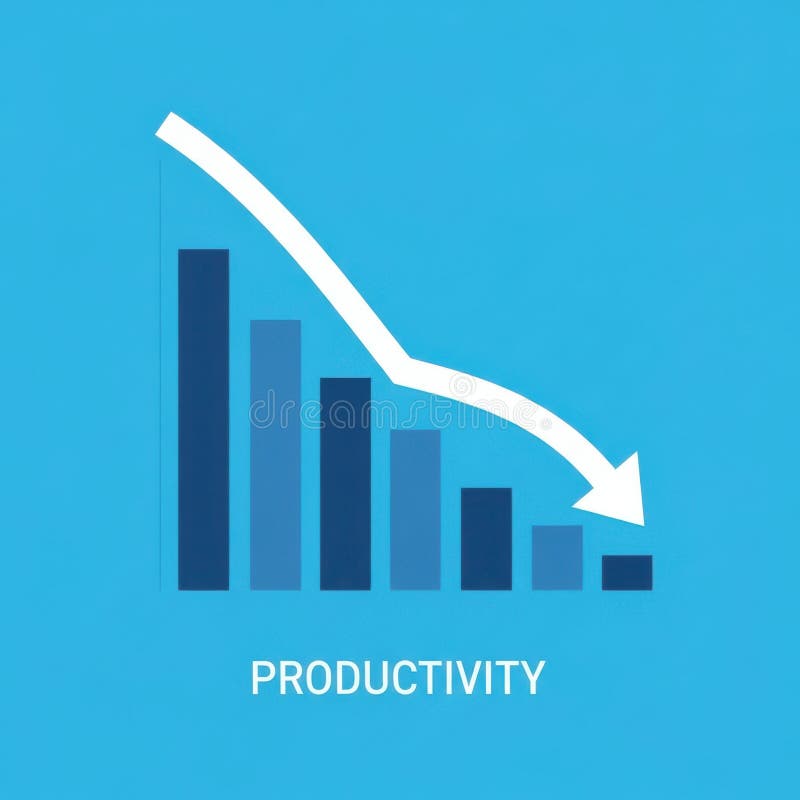
Free with trial A bar graph visually represents a downward trend in productivity over time, indicating a decline in efficiency or output. Progress decrease illustrations Decreasing Productivity Graph Showing Decline. A bar graph visually represents a downward trend in productivity over time, indicating a decline in efficiency or output
Free with trial Two rounded square buttons, one green with a white up arrow and one red with a white down arrow, isolated on a transparent background. Progress decrease vectors Green up arrow and red down arrow icons isolated on transparent background. Two rounded square buttons, one green with a white up arrow and one red with a white down arrow, isolated on a transparent background
Free with trial Two bar graphs, one green showing growth and one red showing decline, with trend lines indicating opposite directions. Progress decrease illustrations Bar graphs showing upward and downward trends. Two bar graphs, one green showing growth and one red showing decline, with trend lines indicating opposite directions
Free with trial A thick, bright red arrow with a white outline, angled downwards and to the right, indicating direction or decline. Progress decrease vectors Bold red arrow pointing down and to the right. A thick, bright red arrow with a white outline, angled downwards and to the right, indicating direction or decline
Free with trial Futuristic Robot Hand Displaying Download Icon for Cost Reduction Strategy in Digital Business Environment Quark. Progress decrease illustrations Futuristic Robot Hand Displaying Download Icon for Cost Reduction Strategy in Digital Business Environment Quark
Free with trial Two sets of simple flat design charts showing bar graphs with line graphs and three-segment pie charts in red, green, and blue. Progress decrease vectors Two bar charts with line graphs and two pie charts data visualization statistics. Two sets of simple flat design charts showing bar graphs with line graphs and three-segment pie charts in red, green, and blue
Free with trial A shiny, three-dimensional red arrow pointing downwards, presented as an isolated object on a transparent background. Progress decrease vectors Glossy red downward pointing arrow isolated on transparent background. A shiny, three-dimensional red arrow pointing downwards, presented as an isolated object on a transparent background
Free with trial A black diagonal arrow pointing downwards on a white background. Clear details and vibrant colors enhance visu. Progress decrease illustrations Black Diagonal Down Arrow Icon on White Background direction movement. A black diagonal arrow pointing downwards on a white background. Clear details and vibrant colors enhance visu
Free with trial Two thick black hand-drawn zigzag arrows with sharp arrowheads pointing in opposite directions are isolated on a solid white background. Progress decrease vectors Hand-drawn pair of black zigzag arrows pointing opposite directions on a clean white background illustration. Two thick black hand-drawn zigzag arrows with sharp arrowheads pointing in opposite directions are isolated on a solid white background
Free with trial A black upward arrow merges into a downward curving line graph on a white background. Progress decrease illustrations Black upward arrow and downward curve graph on white background chart. A black upward arrow merges into a downward curving line graph on a white background
Free with trial Two black arrows, one pointing up and the other down with the word PUT on it, on a white background. Progress decrease illustrations Black upward arrow and downward arrow with the word PUT on the second arrow direction. Two black arrows, one pointing up and the other down with the word PUT on it, on a white background
Free with trial Line art icon featuring a magnifying glass positioned over a vertical bar chart. The design is simple and minimalistic, using grey lines. The bar chart consists of three bars of varying heights, and the magnifying glass is centered over the middle bar, suggesting examination or analysis of data. This icon is likely used to symbolize data analysis, inspection, or detailed observation in a graphical representation. Progress decrease vectors Line art icon of magnifying glass over bar chart. Line art icon featuring a magnifying glass positioned over a vertical bar chart. The design is simple and minimalistic, using grey lines. The bar chart consists of three bars of varying heights, and the magnifying glass is centered over the middle bar, suggesting examination or analysis of data. This icon is likely used to symbolize data analysis, inspection, or detailed observation in a graphical representation.
Free with trial A green line graph illustrating data points over time, with the y-axis labeled 'Value' and the x-axis labeled 'Time', showcasing significant ups and downs in the data. Progress decrease illustrations Line graph showing fluctuating values over time. A green line graph illustrating data points over time, with the y-axis labeled 'Value' and the x-axis labeled 'Time', showcasing significant ups and downs in the data
Free with trial Futuristic Robotic Hand Interacting with Digital Interface for Cost Analysis and Reduction Strategies in Business Environment Quark. Progress decrease illustrations Futuristic Robotic Hand Interacting with Digital Interface for Cost Analysis and Reduction Strategies in Business
Free with trial Depreciation down graph fail bankruptcy diagram financial business crisis economy vector. Progress decrease vectors Depreciation down graph fail bankruptcy diagram financial business crisis economy
Free with trial Cost Analysis in Business Strategy: Hands on Laptop with Graphs and Icons Representing Marketing, Planning, and Research in Contemporary Workspace Quark. Progress decrease illustrations Cost Analysis in Business Strategy: Hands on Laptop with Graphs and Icons Representing Marketing, Planning, and Research
Free with trial A vibrant red arrow curves downwards, indicating a direction or trend. The arrow has a gradient effect and a sharp point. Progress decrease illustrations Red curved arrow pointing downward. A vibrant red arrow curves downwards, indicating a direction or trend. The arrow has a gradient effect and a sharp point
Free with trial Robotic Hand Interacting with Digital Cost Reduction Interface in a Futuristic Cityscape with Data Graphs and Business Icons Quark. Progress decrease illustrations Robotic Hand Interacting with Digital Cost Reduction Interface in a Futuristic Cityscape with Data Graphs and Business
Free with trial Two translucent blue glass arrows are positioned against a white background. One arrow points upwards, and the other points downwards, symbolizing direction, change, or opposing forces. The arrows have a glossy, reflective surface, giving them a modern and digital appearance. Progress decrease illustrations Two Blue Glass Arrows Pointing Up and Down on a White Background up arrow down arrow. Two translucent blue glass arrows are positioned against a white background. One arrow points upwards, and the other points downwards, symbolizing direction, change, or opposing forces. The arrows have a glossy, reflective surface, giving them a modern and digital appearance
Free with trial A hand interacts with vibrant financial charts, showcasing data trends through modern technology and digital interfaces, ideal for conveying analytics and growth. Scalp. Progress decrease illustrations Hand Interacting with Financial Growth Chart Displaying Data Trends and Indicators Through Interactive Technology and. A hand interacts with vibrant financial. A hand interacts with vibrant financial charts, showcasing data trends through modern technology and digital interfaces, ideal for conveying analytics and growth. Scalp
Free with trial Up Down Pointer Icon Scroll Gesture Point Pointing Page Upward Downward Navigation Direction Swipe North South Sign Symbol Graphic Illustration Path. Progress decrease vectors Up Down Pointer Icon Scroll Gesture Point Pointing Page Upward Downward Navigation Direction Swipe North South
Free with trial Combining love growth and decline charts, symbolizing relationship ups and downs. Perfect for dating, counseling, and emotional data visualization projects. Progress decrease vectors Combining love growth and decline charts, symbolizing relationship ups and downs. Perfect for dating, counseling, and emotional
Free with trial Abstract 3d bar charts illustrating data visualization, financial statistics, and business analysis, presenting growth and decline trends in a report format. Progress decrease illustrations Business data visualization showing 3d bar graphs. Abstract 3d bar charts illustrating data visualization, financial statistics, and business analysis, presenting growth and decline trends in a report format
Free with trial A vibrant red arrow curves downwards, indicating a direction or trend. The arrow has a gradient effect and a sharp point. Progress decrease illustrations Red curved arrow pointing downward. A vibrant red arrow curves downwards, indicating a direction or trend. The arrow has a gradient effect and a sharp point
Free with trial Weight loss concept featuring sneakers, tape measure, and declining graph,. Progress decrease illustrations Weight loss concept featuring sneakers, tape measure, and declining graph
Free with trial Black icon illustrating a downward sloping graph with an arrow indicating decline on a white background. Progress decrease illustrations Black icon showing a downward sloping graph with an arrow chart decline. Black icon illustrating a downward sloping graph with an arrow indicating decline on a white background
Free with trial Aerial View of Business Professionals Collaborating on Cost Analysis with Laptop and Digital Graphs on Table in Modern Office Setting Quark. Progress decrease illustrations Aerial View of Business Professionals Collaborating on Cost Analysis with Laptop and Digital Graphs on Table in Modern
Free with trial Satisfaction meter offset shadow line icon. Customer experience, commerce. Measurement indicator. Sad, happy. Bold outline symbol with solid red fill. Modern flat illustration. Editable stroke. Progress decrease vectors Satisfaction meter offset shadow line icon
Free with trial Business Team Analyzing Cost Management Strategies Using Digital Technology in a Modern Workspace Environment Quark. Progress decrease illustrations Business Team Analyzing Cost Management Strategies Using Digital Technology in a Modern Workspace Environment Quark
Free with trial A glossy, translucent arrow pointing downwards, rendered with soft blue and purple hues, set against a muted, softly lit background. Progress decrease illustrations Glossy Translucent Downward Arrow Icon on Soft Blue Background direction. A glossy, translucent arrow pointing downwards, rendered with soft blue and purple hues, set against a muted, softly lit background
Free with trial Business graph with up arrow down arrow logo template. Progress decrease vectors Business graph with up arrow down arrow logo template
Free with trial Stock market. The rise and fall of securities. Successful trading. Market trend up green and red down arrows, financial graphs. Business investment growth and loss arrow. Graph going up and down symbol vector illustration. Progress decrease vectors Stock market. The rise and fall of securities. Successful trading. Market trend up green and red down arrows, financial graphs.
Free with trial Stock market. The rise and fall of securities. Successful trading. Market trend up green and red down arrows, financial graphs. Business investment growth and loss arrow. Graph going up and down symbol vector illustration. Progress decrease vectors Stock market. The rise and fall of securities. Successful trading. Market trend up green and red down arrows, financial graphs.
Free with trial Stock market. The rise and fall of securities. Successful trading. Market trend up green and red down arrows, financial graphs. Business investment growth and loss arrow. Graph going up and down symbol vector illustration. Progress decrease vectors Stock market. The rise and fall of securities. Successful trading. Market trend up green and red down arrows, financial graphs.
Free with trial Stock market. The rise and fall of securities. Successful trading. Market trend up green and red down arrows, financial graphs. Business investment growth and loss arrow. Graph going up and down symbol vector illustration. Progress decrease vectors Stock market. The rise and fall of securities. Successful trading. Market trend up green and red down arrows, financial graphs.
Free with trial Stock market. The rise and fall of securities. Successful trading. Market trend up green and red down arrows, financial graphs. Business investment growth and loss arrow. Graph going up and down symbol vector illustration. Progress decrease vectors Stock market. The rise and fall of securities. Successful trading. Market trend up green and red down arrows, financial graphs.
Free with trial Stock market. The rise and fall of securities. Successful trading. Market trend up green and red down arrows, financial graphs. Business investment growth and loss arrow. Graph going up and down symbol vector illustration. Progress decrease vectors Stock market. The rise and fall of securities. Successful trading. Market trend up green and red down arrows, financial graphs.
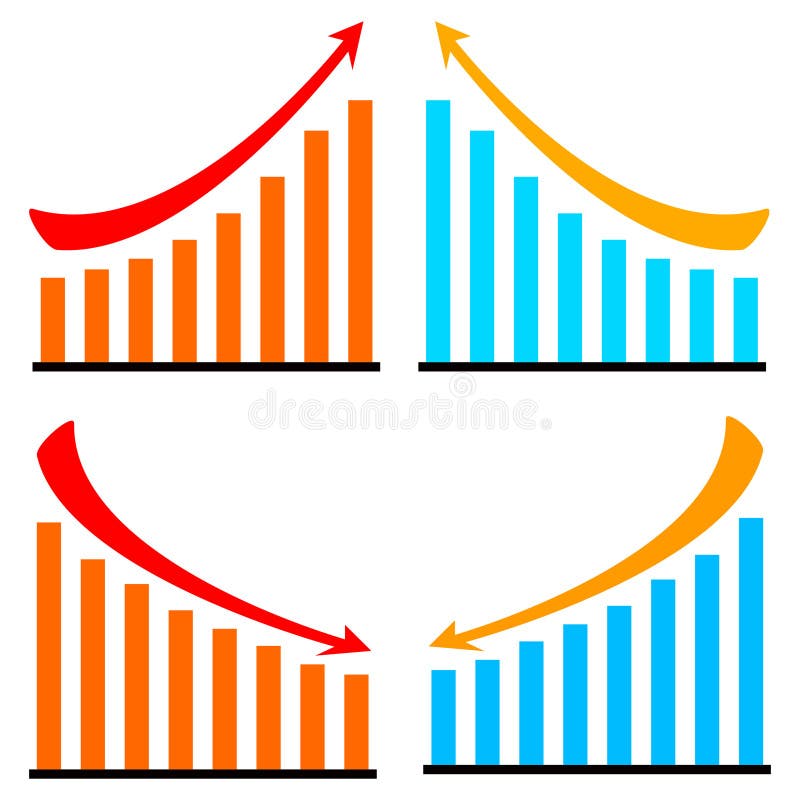
Free with trial Ascending and descending graph set. Vector illustration. Progress decrease vectors Ascending and descending graph set.
Free with trial Conceptual Image of Cost Analysis with Hands Reaching Out to Digital Graphs and Icons Representing Business Strategy and Financial Planning Quark. Progress decrease illustrations Conceptual Image of Cost Analysis with Hands Reaching Out to Digital Graphs and Icons Representing Business Strategy and