Free with trial A bright red arrow with a hand-drawn texture curves downwards. This graphic element effectively visualizes concepts of falling prices, negative trends, or a downward trajectory. Progress decrease illustrations Red downward curved arrow symbol hand drawn style showing decline or decrease. A bright red arrow with a hand-drawn texture curves downwards. This graphic element effectively visualizes concepts of falling prices, negative trends, or a downward trajectory
Free with trial Collection of green upward and red downward arrows in different shapes and styles, symbolizing growth, success, decline, and loss. Clean vector illustration isolated on transparent background, ideal for business, finance, analytics, marketing, and infographic design. Progress decrease vectors Green and Red Arrow Set Isolated on Transparent Background, Growth and Decline Vector Icons. Collection of green upward and red downward arrows in different shapes and styles, symbolizing growth, success, decline, and loss. Clean vector illustration isolated on transparent background, ideal for business, finance, analytics, marketing, and infographic design.
Free with trial Bullish profit vs bearish loss market trade background vector. Progress decrease vectors Bullish profit vs bearish loss market trade background
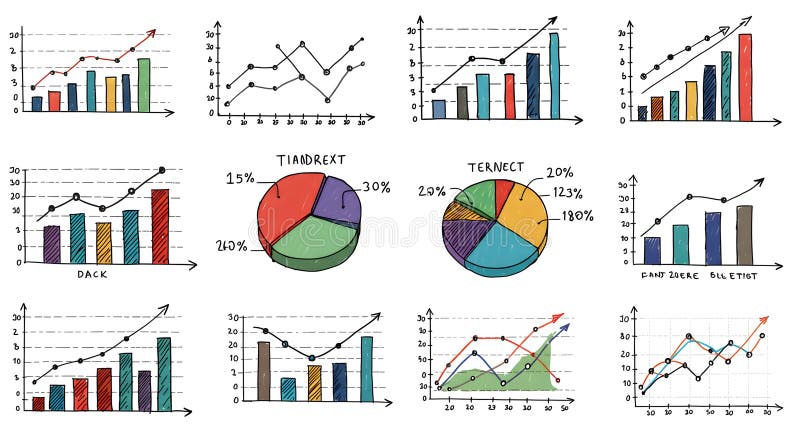
Free with trial A collection of hand-drawn style charts and diagrams that can be used to display data and analyze progress, ideal for business presentations, reports, or data visualizations. Progress decrease illustrations Hand-Drawn Collection of Statistical Charts and Diagrams for Business Analytics. A collection of hand-drawn style charts and diagrams that can be used to display data and analyze progress, ideal for business presentations, reports, or data visualizations
Free with trial This 3D rendering showcases colorful bar graphs, pie charts, and a calculator, vividly illustrating concepts of business growth, financial success, and data analysis. The upward-trending arrow emphasizes positive progress. Progress decrease illustrations Colorful 3D Charts and Calculator Illustrating Business Growth and Financial Success. This 3D rendering showcases colorful bar graphs, pie charts, and a calculator, vividly illustrating concepts of business growth, financial success, and data analysis. The upward-trending arrow emphasizes positive progress.
Free with trial Arrow line icons set. Traffic signs to update and transfer data, exchange and repeat, rotate movement, increase and decrease business expand thin black and red outline symbols vector illustration. Progress decrease vectors Arrow line icons set, traffic signs, update and transfer data, repeat or rotate movement. Arrow line icons set. Traffic signs to update and transfer data, exchange and repeat, rotate movement, increase and decrease business expand thin black and red outline symbols vector illustration
Free with trial Person holding checklist and tablet with a clock icon, next to a dollar sign and downward arrow. Ideal for financial management, time efficiency, budget planning, productivity, cost reduction. Progress decrease illustrations Businessperson Analyzing Checklist and Tablet as Costs Decrease Indicated by Downward Dollar Arrow. Person holding checklist and tablet with a clock icon, next to a dollar sign and downward arrow. Ideal for financial management, time efficiency, budget planning, productivity, cost reduction
Free with trial A red arrow is pointing upward, with wooden blocks stacked below it. Concept of progress and growth, as the arrow rises and the blocks below it grow in size generated by AI. Progress decrease vectors A red arrow is pointing upward, with wooden blocks stacked below it generated by AI. A red arrow is pointing upward, with wooden blocks stacked below it. Concept of progress and growth, as the arrow rises and the blocks below it grow in size generated by AI
Free with trial A 3D rendered graph displays a downward trend. Two tall green bars are followed by two shorter pink bars, indicating a decrease in value. A thick yellow arrow with a sharp point descends diagonally across the bars, emphasizing the decline. The background is a solid, light blue color. Progress decrease illustrations Falling graph with green and pink bars and a yellow arrow pointing down chart decline. A 3D rendered graph displays a downward trend. Two tall green bars are followed by two shorter pink bars, indicating a decrease in value. A thick yellow arrow with a sharp point descends diagonally across the bars, emphasizing the decline. The background is a solid, light blue color
Free with trial A person's open palm supports a glowing digital graph illustrating a decrease in cost and an increase in quality, set against a dark background. Progress decrease illustrations Hand holding glowing graph showing cost decreasing and quality increasing palm open. A person's open palm supports a glowing digital graph illustrating a decrease in cost and an increase in quality, set against a dark background
Free with trial This vibrant image showcases a 3D rendering of colorful cylinders arranged on a pink platform, overlaid with a rising line graph symbolizing upward trends and positive growth. Perfect for illustrating business success, financial progress, or marketing presentations. Progress decrease illustrations Colorful 3D Cylinders and Rising Line Graph on Pink Platform: Business Growth Concept. This vibrant image showcases a 3D rendering of colorful cylinders arranged on a pink platform, overlaid with a rising line graph symbolizing upward trends and positive growth. Perfect for illustrating business success, financial progress, or marketing presentations.
Free with trial A simple 3D bar chart composed of three colored cubes stands on a white background. The cubes are arranged in ascending order of height from left to right: a small blue cube, a medium yellow cube, and a tall red cube. This arrangement visually represents increasing data or progress. Progress decrease illustrations Colorful Bar Chart with Red, Yellow, and Blue Cubes on White Background graph statistics. A simple 3D bar chart composed of three colored cubes stands on a white background. The cubes are arranged in ascending order of height from left to right: a small blue cube, a medium yellow cube, and a tall red cube. This arrangement visually represents increasing data or progress
Free with trial Graph icon indicating growth and data analysis, perfect for business presentations and financial reports. visual representation of progress ,Generative ai. Progress decrease illustrations Graph icon, a comprehensive symbol of data analysis, growth, and business trends for effective presentations. Graph icon indicating growth and data analysis, perfect for business presentations and financial reports. visual representation of progress ,Generative ai
Free with trial Colorful growth chart with red and teal bars showing upward and downward arrows on a light background representing data trends progress decline business performance and financial analytics visual. Progress decrease illustrations Colorful growth chart with red and teal bars and upward and downward arrows on light background. colorful growth chart with red and teal bars showing upward and downward arrows on a light background representing data trends progress decline business performance and financial analytics visual
Free with trial A visual representation of declining data points connected by a red line. This graphic effectively illustrates a negative trend or decrease over time, suitable for financial or performance reports. Progress decrease illustrations Data trend analysis showing downward trajectory with red dots and connecting line vector. A visual representation of declining data points connected by a red line. This graphic effectively illustrates a negative trend or decrease over time, suitable for financial or performance reports
Free with trial A minimalist 3D render displays three rounded rectangular bars representing a bar graph. The tallest bar is a soft blue, followed by a medium green bar, and the shortest is a light pink bar. They are arranged in descending order of height and stand on a plain white background, suggesting data visualization or progress. Progress decrease illustrations Three colorful 3D bar graph elements in blue green and pink on a white background chart. A minimalist 3D render displays three rounded rectangular bars representing a bar graph. The tallest bar is a soft blue, followed by a medium green bar, and the shortest is a light pink bar. They are arranged in descending order of height and stand on a plain white background, suggesting data visualization or progress
Free with trial A man presents a business strategy aimed at increasing quality and decreasing cost represented by arrows pointing up for quality and down for cost showcasing improved efficiency and profitability within a company The hand presentation signifies control optimization and forwardthinking initiatives. Progress decrease illustrations Business strategy concept presenting increase in quality and decrease in cost with a rising arrow and a falling arrow presented on. A man presents a business strategy aimed at increasing quality and decreasing cost represented by arrows pointing up for quality and down for cost showcasing improved efficiency and profitability within a company The hand presentation signifies control optimization and forwardthinking initiatives
Free with trial Wooden blocks display sad and happy faces topped with increasing stacks of coins illustrating financial growth and investment success representing a visual metaphor for economic progress and the jour. Progress decrease illustrations Wooden blocks with sad and happy faces showing financial growth with stacked coins. Wooden blocks display sad and happy faces topped with increasing stacks of coins illustrating financial growth and investment success representing a visual metaphor for economic progress and the jour
Free with trial Colorful growth chart featuring orange and teal bars with upward and downward arrows on a clean white background representing progress decline business data trends and financial performance metrics. Progress decrease illustrations Colorful growth chart with orange and teal bars and upward and downward arrows on white background. colorful growth chart featuring orange and teal bars with upward and downward arrows on a clean white background representing progress decline business data trends and financial performance metrics
Free with trial A tranquil lake reflects the image of a stylized graph in the sky, suggesting descending lines. The structure appears artistic, constructed from slender beams, and is positioned against a backdrop of a setting sun. The sky is tinged with warm hues, casting a serene glow over the water. Surrounding the lake are silhouetted trees and distant mountains, adding to the calm ambiance. The reflection in the water is almost a mirror image, enhancing the peaceful atmosphere of the scene. Progress decrease illustrations A serene lake mirrors an upside-down graph, symbolizing a decrease in carbon emissions floating. A tranquil lake reflects the image of a stylized graph in the sky, suggesting descending lines. The structure appears artistic, constructed from slender beams, and is positioned against a backdrop of a setting sun. The sky is tinged with warm hues, casting a serene glow over the water. Surrounding the lake are silhouetted trees and distant mountains, adding to the calm ambiance. The reflection in the water is almost a mirror image, enhancing the peaceful atmosphere of the scene.
Free with trial Two prominent blue three-dimensional arrows are positioned vertically against a stark white background. One arrow points directly upwards, and the other points directly downwards, symbolizing opposing directions or concepts such as increase and decrease. Progress decrease illustrations Two Blue 3D Arrows Pointing Up and Down on a White Background Keywords: arrow, arrows, up arrow, down arrow, direction, movement. Two prominent blue three-dimensional arrows are positioned vertically against a stark white background. One arrow points directly upwards, and the other points directly downwards, symbolizing opposing directions or concepts such as increase and decrease
Free with trial Three-dimensional rectangular bars stand side-by-side on a white background. The bars are of different heights, with the shortest on the left, a medium-height bar in the middle, and the tallest bar on the right. The bars are colored blue, pink, and orange, respectively. This arrangement visually represents a bar chart or graph, suggesting concepts of growth, data comparison, or progress. Progress decrease illustrations Three 3D Rendered Rectangular Bars of Varying Heights and Colors on a White Background bar chart. Three-dimensional rectangular bars stand side-by-side on a white background. The bars are of different heights, with the shortest on the left, a medium-height bar in the middle, and the tallest bar on the right. The bars are colored blue, pink, and orange, respectively. This arrangement visually represents a bar chart or graph, suggesting concepts of growth, data comparison, or progress
Free with trial Three black, rounded, vertical bars of progressively increasing height are displayed against a clean white background. The bars are smooth and have a matte finish. This visual representation suggests concepts of growth, progress, data analysis, or a simple bar graph. Progress decrease illustrations Three black rounded bars of increasing height on a white background bar chart graph. Three black, rounded, vertical bars of progressively increasing height are displayed against a clean white background. The bars are smooth and have a matte finish. This visual representation suggests concepts of growth, progress, data analysis, or a simple bar graph
Free with trial Person holds smartphone displaying stock market charts. Person reviews financial data. Stock market trading in progress, on computer monitor. Person analyses market trends. Person. Progress decrease illustrations Person holds smartphone displaying stock market charts. Person reviews financial data. Stock market trading in progress on. Person holds smartphone displaying stock market charts. Person reviews financial data. Stock market trading in progress, on computer monitor. Person analyses market trends. Person.
Free with trial Financial chart illustration. Declining graphic concept. Red arrow decrease Vector. Business diagram symbol. EPS 10. Progress decrease vectors Financial chart illustration. Declining graphic concept. Red arrow decrease Vector. Business diagram symbol.
Free with trial Profit growing and decrease sumbol. Statistic up and down arrows. Business growths chart. Green and red arrow - stock vector. Progress decrease illustrations Profit growing and decrease sumbol. Statistic up and down arrows. Business growths chart. Green and red arrow - stock vector
Free with trial This image features six black bar chart icons with red and green arrows showing increase, decrease, and uncertainty trends. It is a clear, simple vector for business or data visuals, informative and clean. Generative AI. Progress decrease vectors Set of six vector bar chart icons with arrows indicating trends and question mark in black and colored design elements. This image features six black bar chart icons with red and green arrows showing increase, decrease, and uncertainty trends. It is a clear, simple vector for business or data visuals, informative and clean. Generative AI
Free with trial Clock With Arrows Line And Solid Icon Set. Time Management, Efficiency, And Productivity Symbol Collection. Directional Arrows Indicating Increase And Decrease. Isolated Vector Illustration. Progress decrease vectors Clock With Arrows Line And Solid Icon Set. Time Management, Efficiency, And Productivity Symbol Collection. Directional
Free with trial Pixel Art Arrow Icon Set. Directional Navigation And Trend Indicators In Pixelated Style. Upward, Downward, And Curved Arrows For Movement And Progress Representation. Isolated Vector Illustration. Progress decrease vectors Pixel Art Arrow Icon Set. Directional Navigation And Trend Indicators In Pixelated Style. Upward, Downward, And Curved
Free with trial Colorful 3D bar graph illustrating contrasting trends: growth and decline. Symbolizes business fluctuations, market volatility, economic change, opposing forces, and progress. Ideal for promoting your services or creating eye-catching visuals. Open area for featuring your products, copy space, banner, advertisement. . Generative AI. Progress decrease illustrations Rising and Falling Bar Graph Colorful 3D bar graph illustrating contrasting trends growth and decline Symbolizes business. Colorful 3D bar graph illustrating contrasting trends: growth and decline. Symbolizes business fluctuations, market volatility, economic change, opposing forces, and progress. Ideal for promoting your services or creating eye-catching visuals. Open area for featuring your products, copy space, banner, advertisement. . Generative AI
Free with trial This high-quality vector graphic features a simple, hand-drawn red arrow pointing downwards. Perfect for presentations, websites, infographics, and any project requiring a clear and concise directional indicator. The minimalist design ensures versatility across various styles and applications. Download this easily scalable vector and enhance your designs with a clean and professional look. Ideal for illustrating decline, decrease, or a downward trend. This versatile asset is perfect for both digital and print use, offering high-resolution quality for crisp results. Progress decrease illustrations Hand-Drawn Red Down Arrow: Simple, Clean, and Versatile Vector Graphic for Presentations, Websites, and More! UI UX sign. This high-quality vector graphic features a simple, hand-drawn red arrow pointing downwards. Perfect for presentations, websites, infographics, and any project requiring a clear and concise directional indicator. The minimalist design ensures versatility across various styles and applications. Download this easily scalable vector and enhance your designs with a clean and professional look. Ideal for illustrating decline, decrease, or a downward trend. This versatile asset is perfect for both digital and print use, offering high-resolution quality for crisp results.
Free with trial A simple yet effective hand-drawn red arrow pointing downwards. This vector graphic is ideal for various applications, from presentations and websites to marketing materials. Its clean design makes it easily adaptable to different projects, conveying decline, decrease, or negative trends clearly and concisely. Perfect for illustrating data, showcasing negative growth, or simply adding a visual cue to your design. The minimalist aesthetic ensures versatility across diverse design styles. Progress decrease illustrations Hand Drawn Red Down Arrow: Simple, Clean Vector Graphic for Presentations, Websites, and Marketing Materials. Perfect. A simple yet effective hand-drawn red arrow pointing downwards. This vector graphic is ideal for various applications, from presentations and websites to marketing materials. Its clean design makes it easily adaptable to different projects, conveying decline, decrease, or negative trends clearly and concisely. Perfect for illustrating data, showcasing negative growth, or simply adding a visual cue to your design. The minimalist aesthetic ensures versatility across diverse design styles.
Free with trial Upward and downward arrows with a percentage symbol. An illustration of arrows pointing up and down, often used to represent changes, fluctuations, or progress, along with a percentage symbol. Progress decrease vectors Upward and Downward Arrows with Percentage, Financial Growth and Decline Concept. Upward and downward arrows with a percentage symbol. An illustration of arrows pointing up and down, often used to represent changes, fluctuations, or progress, along with a percentage symbol.
Free with trial Wooden blocks show opposing directional arrows, contrasting trends choices. One block features red up arrow, black down arrow, representing progress decline. Symbols convey concepts of. Progress decrease illustrations Wooden blocks show opposing directional arrows, contrasting trends choices. One block features red up arrow, black down arrow
Free with trial The image depicts a stylized graphic with a red and white flag positioned at the top of a series of gray blocks that decrease in height from left to right. The flag appears to be waving, suggesting movement or success, while the blocks resemble a bar chart or a staircase. Progress decrease illustrations A flag waving atop a progressively descending set of gray blocks. The image depicts a stylized graphic with a red and white flag positioned at the top of a series of gray blocks that decrease in height from left to right. The flag appears to be waving, suggesting movement or success, while the blocks resemble a bar chart or a staircase
Free with trial 3D Illustration Business Graph Chart Growth Success Analysis Finance Investment Strategy Data Market Stock Economy Trading Financial Progress Report. Progress decrease illustrations 3D Illustration Business Graph Chart Growth Success Analysis Finance Investment Strategy Data Market Stock Economy Trading
Free with trial Watercolor illustration of business growth. Orange bar, pie charts on aged paper show data analysis, market trends, financial progress. Visuals represent success, planning strategic. Progress decrease illustrations Watercolor illustration of business growth. Orange bar, pie charts on aged paper show data analysis, market trends, financial
Free with trial A person in a suit presents a bar chart indicating quality increase and cost decrease, illuminated by golden light. Progress decrease illustrations Person in Suit Presenting Bar Chart with Quality Up and Cost Down, Illuminated by Golden Light Modern technology business. A person in a suit presents a bar chart indicating quality increase and cost decrease, illuminated by golden light
Free with trial A percentage graph visually represents statistical data, showcasing trends, growth, and performance metrics for analysis and decision-making processes. Progress decrease vectors Vector art of a percentage graph illustrates statistical data, representing growth, progress, and performance analysis in a visual. A percentage graph visually represents statistical data, showcasing trends, growth, and performance metrics for analysis and decision-making processes
Free with trial A businessman in a suit holds a bar chart showing quality increasing and cost decreasing, with golden sparkles. Progress decrease illustrations Businessman Holding Upward Trending Bar Chart Showing Quality Increase and Cost Decrease with Golden Sparkles Modern technology. A businessman in a suit holds a bar chart showing quality increasing and cost decreasing, with golden sparkles
Free with trial Financial graph, Business concept, Price increase, Price decrease. Progress decrease vectors Financial graph, Business concept, Price increase, Price decrease
Free with trial Gold bar on white background. Isolated 3D illustration. Progress decrease illustrations Gold bar on white background. Isolated 3D illustration
Free with trial Digital glowing arrow and lightning icons in low poly futuristic style on dark background. Progress decrease vectors Futuristic Polygonal Up Arrow, Lightning Bolt, and Down Arrow Icons. Digital glowing arrow and lightning icons in low poly futuristic style on dark background
Free with trial The blue downward arrow symbol. Progress decrease illustrations Blue arrow on white background, downward. the blue downward arrow symbol
Free with trial Heart health bar with low gauge in retro 8 bit style, crisp pixels and bold outline. Symbol of life, stamina, energy and survival for gaming hud and ui. Cartoon vector illustration. Progress decrease vectors Heart Health Bar Pixel Art. Heart health bar with low gauge in retro 8 bit style, crisp pixels and bold outline. Symbol of life, stamina, energy and survival for gaming hud and ui. Cartoon vector illustration.
Free with trial 3d economic crisis bar graph chart with red arrow going down bankruptcy financial stock market crash downtrend symbol chart going down sign on green blue mint pastel color background 3D rendering. Progress decrease illustrations 3d economic crisis bar graph chart with red arrow going down bankruptcy financial stock market crash downtrend symbol chart going
Free with trial Isolated orange basketballs are stacked in descending vertical columns. 3D Rendering. 3D. Progress decrease illustrations Isolated orange basketballs are stacked in descending vertical columns. 3D Rendering. Isolated orange basketballs are stacked in descending vertical columns. 3D
Free with trial Decreasing coin stacks with a red down arrow showing economic recession or financial crisis. Vector illustration. Progress decrease illustrations Decreasing coin stacks with a red down arrow. Decreasing coin stacks with a red down arrow showing economic recession or financial crisis. Vector illustration
Free with trial Set of red 3D arrows pointing downward in various styles. Concept of business decline, market crash, or financial loss for economic visualization. Vector illustration. Progress decrease vectors Set of red 3D arrows pointing downward
Free with trial Abstract blue green dotted financial graph chart sparkling background. Vector minimal tech design. Progress decrease vectors Abstract dotted financial graph chart sparkling background. Abstract blue green dotted financial graph chart sparkling background. Vector minimal tech design
Free with trial Health bar with rounded capsule frame showing low hp in retro pixel blocks on transparent background. Concept of danger, failure, risk, game over, and urgency. Cartoon vector illustration. Progress decrease vectors Health Bar Low Pixel Art. Health bar with rounded capsule frame showing low hp in retro pixel blocks on transparent background. Concept of danger, failure, risk, game over, and urgency. Cartoon vector illustration.
Free with trial Continuous one line art down graph chart icon flat style design isolated vector illustration on white background. Progress decrease vectors Continuous one line art down graph chart icon flat style
Free with trial Down graph chart icon in trendy flat style design isolated vector illustration on white background. Progress decrease vectors Down graph chart icon in trendy flat style design isolated
Free with trial Stock market trade bull vs bear yellow background vector. Progress decrease vectors Stock market trade bull vs bear yellow background
Free with trial Bull vs bear stock market trade chart background vector. Progress decrease vectors Bull vs bear stock market trade chart background
Free with trial Dotted bull vs bear financial market chart background vector. Progress decrease vectors Dotted bull vs bear financial market chart background
Free with trial Stock market trading bull vs bear strategy background vector. Progress decrease vectors Stock market trading bull vs bear strategy background
Free with trial Bull profit vs bear loss stock trade dark background vector. Progress decrease vectors Bull profit vs bear loss stock trade dark background
Free with trial Bullish vs bearish stock market trade chart background vector. Progress decrease vectors Bullish vs bearish stock market trade chart background
Free with trial Particle style bull vs bear stock market trade background vector. Progress decrease vectors Particle style bull vs bear stock market trade background
Free with trial Stock market bullish vs bearish economy trend background vector. Progress decrease vectors Stock market bullish vs bearish economy trend background
Free with trial Bullish vs bearish stock trade strategy concept background vector. Progress decrease vectors Bullish vs bearish stock trade strategy concept background
Free with trial Indian stock market bull vs bear background with rupee sign vector. Progress decrease vectors Indian stock market bull vs bear background with rupee sign
Free with trial Stock market bull vs bear price trade volatility background vector. Progress decrease vectors Stock market bull vs bear price trade volatility background
Free with trial Bull vs bear indian stock market background with rupee sign vector. Progress decrease vectors Bull vs bear indian stock market background with rupee sign
Free with trial Stock market financial chart bear vs bull strategy background vector. Progress decrease vectors Stock market financial chart bear vs bull strategy background
Free with trial Bullish vs bearish stock market price indicator chart background vector. Progress decrease vectors Bullish vs bearish stock market price indicator chart background
Free with trial Symbol of stock market bullish profit vs bearish loss background vector. Progress decrease vectors Symbol of stock market bullish profit vs bearish loss background
Free with trial A minimalist black and white icon representing documents with an upward and downward arrow. This graphic symbolizes concepts like report generation, data analysis, growth, decline, upload, download, information flow, and business metrics. It's ideal for presentations, websites, and applications related to finance, business, technology, and data management. Progress decrease vectors Document Growth and Data Flow Icon. A minimalist black and white icon representing documents with an upward and downward arrow. This graphic symbolizes concepts like report generation, data analysis, growth, decline, upload, download, information flow, and business metrics. It's ideal for presentations, websites, and applications related to finance, business, technology, and data management.
Free with trial Two large arrows, one blue pointing up and one green pointing down, dominate a bright blue background. Between the arrows are four small squares in shades of pink, red, and light blue. The design creates a stark contrast with its vivid colors and geometric shapes, suggesting a theme of direction or movement. Progress decrease vectors Abstract Up and Down Arrows. Two large arrows, one blue pointing up and one green pointing down, dominate a bright blue background. Between the arrows are four small squares in shades of pink, red, and light blue. The design creates a stark contrast with its vivid colors and geometric shapes, suggesting a theme of direction or movement.
Free with trial Arrow bending into a spiral with rough hand-drawn lines and jagged tip, arranged in a circular sweep. Symbol of decline, drop, downturn, and navigation flow. Cartoon vector illustration. Progress decrease vectors Arrow Curving Down Spiral Sketch. Arrow bending into a spiral with rough hand-drawn lines and jagged tip, arranged in a circular sweep. Symbol of decline, drop, downturn, and navigation flow. Cartoon vector illustration.
Free with trial Arrow Trending Down : Arrow trending down represents decline, decrease, or negative trend. Progress decrease vectors Arrow Trending Down
Free with trial A person meticulously studies complex financial or historical data displayed on a paper chart. The brass-rimmed magnifying glass highlights crucial upticks and downward trends in the graph line. Rendered by Ai. This scene captures the essence of deep research, analysis, and discovery in a vintage setting. Progress decrease illustrations Magnifying glass focused on a detailed stock chart. A person meticulously studies complex financial or historical data displayed on a paper chart. The brass-rimmed magnifying glass highlights crucial upticks and downward trends in the graph line. Rendered by Ai. This scene captures the essence of deep research, analysis, and discovery in a vintage setting
Free with trial Slider : Slider is a movable control used to increase or decrease values smoothly on devices or software. Progress decrease vectors Illustration of Slider. Slider : Slider is a movable control used to increase or decrease values smoothly on devices or software.
Free with trial A simple outline icon featuring a circular arrow enclosing two triangle symbols, one pointing upwards and one downwards. This graphic effectively represents concepts like data fluctuation, refresh cycles, continuous change, market trends, or system updates involving variations. Ideal for illustrating processes, analytics, financial data, or any dynamic system requiring monitoring of increases and decreases. Its clean, minimalist design ensures versatility for web, app, and print applications. Progress decrease illustrations Refresh Cycle with Up Down Triangles Outline Icon. A simple outline icon featuring a circular arrow enclosing two triangle symbols, one pointing upwards and one downwards. This graphic effectively represents concepts like data fluctuation, refresh cycles, continuous change, market trends, or system updates involving variations. Ideal for illustrating processes, analytics, financial data, or any dynamic system requiring monitoring of increases and decreases. Its clean, minimalist design ensures versatility for web, app, and print applications.
Free with trial A minimalist line art icon representing eco-friendly energy. It features an electrical plug with a leaf symbol inside, connected by a wavy line to a downward-pointing arrow. This graphic symbolizes sustainable power, reduced energy usage, and environmental consciousness in electricity consumption. Ideal for concepts related to green energy, conservation, and responsible power management. Progress decrease vectors Eco-Friendly Energy Consumption Icon. A minimalist line art icon representing eco-friendly energy. It features an electrical plug with a leaf symbol inside, connected by a wavy line to a downward-pointing arrow. This graphic symbolizes sustainable power, reduced energy usage, and environmental consciousness in electricity consumption. Ideal for concepts related to green energy, conservation, and responsible power management.
Free with trial Comparing Bar Chart Data Analysis Icons vol 30444. Progress decrease vectors Comparing Bar Chart Data Analysis Icons
Free with trial Downward graph with trend points, sad face symbolizing poor performance, and a play button. Ideal for business, analytics, finance, marketing, strategy data loss media. Simple flat metaphor. Progress decrease vectors Declining Trend Chart with Sad Face and Play Button Concept. Downward graph with trend points, sad face symbolizing poor performance, and a play button. Ideal for business, analytics, finance, marketing, strategy data loss media. Simple flat metaphor
Free with trial Dotted style bull vs bear investing trade background vector. Progress decrease vectors Dotted style bull vs bear investing trade background
Free with trial Downward trending line graph with sad face emotion, classic phone icon, and computer monitor. Ideal for business loss, analytics, communication issues, technology, finance, statistics simple flat. Progress decrease vectors Declining Sales Graph with Sad Face, Phone Icon, and Monitor Display. Downward trending line graph with sad face emotion, classic phone icon, and computer monitor. Ideal for business loss, analytics, communication issues, technology, finance, statistics simple flat