Free with trial A wooden arrow pointing down is on top of a stack of wooden blocks. The arrow represents a downward trend or a decrease in something generated by AI. Progress decrease vectors A wooden arrow pointing down is on top of a stack of wooden blocks generated by AI. A wooden arrow pointing down is on top of a stack of wooden blocks. The arrow represents a downward trend or a decrease in something generated by AI
Free with trial Coins scatter beneath a downward blue arrow meeting an upward black arrow. Ideal for themes of finance, growth, investment, direction, currency, progress, success. Line metaphor. Progress decrease vectors Financial Growth Concept with Coins, Arrows, and Blue Indicator for Business Success. Coins scatter beneath a downward blue arrow meeting an upward black arrow. Ideal for themes of finance, growth, investment, direction, currency, progress, success. Line metaphor
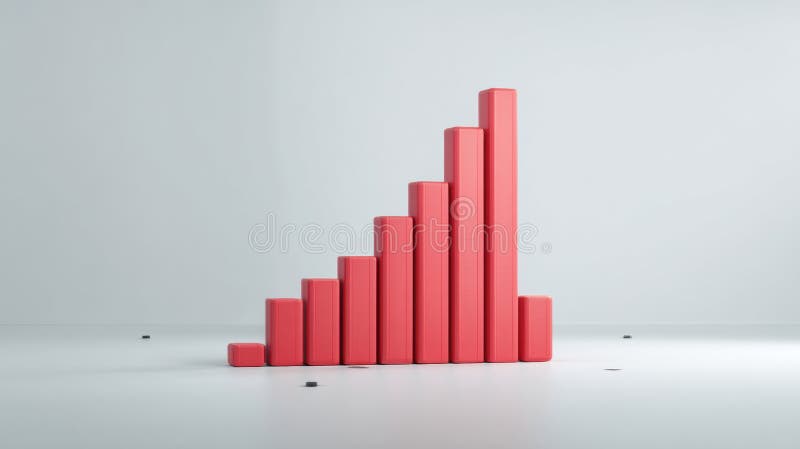
Free with trial A vibrant, 3D rendered bar chart displays ascending data, symbolizing progress and achievement. The pastel-colored bars are set against a clean white background, emphasizing their visual impact and providing a professional, modern feel. Perfect for presentations or business-related projects. Progress decrease illustrations Colorful 3D Bar Chart Showing Growth and Success on White Background. A vibrant, 3D rendered bar chart displays ascending data, symbolizing progress and achievement. The pastel-colored bars are set against a clean white background, emphasizing their visual impact and providing a professional, modern feel. Perfect for presentations or business-related projects.
Free with trial A stack of wooden blocks with a red arrow pointing upwards. The blocks are arranged in a pyramid shape, with the top block being the largest. Concept of growth and progress generated by AI. Progress decrease vectors A stack of wooden blocks with a red arrow pointing upwards generated by AI. A stack of wooden blocks with a red arrow pointing upwards. The blocks are arranged in a pyramid shape, with the top block being the largest. Concept of growth and progress generated by AI
Free with trial A wooden arrow pointing upwards is on top of a stack of wooden blocks. Concept of growth and progress, as the arrow represents upward movement generated by AI. Progress decrease vectors A wooden arrow pointing upwards is on top of a stack of wooden blocks generated by AI. A wooden arrow pointing upwards is on top of a stack of wooden blocks. Concept of growth and progress, as the arrow represents upward movement generated by AI
Free with trial A 3D icon depicting an orange arrow pointing downwards in a zigzag pattern. The icon suggests downward movement, decline, decrease, or negative progress. It's commonly used to represent falling trends, negative changes, or downward movement in data or statistics. Progress decrease vectors Arrow Chart Down 3D Icon. A 3D icon depicting an orange arrow pointing downwards in a zigzag pattern. The icon suggests downward movement, decline, decrease, or negative progress. It's commonly used to represent falling trends, negative changes, or downward movement in data or statistics.
Free with trial Contemporary art collage. Decrease. Young woman entrepreneur rolls down black arrow against beige background. Monochrome. Concept of motivation, professional growth, goal, aim, business, ad. Progress decrease illustrations Contemporary art collage. Decrease. Young woman entrepreneur rolls down black arrow against beige background. Minimalist. Contemporary art collage. Decrease. Young woman entrepreneur rolls down black arrow against beige background. Monochrome. Concept of motivation, professional growth, goal, aim, business, ad
Free with trial Gold bars on graph and arrow down, fall, chart gold with increase and decrease, gold profit and loss concept. Progress decrease vectors Gold bars on graph and arrow down, fall, chart gold with increase and decrease, gold profit and loss concept
Free with trial Reduction annual report green illustration carbon responsibility, commitment graph, decrease company reduction annual report green. Progress decrease illustrations Reduction annual report green
Free with trial A 3D rendered illustration depicting business growth. The image showcases two upward-trending arrow charts, one in gold and the other in blue, representing positive trends, progress, and success. The charts are set against a clean, light background, emphasizing the upward movement and potential for financial gain. Suitable for illustrating economic growth, investment strategies, and business performance. Progress decrease illustrations Growth Chart with Arrows. A 3D rendered illustration depicting business growth. The image showcases two upward-trending arrow charts, one in gold and the other in blue, representing positive trends, progress, and success. The charts are set against a clean, light background, emphasizing the upward movement and potential for financial gain. Suitable for illustrating economic growth, investment strategies, and business performance.
Free with trial Three red, 3D arrows curving downwards, generated by AI, symbolize decline, decrease, or downturn. The image offers a visual representation of negative trends or a downward trajectory, suitable for presentations or reports. Progress decrease illustrations Red Arrows Pointing Down. Three red, 3D arrows curving downwards, generated by AI, symbolize decline, decrease, or downturn. The image offers a visual representation of negative trends or a downward trajectory, suitable for presentations or reports.
Free with trial A vibrant green upward trending arrow signifies growth, progress, and positive development. The arrow's design is visually appealing and represents a successful trajectory. The dark background emphasizes the upward movement. Progress decrease illustrations Green Arrow Growth Chart. A vibrant green upward trending arrow signifies growth, progress, and positive development. The arrow's design is visually appealing and represents a successful trajectory. The dark background emphasizes the upward movement.
Free with trial 3D illustration of a bar graph showing a declining trend. Red bars of decreasing height are set against a backdrop of a light gray frame. The image is perfect for presentations, reports, or any visual representation of negative growth, decline, or decrease in data. Suitable for use in business, finance, and educational contexts. Progress decrease vectors Declining Trend Bar Graph. 3D illustration of a bar graph showing a declining trend. Red bars of decreasing height are set against a backdrop of a light gray frame. The image is perfect for presentations, reports, or any visual representation of negative growth, decline, or decrease in data. Suitable for use in business, finance, and educational contexts.
Free with trial A visually striking image capturing a bar chart, line graph, and pie chart meticulously drawn in the wet sand on a beach. The artwork is illuminated by the warm, golden light of a sunset, with gentle waves lapping at the shore. This represents concepts of financial growth, market analysis, and business success in a unique, natural setting. The image evokes themes of planning, progress, and the cyclical nature of markets. Progress decrease illustrations Financial Growth Chart and Pie Chart Drawn in Sand at Sunset. A visually striking image capturing a bar chart, line graph, and pie chart meticulously drawn in the wet sand on a beach. The artwork is illuminated by the warm, golden light of a sunset, with gentle waves lapping at the shore. This represents concepts of financial growth, market analysis, and business success in a unique, natural setting. The image evokes themes of planning, progress, and the cyclical nature of markets.
Free with trial A simple graphic illustration of a bar chart. The chart features four bars of varying heights, indicating growth or progress. The design is clean and minimalist, making it suitable for a wide range of applications such as presentations, reports, and infographics. The black bars stand out against the white background, providing a clear visual representation of data. Progress decrease illustrations Bar Chart Icon. A simple graphic illustration of a bar chart. The chart features four bars of varying heights, indicating growth or progress. The design is clean and minimalist, making it suitable for a wide range of applications such as presentations, reports, and infographics. The black bars stand out against the white background, providing a clear visual representation of data.
Free with trial A collection of hand-drawn, black and white icons representing growth, decline, and financial concepts. The set includes upward and downward arrows, percentage symbols, and a bar graph illustrating trends. The simple line art style makes these icons versatile for various applications, including presentations, infographics, and website design. They convey concepts of progress, success, loss, and market fluctuations. Progress decrease illustrations Growth and Decline Icons Set. A collection of hand-drawn, black and white icons representing growth, decline, and financial concepts. The set includes upward and downward arrows, percentage symbols, and a bar graph illustrating trends. The simple line art style makes these icons versatile for various applications, including presentations, infographics, and website design. They convey concepts of progress, success, loss, and market fluctuations.
Free with trial A 3D illustration of a stack of silver dollar coins with an decrease and increase arrow graph, symbolizing financial growth and success, isolated, png, transparent, clipart, transparent background, cutout, cut-out. Progress decrease vectors A 3D illustration of a stack of golden coins. A 3D illustration of a stack of silver dollar coins with an decrease and increase arrow graph, symbolizing financial growth and success, isolated, png, transparent, clipart, transparent background, cutout, cut-out
Free with trial A 3D illustration of a stack of golden dollar coins with an decrease and increase arrow graph, symbolizing financial growth and success, isolated, png, transparent, clipart, transparent background, cutout, cut-out. Progress decrease vectors A 3D illustration of a stack of golden coins. A 3D illustration of a stack of golden dollar coins with an decrease and increase arrow graph, symbolizing financial growth and success, isolated, png, transparent, clipart, transparent background, cutout, cut-out
Free with trial A simple line graph illustration showing fluctuations and an upward trend. The graph is drawn on a grid with a black line and red data points, indicating a period of increase, followed by a decrease, and then a final increase. This image can be used to represent business trends, financial analysis, stock market data, or any data that shows changes over time. Progress decrease vectors Line Graph with Fluctuations. A simple line graph illustration showing fluctuations and an upward trend. The graph is drawn on a grid with a black line and red data points, indicating a period of increase, followed by a decrease, and then a final increase. This image can be used to represent business trends, financial analysis, stock market data, or any data that shows changes over time.
Free with trial A hand holds a piece of paper with a simple line graph, possibly representing data or a trend, generated by AI. The minimalist design emphasizes the visual simplicity and the concept of data representation. The image could be used to illustrate various concepts related to progress, decline, or chan. Progress decrease illustrations Hand Holding Simple Line Graph. A hand holds a piece of paper with a simple line graph, possibly representing data or a trend, generated by AI. The minimalist design emphasizes the visual simplicity and the concept of data representation. The image could be used to illustrate various concepts related to progress, decline, or chan
Free with trial A graph with a red line and a green line. This could represent a decrease in one variable and an increase in another. Progress decrease illustrations A graph with a red line and a green line
Free with trial A minimalist white 3D bar graph illustrates a significant downward trend. The bars decrease in height from left to right, connected by a dashed line that forms a descending path, culminating in an arrow pointing downwards. The graphic is rendered in an isometric perspective on a white background, representing decline, loss, or negative performance. Progress decrease illustrations White 3D Bar Graph Showing a Downward Trend chart decline. A minimalist white 3D bar graph illustrates a significant downward trend. The bars decrease in height from left to right, connected by a dashed line that forms a descending path, culminating in an arrow pointing downwards. The graphic is rendered in an isometric perspective on a white background, representing decline, loss, or negative performance
Free with trial Responsibility annual report green illustration commitment graph, decrease company, eco friendly responsibility annual report green. Progress decrease illustrations Responsibility annual report green
Free with trial A simple and modern black silhouette icon of a business graph, isolated on a white background. This flat vector illustration combines a bar chart with an overlaid line graph, showing a fluctuating trend with a general decline. The graphic symbolizes concepts such as data analysis, financial reporting, market statistics, economic downturn, and business performance metrics. It's an ideal visual element for presentations, infographics, websites, and applications related to finance, economics, and analytics, representing concepts of decrease, loss, or market volatility. Progress decrease vectors Business Data Analytics Chart Icon. A simple and modern black silhouette icon of a business graph, isolated on a white background. This flat vector illustration combines a bar chart with an overlaid line graph, showing a fluctuating trend with a general decline. The graphic symbolizes concepts such as data analysis, financial reporting, market statistics, economic downturn, and business performance metrics. It's an ideal visual element for presentations, infographics, websites, and applications related to finance, economics, and analytics, representing concepts of decrease, loss, or market volatility.
Free with trial A 3D rendered, vibrant red arrow pointing downwards and to the right, isolated on a transparent background. The arrow has a modern, sleek design. It can be used to represent concepts like decrease, decline, direction, navigation, or a downward trend. The clean background makes it easy to integrate into various designs and projects. Progress decrease illustrations Red Arrow Pointing Down
Free with trial A vibrant, glossy blue arrow curves downwards, indicating a direction or trend. The arrow is rendered in 3D and isolated on a clean white background, emphasizing its shape and reflective surface. This visual element can represent concepts like decline, progress, or a specific path. Progress decrease illustrations Glossy Blue Arrow Curving Downwards on a White Background curved. A vibrant, glossy blue arrow curves downwards, indicating a direction or trend. The arrow is. A vibrant, glossy blue arrow curves downwards, indicating a direction or trend. The arrow is rendered in 3D and isolated on a clean white background, emphasizing its shape and reflective surface. This visual element can represent concepts like decline, progress, or a specific path
Free with trial A versatile set of business and finance icons isolated on a white background. This collection features various data visualization elements, including bar charts, line graphs, pie charts, and diagrams. The clean, vector style represents concepts like statistical analysis, market growth, financial reporting, and economic trends. These infographic elements are perfect for presentations, business reports, websites, and marketing materials to illustrate progress, performance, and data-driven insights. Progress decrease vectors Business and Finance Chart and Graph Icon Set. A versatile set of business and finance icons isolated on a white background. This collection features various data visualization elements, including bar charts, line graphs, pie charts, and diagrams. The clean, vector style represents concepts like statistical analysis, market growth, financial reporting, and economic trends. These infographic elements are perfect for presentations, business reports, websites, and marketing materials to illustrate progress, performance, and data-driven insights.
Free with trial Chart showcasing progress. The last bar stands out as a green arrow, symbolising positive growth. Accompanied by cash, it's a powerful representation of financial success. Progress decrease vectors Financial Growth Chart with Positive Momentum. Chart showcasing progress. The last bar stands out as a green arrow, symbolising positive growth. Accompanied by cash, it's a powerful representation of financial success...
Free with trial This image presents a set of four icons depicting different types of bar charts with upward and downward trends. These icons are commonly used to visually represent growth, decline, progress, and regression in various contexts, such as business, finance, and data analysis. Progress decrease vectors Collection of Growth and Decline Chart Icons. This image presents a set of four icons depicting different types of bar charts with upward and downward trends. These icons are commonly used to visually represent growth, decline, progress, and regression in various contexts, such as business, finance, and data analysis.
Free with trial A clean, minimalist bar chart illustration set against a solid green background. The chart features three white vertical bars of different heights, representing data points or progress over time. A simple white grid and axes are visible, indicating a clear visual representation of statistics. This versatile graphic is ideal for conveying concepts of business growth, financial analysis, market trends, statistical reporting, or educational content in a modern, easy-to-understand format. Perfect for presentations, infographics, websites, and applications. Progress decrease vectors Minimalist Bar Chart Icon on Green Background. A clean, minimalist bar chart illustration set against a solid green background. The chart features three white vertical bars of different heights, representing data points or progress over time. A simple white grid and axes are visible, indicating a clear visual representation of statistics. This versatile graphic is ideal for conveying concepts of business growth, financial analysis, market trends, statistical reporting, or educational content in a modern, easy-to-understand format. Perfect for presentations, infographics, websites, and applications.
Free with trial A bold, stylized arrow rendered in shades of blue with a smooth gradient, curving downwards and to the right. The arrow features a thick black outline, giving it a graphic and modern appearance. Its dynamic shape suggests movement, direction, or a downward trend. This versatile graphic is perfect for illustrating concepts like decline, progress, navigation, or data flow in presentations, websites, and marketing materials. Progress decrease vectors Dynamic Blue Downward Arrow with Gradient Effect. A bold, stylized arrow rendered in shades of blue with a smooth gradient, curving downwards and to the right. The arrow features a thick black outline, giving it a graphic and modern appearance. Its dynamic shape suggests movement, direction, or a downward trend. This versatile graphic is perfect for illustrating concepts like decline, progress, navigation, or data flow in presentations, websites, and marketing materials.
Free with trial A hand-drawn illustration depicting a presentation on data trends. A stick figure presenter, holding a microphone, points to a chart on a screen labeled "DATA TRENDS. " The chart displays a line graph and bar graphs, suggesting growth and analysis. This image is suitable for illustrating business concepts, data analysis, presentations, and financial reports. It conveys a sense of information, communication, and progress. Progress decrease vectors Data Presentation: Business Trends and Analysis. A hand-drawn illustration depicting a presentation on data trends. A stick figure presenter, holding a microphone, points to a chart on a screen labeled "DATA TRENDS." The chart displays a line graph and bar graphs, suggesting growth and analysis. This image is suitable for illustrating business concepts, data analysis, presentations, and financial reports. It conveys a sense of information, communication, and progress.
Free with trial A vibrant illustration showcasing the concept of carbon neutrality through contrasting renewable wind energy and industrial pollution, symbolizing environmental progress. Progress decrease illustrations Visualization of Achieving Carbon Neutrality Goals. A vibrant illustration showcasing the concept of carbon neutrality through contrasting renewable wind energy and industrial pollution, symbolizing environmental progress
Free with trial A minimalist and clean digital illustration of a classic thermometer, featuring a vibrant red liquid column indicating a moderate temperature. Set against a pristine white background, the simple graphic design makes it highly versatile. This clear visual effectively conveys concepts of heat, cold, temperature measurement, and progress. Ideal for use in medical, weather, environmental, or financial contexts, as well as for infographics, apps, and websites needing a precise and universal indicator of status or change. Progress decrease illustrations Simple Red Thermometer Icon on White Background. A minimalist and clean digital illustration of a classic thermometer, featuring a vibrant red liquid column indicating a moderate temperature. Set against a pristine white background, the simple graphic design makes it highly versatile. This clear visual effectively conveys concepts of heat, cold, temperature measurement, and progress. Ideal for use in medical, weather, environmental, or financial contexts, as well as for infographics, apps, and websites needing a precise and universal indicator of status or change.
Free with trial Business growth presentation with charts and graphs showing progress, statistics, and performance. The image showcases key financial indicators in a clear, concise format. Progress decrease vectors Financial Data Analysis Report on Screen Display. Business growth presentation with charts and graphs showing progress, statistics, and performance. The image showcases key financial indicators in a clear, concise format.
Free with trial A striking minimalist geometric design featuring two bold black arrow-like or chevron shapes on a clean white background. The top shape points upwards, while the bottom shape points downwards, separated by a crisp white horizontal band. This abstract symbol creates a sense of direction, movement, and balance. Ideal for use as an icon, logo element, infographic component, or to represent concepts like progress, opposition, flow, or data trends in various design projects, presentations, and digital interfaces. Progress decrease vectors Abstract Black Up and Down Chevron Arrows Symbol. A striking minimalist geometric design featuring two bold black arrow-like or chevron shapes on a clean white background. The top shape points upwards, while the bottom shape points downwards, separated by a crisp white horizontal band. This abstract symbol creates a sense of direction, movement, and balance. Ideal for use as an icon, logo element, infographic component, or to represent concepts like progress, opposition, flow, or data trends in various design projects, presentations, and digital interfaces.
Free with trial A 3D white bar chart shows a significant downward trend indicated by a sharp, angled arrow pointing downwards. The bars decrease in height from left to right, illustrating a concept of decline or loss. The clean white background emphasizes the minimalist design and the stark visual representation of negative growth. Progress decrease illustrations 3D White Bar Chart with Downward Trending Arrow on White Background graph decline. A 3D white bar chart shows a significant downward trend indicated by a sharp, angled arrow pointing downwards. The bars decrease in height from left to right, illustrating a concept of decline or loss. The clean white background emphasizes the minimalist design and the stark visual representation of negative growth
Free with trial A comprehensive collection of hand-drawn arrow symbols presented in a technical blueprint style. This versatile set features numerous white, sketchy arrows with hatching, pointing in various directions�up, down, left, right, curved, and bent. Set against a dark blue textured background, these icons are perfect for illustrating concepts like direction, navigation, progress, flow, and strategy. Ideal for use in infographics, presentations, user interface design, educational materials, flowcharts, and creative projects requiring a draft or sketched aesthetic. Progress decrease illustrations Hand-Drawn Arrow Icons Set on Blueprint Background. A comprehensive collection of hand-drawn arrow symbols presented in a technical blueprint style. This versatile set features numerous white, sketchy arrows with hatching, pointing in various directions�up, down, left, right, curved, and bent. Set against a dark blue textured background, these icons are perfect for illustrating concepts like direction, navigation, progress, flow, and strategy. Ideal for use in infographics, presentations, user interface design, educational materials, flowcharts, and creative projects requiring a draft or sketched aesthetic.
Free with trial A clean and simple vector illustration of a bar chart isolated on a white background. This minimalist graphic features three vertical bars in varying shades of blue, representing data, statistics, or progress. Ideal for business reports, financial presentations, infographics, websites, and educational materials. The flat design symbolizes concepts like growth, analysis, market research, and performance comparison, offering a modern and clear way to visualize information. Ample copy space is available. Progress decrease illustrations Simple Blue Bar Chart Vector Icon for Business Data. A clean and simple vector illustration of a bar chart isolated on a white background. This minimalist graphic features three vertical bars in varying shades of blue, representing data, statistics, or progress. Ideal for business reports, financial presentations, infographics, websites, and educational materials. The flat design symbolizes concepts like growth, analysis, market research, and performance comparison, offering a modern and clear way to visualize information. Ample copy space is available.
Free with trial This abstract 3D rendered image showcases three prominent white candlestick-like objects, symbolizing financial growth and market trends. Positioned against a dark, gridded background, a subtle financial chart with smaller red and white candlesticks and wicks extends into the distance, reinforcing the theme of data analysis and investment. The clean, modern aesthetic makes it ideal for illustrating concepts related to stock market performance, cryptocurrency trading, economic growth, financial planning, and digital business strategies. It effectively conveys ideas of progress, success, and the dynamic nature of global markets. Progress decrease illustrations 3D Financial Candlestick Chart Representing Market Growth. This abstract 3D rendered image showcases three prominent white candlestick-like objects, symbolizing financial growth and market trends. Positioned against a dark, gridded background, a subtle financial chart with smaller red and white candlesticks and wicks extends into the distance, reinforcing the theme of data analysis and investment. The clean, modern aesthetic makes it ideal for illustrating concepts related to stock market performance, cryptocurrency trading, economic growth, financial planning, and digital business strategies. It effectively conveys ideas of progress, success, and the dynamic nature of global markets.
Free with trial Angled downward arrow with jagged design suggests a declining trend in metallic tones against a clean background Great for illustrating concepts of decrease and downturn. Progress decrease illustrations Downward Arrow Graphic Showing Zigzag Trend on White. Angled downward arrow with jagged design suggests a declining trend in metallic tones against a clean background Great for illustrating concepts of decrease and downturn
Free with trial A vivid red zig-zag arrow illustrates a downward trend, symbolizing financial decline, market volatility, or negative progress. This versatile graphic is perfect for business and finance presentations. Progress decrease vectors Red zig zag arrow isolated on transparent background transparent background. A vivid red zig-zag arrow illustrates a downward trend, symbolizing financial decline, market volatility, or negative progress. This versatile graphic is perfect for business and finance presentations
Free with trial This image features a simple, bold black down arrow icon, perfect for indicating downloads, progress, or direction. The clean design is versatile for website design, mobile apps, and user interfaces. Progress decrease vectors Bold Black Down Arrow Icon Simple, Clean Download Sign. This image features a simple, bold black down arrow icon, perfect for indicating downloads, progress, or direction. The clean design is versatile for website design, mobile apps, and user interfaces.
Free with trial Chart showing downward trend with red nodes, sad face, recovery checkmark, warning alerts, and webpage visuals. Ideal for finance, business, analysis, recovery strategy monitoring evaluation. Progress decrease illustrations Negative Market Trends and Analytics with Recovery Progress Indicators. Chart showing downward trend with red nodes, sad face, recovery checkmark, warning alerts, and webpage visuals. Ideal for finance, business, analysis, recovery strategy monitoring evaluation
Free with trial A blackboard with a graph on it and a potted plant next to it. The graph shows a downward trend, which could represent a decrease in sales or a decline in a particular stock. Progress decrease illustrations A blackboard with a graph on it and a potted plant next to it
Free with trial Download progress, time running out, sand flowing downward. Simple, clean vector icon. Progress decrease vectors Hourglass Icon Downloading Process, Time Management Symbol. Download progress, time running out, sand flowing downward. Simple, clean vector icon.
Free with trial This 3D rendered bar graph, generated by AI, visually represents a downward trend. The red bars progressively decrease in height, illustrating a clear decline. Perfect for illustrating concepts related to loss, decrease, or decline in presentations and reports. Progress decrease illustrations Declining Bar Graph. This 3D rendered bar graph, generated by AI, visually represents a downward trend. The red bars progressively decrease in height, illustrating a clear decline. Perfect for illustrating concepts related to loss, decrease, or decline in presentations and reports.
Free with trial Description: A 3D rendering of a businessman figure presenting a bar chart showing upward growth trend on a whiteboard. The chart illustrates business success and progress. Progress decrease illustrations Businessman Presenting Positive Growth Chart on Whiteboard. Description: A 3D rendering of a businessman figure presenting a bar chart showing upward growth trend on a whiteboard. The chart illustrates business success and progress.
Free with trial Calculator alongside arrows indicating increase and decrease, and a line graph with fluctuations. Ideal for finance, budgeting, economics, analysis, statistics, decision-making, simple flat metaphor. Progress decrease illustrations Calculator with Arrows and Graph Representing Financial Analysis and Data Trends. Calculator alongside arrows indicating increase and decrease, and a line graph with fluctuations. Ideal for finance, budgeting, economics, analysis, statistics, decision-making, simple flat metaphor
Free with trial Thermometer and falling bar chart with a directional arrow symbolizing temperature drop, analysis, and reduction. Ideal for climate change, trends, progress, energy, analytics, business metrics. Progress decrease illustrations Thermometer and Declining Bar Chart Representing Cooling Trends and Data Insights. Thermometer and falling bar chart with a directional arrow symbolizing temperature drop, analysis, and reduction. Ideal for climate change, trends, progress, energy, analytics, business metrics
Free with trial Chart with downward trend, sad face indicating negative results, user profile photo with verification checkmark. Ideal for performance, feedback, user analytics, identity, emotions, progress. Progress decrease illustrations Declining Performance Chart with Sad Face and User Profile Verification Concept. Chart with downward trend, sad face indicating negative results, user profile photo with verification checkmark. Ideal for performance, feedback, user analytics, identity, emotions, progress
Free with trial Vibrant 3D render of a glowing neon blue gauge with up and down arrows on a bright green background. Symbolizing progress, change, data, or status measurement. Progress decrease illustrations Glowing Neon Blue Gauge with Up and Down Arrows on Vibrant Green. Vibrant 3D render of a glowing neon blue gauge with up and down arrows on a bright green background. Symbolizing progress, change, data, or status measurement
Free with trial A single, glossy green arrow points directly downwards. The arrow has a rounded, smooth appearance and is rendered in 3D. It is presented on a clean white background, making it stand out as a distinct icon or symbol. The image is simple and direct, conveying a sense of direction or decrease. Progress decrease illustrations Glossy Green Downward Arrow Icon on White Background image photo. A single, glossy green arrow points directly downwards. The arrow has a rounded, smooth appearance and is rendered in 3D. It is presented on a clean white background, making it stand out as a distinct icon or symbol. The image is simple and direct, conveying a sense of direction or decrease
Free with trial Simple Set of Increase and Decrease Related Vector Art on a white background" features a clean and minimalist collection of icons representing growth, decline, progress, and reduction. The set includes arrows, charts, and symbols with sleek, solid designs, making it ideal for business, finance, or analytical presentations. These versatile and visually straightforward icons are perfect for conveying trends and changes with clarity and professionalism. Progress decrease vectors Simple Set of Increase and Decrease Related Vector art on white background. Simple Set of Increase and Decrease Related Vector Art on a white background" features a clean and minimalist collection of icons representing growth, decline, progress, and reduction. The set includes arrows, charts, and symbols with sleek, solid designs, making it ideal for business, finance, or analytical presentations. These versatile and visually straightforward icons are perfect for conveying trends and changes with clarity and professionalism.
Free with trial A vibrant glossy red arrow curves downwards, symbolizing a negative trend, decline, or reduction. This eye-catching graphic is perfect for presentations and reports illustrating falling data or negative performance. Progress decrease illustrations Glossy red downward arrow graphic sign indicating trend decline or decrease white background. A vibrant glossy red arrow curves downwards, symbolizing a negative trend, decline, or reduction. This eye-catching graphic is perfect for presentations and reports illustrating falling data or negative performance
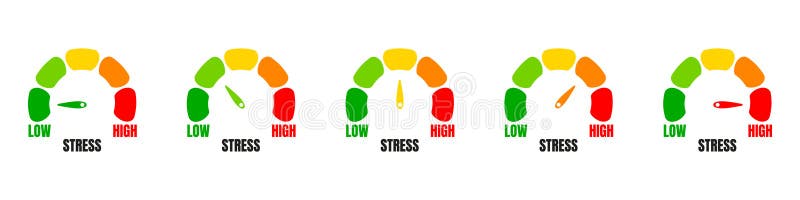
Free with trial Stress level meter, progress bar gauge isolated over white background, stress meter vector medical illustration. vector. Progress decrease vectors Stress level meter, progress bar gauge isolated over white background, stress meter vector medical illustration
Free with trial A thick, solid black arrow points directly downwards against a stark white background. The arrow is a simple, bold graphic element, clearly indicating direction or a downward action. It is isolated, making it a versatile symbol for navigation, selection, or indicating a decrease. Progress decrease illustrations Bold Black Downward Arrow Icon on White Background direction symbol. A thick, solid black arrow points directly downwards against a stark white background. The arrow is a simple, bold graphic element, clearly indicating direction or a downward action. It is isolated, making it a versatile symbol for navigation, selection, or indicating a decrease
Free with trial Bar chart with upward trend, sad face, and analytics dashboard highlights challenges in progress or data performance. Ideal for financial difficulty, business risk, loss assessment, data analysis. Progress decrease vectors Rising Bar Graph with Sad Face Symbolizing Negative Growth or Challenges in Analytics. Bar chart with upward trend, sad face, and analytics dashboard highlights challenges in progress or data performance. Ideal for financial difficulty, business risk, loss assessment, data analysis
Free with trial A minimalist graphic depicting a bar chart with falling bars and a downward-pointing arrow, symbolizing a negative trend, economic downturn, or performance decline. Clean and clear representation of loss. Progress decrease illustrations Simple downward trend bar chart icon indicating decline or decrease. A minimalist graphic depicting a bar chart with falling bars and a downward-pointing arrow, symbolizing a negative trend, economic downturn, or performance decline. Clean and clear representation of loss
Free with trial Visualize impactful data with this dynamic water intensity graph, showcasing a strong downward trend over time. Perfect for illustrating progress in conservation and efficiency. Progress decrease vectors Dramatic water graph visually represents declining water intensity over time, showing efficiency gains. Visualize impactful data with this dynamic water intensity graph, showcasing a strong downward trend over time. Perfect for illustrating progress in conservation and efficiency
Free with trial Up Down Accend Decend Increase Decrease Arrow Pointer Point Path Elevator Lift Rise Drop Black White Icon Sign Symbol Graphic Illustration Vector. Progress decrease vectors Up Down Accend Decend Increase Decrease Arrow Pointer Point Path Elevator Lift Rise Drop Black White Icon Sign Symbol Graphic Illu
Free with trial A visual representation of data showing a decline over a period. The blue bars are arranged in descending order of height, each marked with numerical indicators, suggesting a decrease in value or quantity. Progress decrease illustrations Blue bar chart showing decreasing trend over time with numerical labels. A visual representation of data showing a decline over a period. The blue bars are arranged in descending order of height, each marked with numerical indicators, suggesting a decrease in value or quantity
Free with trial Up and down arrows with digital dashboard and analytics graph. Ideal for workflow, analysis, progress monitoring, performance, business strategy, reporting, simple flat metaphor. Progress decrease vectors Data Analysis with Interactive Dashboard, Graphs, and Performance Trends in Business Workflow. Up and down arrows with digital dashboard and analytics graph. Ideal for workflow, analysis, progress monitoring, performance, business strategy, reporting, simple flat metaphor
Free with trial A vibrant red arrow gracefully curves downwards, clearly indicating a directional change or a downward trend. Its glossy finish suggests movement and highlights its prominent form. Progress decrease illustrations Bright red arrow curving downward indicating direction or trend decrease. A vibrant red arrow gracefully curves downwards, clearly indicating a directional change or a downward trend. Its glossy finish suggests movement and highlights its prominent form
Free with trial A bold red arrow curves downwards and points to the right, clearly symbolizing a trend of falling prices, negative growth, or a decline in performance. Ideal for financial or business contexts. Progress decrease illustrations Bright red downward arrow symbol indicating decline or decrease on white. A bold red arrow curves downwards and points to the right, clearly symbolizing a trend of falling prices, negative growth, or a decline in performance. Ideal for financial or business contexts
Free with trial This image captures a conceptual business planning session, suggesting a focus on market trend analysis, charting of progress and addressing potential declines. Progress decrease illustrations Conceptual business strategy session with downward trend and coffee break. This image captures a conceptual business planning session, suggesting a focus on market trend analysis, charting of progress and addressing potential declines
Free with trial A vibrant red arrow curves downward, signifying a decrease, negative trend, or direction towards lower values. Ideal for financial reports, data visualization, or indicating a downward path. Progress decrease illustrations Bright red downward curved arrow symbol indicating decline or trend vector. A vibrant red arrow curves downward, signifying a decrease, negative trend, or direction towards lower values. Ideal for financial reports, data visualization, or indicating a downward path
Free with trial Profit increase and decrease graph, coin icon. Progress decrease vectors Profit increase and decrease graph
Free with trial Profit increase and decrease graph, coin icon. Progress decrease vectors Profit increase and decrease graph
Free with trial Profit increase and decrease graph, coin icon. Progress decrease vectors Profit increase and decrease graph
Free with trial Profit increase and decrease graph, coin icon. Progress decrease vectors Profit increase and decrease graph
Free with trial Profit increase and decrease graph, coin icon. Progress decrease vectors Profit increase and decrease graph
Free with trial Profit increase and decrease graph, coin icon. Progress decrease vectors Profit increase and decrease graph
Free with trial Modern rendered line graph with yellow marker points rising and falling vertically, forming a white trend line that fluctuates across the screen. The graph represents business data such as growth, decrease, profit, and market performance. Set against a blurred office background, the image has a clean, digital aesthetic ideal for financial presentations, company reports, startup pitches, and data analysis. This visual is suitable for showcasing trading performance, corporate strategy, and economic trends. Progress decrease illustrations Business Trend Line Graph Showing Growth and Market Fluctuations. Modern rendered line graph with yellow marker points rising and falling vertically, forming a white trend line that fluctuates across the screen. The graph represents business data such as growth, decrease, profit, and market performance. Set against a blurred office background, the image has a clean, digital aesthetic ideal for financial presentations, company reports, startup pitches, and data analysis. This visual is suitable for showcasing trading performance, corporate strategy, and economic trends.
Free with trial A 3D illustration featuring a bar chart with four ascending blue bars of varying heights, representing data growth. To the right of the chart are two white arrows, one pointing upwards and the other downwards, symbolizing increase and decrease respectively. The entire graphic is presented on a clean white background. Progress decrease illustrations 3D Bar Chart with Up and Down Arrows on White Background graph statistics. A 3D illustration featuring a bar chart with four ascending blue bars of varying heights, representing data growth. To the right of the chart are two white arrows, one pointing upwards and the other downwards, symbolizing increase and decrease respectively. The entire graphic is presented on a clean white background
Free with trial A hand uses a stylus to draw a glowing bar graph. The graph illustrates increasing income and decreasing expenses, symbolizing financial management and growth. Progress decrease illustrations Hand drawing a financial graph showing income growth and expense decrease. A hand uses a stylus to draw a glowing bar graph. The graph illustrates increasing income and decreasing expenses, symbolizing financial management and growth
Free with trial A person's open palm supports a glowing blue graph illustrating a downward trend for cost and an upward trend for quality against a dark background. Progress decrease illustrations Hand holding graph showing decreasing cost and increasing quality decrease. A person's open palm supports a glowing blue graph illustrating a downward trend for cost and an upward trend for quality against a dark background
Free with trial Elevate your everyday style with Abu Taher's collection of Typography T-Shirt Designs, where words meet artistry. Progress decrease vectors Collection of 32 icons representing increase and decrease in business and finance. Elevate your everyday style with Abu Taher's collection of Typography T-Shirt Designs, where words meet artistry
Free with trial A bright cyan arrow is depicted pointing directly downwards against a plain, light gray background. The arrow has a clean, geometric design with a sharp point and a wide shaft. The 3D rendering gives it a solid, dimensional appearance, casting a subtle shadow on the surface below. This simple yet impactful graphic conveys a sense of direction, decrease, or a downward trend. Progress decrease illustrations Bright Cyan Arrow Pointing Downward Against a Light Gray Background direction. A bright cyan arrow is depicted pointing directly downwards against a plain, light gray background. The arrow has a clean, geometric design with a sharp point and a wide shaft. The 3D rendering gives it a solid, dimensional appearance, casting a subtle shadow on the surface below. This simple yet impactful graphic conveys a sense of direction, decrease, or a downward trend
Free with trial A 3D rendered illustration featuring a bright blue arrow pointing upwards and a vibrant red arrow pointing downwards, positioned side-by-side on a plain white background. The arrows are smooth and rounded, symbolizing concepts of increase and decrease, or positive and negative movement. Progress decrease illustrations 3D Rendered Blue Up Arrow and Red Down Arrow on White Background direction movement. A 3D rendered illustration featuring a bright blue arrow pointing upwards and a vibrant red arrow pointing downwards, positioned side-by-side on a plain white background. The arrows are smooth and rounded, symbolizing concepts of increase and decrease, or positive and negative movement