Free with trial Sad face symbolizing dissatisfaction or issues, with data point focus and declining performance graph. Ideal for business analytics, performance drops, feedback, emotions, troubleshooting, reporting. Progress decrease illustrations Sad face with declining graph and focus on data highlighting underperformance and issues. Sad face symbolizing dissatisfaction or issues, with data point focus and declining performance graph. Ideal for business analytics, performance drops, feedback, emotions, troubleshooting, reporting
Free with trial Up and down arrow on bar chart icon set. Growth and decline graph symbol illustration. Financial trend concept. Progress decrease vectors Up and down arrow on bar chart icon set. Growth and decline graph symbol. Financial trend concept
Free with trial A striking 3D rendering features an abstract bar graph composed of numerous translucent blue rectangular blocks against a dark, almost black, background. The varying heights of the blocks create a dynamic visual representation of data, statistics, or growth trends. This modern and futuristic design is ideal for illustrating concepts related to business, finance, technology, analytics, market research, or digital information in presentations, reports, websites, and corporate media. Progress decrease illustrations Abstract 3D Blue Bar Graph Visualization. A striking 3D rendering features an abstract bar graph composed of numerous translucent blue rectangular blocks against a dark, almost black, background. The varying heights of the blocks create a dynamic visual representation of data, statistics, or growth trends. This modern and futuristic design is ideal for illustrating concepts related to business, finance, technology, analytics, market research, or digital information in presentations, reports, websites, and corporate media.
Free with trial A sharp, blue glass arrow points directly downwards against a stark white background. The arrow is rendered in 3D with faceted edges that catch and reflect light, giving it a crystalline appearance. Its transparent quality and clear blue hue suggest a modern and precise directional symbol. Progress decrease illustrations Blue Glass Arrow Pointing Downward on White Background downward arrow blue arrow. A sharp, blue glass arrow points directly downwards against a stark white background. The arrow is rendered in 3D with faceted edges that catch and reflect light, giving it a crystalline appearance. Its transparent quality and clear blue hue suggest a modern and precise directional symbol
Free with trial Colorful line graph illustrating growth and decline over time, with variously colored data points on a dark background, visualizing financial performance and trends. Progress decrease vectors Colorful line graph illustrating growth and decline over time, with variously colored data points on a dark background
Free with trial Growth and decline arrow graph icon. Up and down arrows symbol illustration. Progress decrease vectors Growth and decline arrow graph icon. Up and down arrows symbol
Free with trial Illustration displays a black graph showing a downward trend indicated by a graph, arrow, and clock symbol on a stark white background, implying a sense of failure and loss. Progress decrease vectors Black Symbol Graph Downtrend with Time on White Backdrop Shows Decline. Illustration displays a black graph showing a downward trend indicated by a graph, arrow, and clock symbol on a stark white background, implying a sense of failure and loss.
Free with trial This infographic-style image visually represents business growth and financial performance through various charts and graphs. A line graph illustrates revenue trends with percentage markers, a donut chart displays market share distribution, and a bar chart shows quarterly profit figures. Icons representing data, growth, and reports are subtly integrated into the background, creating a professional and informative visual for business and finance-related content. Progress decrease illustrations Business Growth and Financial Performance Analytics. This infographic-style image visually represents business growth and financial performance through various charts and graphs. A line graph illustrates revenue trends with percentage markers, a donut chart displays market share distribution, and a bar chart shows quarterly profit figures. Icons representing data, growth, and reports are subtly integrated into the background, creating a professional and informative visual for business and finance-related content.
Free with trial A visual representation of opposing forces, illustrating concepts such as growth versus decline, positive versus negative trends, or upward and downward movement in various contexts like finance or pe. Progress decrease illustrations Red down arrow and green up arrow isolated on white background. A visual representation of opposing forces, illustrating concepts such as growth versus decline, positive versus negative trends, or upward and downward movement in various contexts like finance or pe
Free with trial This image showcases a collection of finance and government icons, generated by AI, perfect for use in presentations, reports, or websites related to business, economics, or politics. The stylized monochrome design provides a professional and consistent aesthetic. Progress decrease illustrations Finance and Government Icons
Free with trial Business Team Meeting with Feedback and Communication in Office Setting. Determined businessman pulling the needle on a multicolored gauge scale. Businessman wearing a cape stands atop a cliff. Progress decrease vectors Best user experience concept. Decrease stress anxiety meter. Leadership mission. Business Team Meeting with Feedback and Communication in Office Setting. Determined businessman pulling the needle on a multicolored gauge scale. Businessman wearing a cape stands atop a cliff.
Free with trial Horizontal scale ranging from minus to plus is indicating volume control, measurement, performance, or value on a blue background. 3D render. Progress decrease illustrations Horizontal colorful scale showing measurement on blue background. Horizontal scale ranging from minus to plus is indicating volume control, measurement, performance, or value on a blue background. 3D render
Free with trial Falling trend sketch of business finance graph with bar charts and arrow. Progress decrease illustrations Falling trend sketch of business finance graph with bar charts and arrow
Free with trial Energy Crisis icon set. Market Manipulation, Fluctuations, Shortages, Industry, Government, Fuel, Accidents. Duotone color solid icons. Progress decrease illustrations Energy Crisis solid icon set. Energy Crisis icon set. Market Manipulation, Fluctuations, Shortages, Industry, Government, Fuel, Accidents. Duotone color solid icons
Free with trial White Bar Graph Decreasing on Light Blue Background. Progress decrease illustrations White Bar Graph Decreasing on Light Blue Background
Free with trial Simple line graph illustrating data points and trends. Ideal for presentations, reports, and infographics related to business analysis, market research, or financial reporting. Progress decrease vectors Simple Line Graph, Data Visualization, Business Chart. Simple line graph illustrating data points and trends. Ideal for presentations, reports, and infographics related to business analysis, market research, or financial reporting.
Free with trial A stacked area chart performance data with distinct colored segments in a rainbow gradient. The vertical axis percentages from 0% to 170%, and the horizontal axis percentage values. Progress decrease illustrations Stacked area chart showing level performance with rainbow colors and percentage axis graph data. A stacked area chart performance data with distinct colored segments in a rainbow gradient. The vertical axis percentages from 0% to 170%, and the horizontal axis percentage values
Free with trial This image showcases vibrant 3D bar and line charts, generated by AI, offering a dynamic visual representation of business data. The colorful design effectively communicates trends and comparisons across multiple data sets, providing a clear and engaging overview of key performance indicators. Progress decrease illustrations AI-Generated 3D Business Charts. This image showcases vibrant 3D bar and line charts, generated by AI, offering a dynamic visual representation of business data. The colorful design effectively communicates trends and comparisons across multiple data sets, providing a clear and engaging overview of key performance indicators.
Free with trial A vibrant collection of hand-drawn business charts and graphs, rendered in blue tones. The set includes various types of visualizations like bar charts, line graphs, and a pie chart, all with a sketchy, illustrative style. These visuals are ideal for presentations, reports, and infographics related to finance, data analysis, growth, and business performance. Progress decrease illustrations Hand-Drawn Business Charts and Graphs Collection. A vibrant collection of hand-drawn business charts and graphs, rendered in blue tones. The set includes various types of visualizations like bar charts, line graphs, and a pie chart, all with a sketchy, illustrative style. These visuals are ideal for presentations, reports, and infographics related to finance, data analysis, growth, and business performance.
Free with trial Analyze Data with Graphs on Tablet, Business Growth Concept and Wood Background , subtle gradient. Progress decrease illustrations Analyze Data with Graphs on Tablet, Business Growth Concept and Wood Background
Free with trial This image features a set of up and down arrows in three color variations (black, red, and a gradient from red to blue). Progress decrease vectors Up and Down Arrows in Black, Red, and Blue. This image features a set of up and down arrows in three color variations (black, red, and a gradient from red to blue).
Free with trial A futuristic visualization depicts data analysis, charts, and graphs within a digital, high-tech environment. Progress decrease illustrations Complex data analysis illustrated within an abstract futuristic environment. A futuristic visualization depicts data analysis, charts, and graphs within a digital, high-tech environment
Free with trial Abstract 3D Bar Chart Showing Data Growth. Progress decrease illustrations Abstract 3D Bar Chart Showing Data Growth
Free with trial 3d bar chart with orange and green bars on a blue grid background isolated on white. Progress decrease illustrations 3d bar chart with orange and green bars on blue grid background graph data. 3d bar chart with orange and green bars on a blue grid background isolated on white
Free with trial A glossy red arrow curves downwards, symbolizing a decrease or negative progression. This striking visual effectively communicates concepts of falling, loss, or a downward trend in a clear and impactful manner. Progress decrease illustrations Dynamic red arrow points downward indicating decline loss or negative trend. A glossy red arrow curves downwards, symbolizing a decrease or negative progression. This striking visual effectively communicates concepts of falling, loss, or a downward trend in a clear and impactful manner
Free with trial Modern smartphone displaying financial data generative ai image. Progress decrease illustrations Modern smartphone displaying financial data
Free with trial This 3D rendering showcases stacks of Bitcoin-like coins alongside a rising bar graph, illustrating cryptocurrency market growth. The image is generated by AI and ideal for illustrating financial concepts related to digital currencies. Progress decrease illustrations Cryptocurrency Growth Chart. This 3D rendering showcases stacks of Bitcoin-like coins alongside a rising bar graph, illustrating cryptocurrency market growth. The image is generated by AI and ideal for illustrating financial concepts related to digital currencies.
Free with trial Colorful bar graph with stacked segments illustrating growth and data analysis. Progress decrease vectors Colorful bar graph with stacked segments illustrating growth and data analysis
Free with trial Rate showing extensive set of dark gray illustrating financial graphs charts and data analysis symbols keywords: financial, graphs, charts, data. Progress decrease illustrations Extensive Set of Dark Gray Illustrating Financial Graphs Charts and Data Analysis Symbols Keywords: financial
Free with trial A conceptual image depicting a factory with a downward trending graph, symbolizing a decline in production or industrial recession. The image uses a paper craft style, showing hands interacting with the elements. Ideal for illustrating economic downturn, manufacturing challenges, or automation impact on jobs. The dark smoke adds a visual element of pollution. Progress decrease illustrations Factory Production Decline: Industrial Recession Concept. A conceptual image depicting a factory with a downward trending graph, symbolizing a decline in production or industrial recession. The image uses a paper craft style, showing hands interacting with the elements. Ideal for illustrating economic downturn, manufacturing challenges, or automation impact on jobs. The dark smoke adds a visual element of pollution.
Free with trial View of Graphs showing declining CO₂ emissions. Progress decrease illustrations Graphs showing declining COâ‚‚ emissions. View of Graphs showing declining CO₂ emissions
Free with trial Business decline, Businessman examines decreasing bar graph and chart. Progress decrease vectors Business decline, Businessman examines decreasing bar graph and chart
Free with trial A colorful bar graph with a line graph overlayed on a blue background. it shows data trends and market analysis in a simple visual format. Progress decrease vectors Colorful bar graph with a line graph on a blue background. a colorful bar graph with a line graph overlayed on a blue background. it shows data trends and market analysis in a simple visual format
Free with trial Four black arrows, all pointing downwards, are evenly spaced and aligned diagonally across a white background. Each arrow consists of a long, straight shaft and a triangular arrowhead. The simplistic and bold design suggests movement or direction. Progress decrease vectors The four black arrows directed down isolated on white background. Four black arrows, all pointing downwards, are evenly spaced and aligned diagonally across a white background. Each arrow consists of a long, straight shaft and a triangular arrowhead. The simplistic and bold design suggests movement or direction.
Free with trial The image features the word "TECHNOLOGY" in white, centered on a dark blue background. To the left, a design element composed of gradient circles transitions from cyan to magenta, forming a partial circular shape reminiscent of a signal or network icon. The circles decrease in size as they move outward, adding a dynamic visual effect that suggests connectivity and modernity, typical of tech-related themes. This design aligns with web and digital branding aesthetics. Progress decrease vectors Modern Technology Wi Fi Logo Design for Internet, Networking and Digital Communication Brand Identity. The image features the word "TECHNOLOGY" in white, centered on a dark blue background. To the left, a design element composed of gradient circles transitions from cyan to magenta, forming a partial circular shape reminiscent of a signal or network icon. The circles decrease in size as they move outward, adding a dynamic visual effect that suggests connectivity and modernity, typical of tech-related themes. This design aligns with web and digital branding aesthetics.
Free with trial An isometric view of a bar chart with five blue bars of decreasing height, representing a downward trend. A red arrow points downwards, indicating a negative trajectory. Progress decrease illustrations Bar chart showing a downward trend with a red arrow isolated on white background. An isometric view of a bar chart with five blue bars of decreasing height, representing a downward trend. A red arrow points downwards, indicating a negative trajectory
Free with trial This image depicts a house with a rising stock market graph overlay on a green lawn, symbolizing growth and prosperity in the real estate and financial markets. The graph shows a mix of green and red lines, indicating fluctuations in the market, but overall trending upwards. The image conveys a sense of optimism and hope for the future. Progress decrease illustrations A house with a rising stock market graph overlay on a green lawn. This image depicts a house with a rising stock market graph overlay on a green lawn. This image depicts a house with a rising stock market graph overlay on a green lawn, symbolizing growth and prosperity in the real estate and financial markets. The graph shows a mix of green and red lines, indicating fluctuations in the market, but overall trending upwards. The image conveys a sense of optimism and hope for the future.
Free with trial Stacked chevron arrows inside a circular refresh loop, modern design illustration. Progress decrease vectors Stacked chevron arrows inside a circular refresh loop, modern design illustration
Free with trial A businesswoman presents data graphs and charts on a whiteboard during a meeting in a modern office setting. The scene is minimalist and uses a dark blue color palette, emphasizing the data visualization. The image depicts a professional work environment. Progress decrease illustrations Businesswoman Giving Presentation. A businesswoman presents data graphs and charts on a whiteboard during a meeting in a modern office setting. The scene is minimalist and uses a dark blue color palette, emphasizing the data visualization. The image depicts a professional work environment.
Free with trial Bar graph with declining values, percentage on black square, globe in blue square. Ideal for data, statistics, global business, market trends, finance, analysis research flat simple metaphor. Progress decrease vectors Bar chart with decreasing bars alongside percentage and globe icons for data and global analytics. Bar graph with declining values, percentage on black square, globe in blue square. Ideal for data, statistics, global business, market trends, finance, analysis research flat simple metaphor
Free with trial This image shows two bar graphs. One shows an upward trend with an arrow pointing up. The other shows a downward trend with an arrow pointing down. Black and white. Progress decrease illustrations Black and white illustration showing upward and downward trending bar graphs with arrows pointing up down. This image shows two bar graphs. One shows an upward trend with an arrow pointing up. The other shows a downward trend with an arrow pointing down. Black and white.
Free with trial A bold, black, hand-drawn arrow pointing downwards, rendered with a distinctive brush stroke texture. The grunge-style design gives it an artistic and authentic feel, isolated against a clean white background. This versatile vector element is perfect for indicating direction, downloads, navigation, or emphasizing a point in web design, mobile applications, presentations, or various creative projects requiring a rustic or handmade aesthetic. Its simplicity ensures clear communication. Progress decrease vectors Black Brush Stroke Down Arrow Icon. A bold, black, hand-drawn arrow pointing downwards, rendered with a distinctive brush stroke texture. The grunge-style design gives it an artistic and authentic feel, isolated against a clean white background. This versatile vector element is perfect for indicating direction, downloads, navigation, or emphasizing a point in web design, mobile applications, presentations, or various creative projects requiring a rustic or handmade aesthetic. Its simplicity ensures clear communication.
Free with trial Hand-drawn financial charts, graphs, and calculators perfect for business, finance, and accounting illustrations. These vector illustrations depict various tools used for data analysis and financial calculations. Progress decrease vectors Collection of Hand Drawn Financial Charts and Calculators. Hand-drawn financial charts, graphs, and calculators perfect for business, finance, and accounting illustrations. These vector illustrations depict various tools used for data analysis and financial calculations.
Free with trial A neon glowing graph with blue bars and pink zigzag arrow showing fluctuating growth on black background. Generative AI. Progress decrease illustrations Neon glowing graph with blue bars and pink zigzag arrow showing fluctuating growth on black background
Free with trial A clear image featuring a green circle with a white upward arrow and a red circle with a white downward arrow, presented isolated on a clean white background. Progress decrease illustrations Green up arrow and red down arrow symbols isolated on white background. A clear image featuring a green circle with a white upward arrow and a red circle with a white downward arrow, presented isolated on a clean white background
Free with trial This image features two minimalist icons representing financial or data trends. The left icon is a white line graph with circular data points and directional arrows, set against a solid black shield shape. The right icon presents the same line graph and data points within a black outline of a shield, on a white background. Both icons depict fluctuating data, with one showing a downward trend and the other an upward trend, symbolizing market volatility, analysis, and security. Progress decrease illustrations Line Graph Icon with Shield Symbol - Upward and Downward Trends. This image features two minimalist icons representing financial or data trends. The left icon is a white line graph with circular data points and directional arrows, set against a solid black shield shape. The right icon presents the same line graph and data points within a black outline of a shield, on a white background. Both icons depict fluctuating data, with one showing a downward trend and the other an upward trend, symbolizing market volatility, analysis, and security.
Free with trial Two three-dimensional arrows pointing downwards are presented against a white background. The arrow on the left is bright green, while the arrow on the right is a vibrant red. Both arrows have a highly polished, glossy surface, reflecting light. The arrows are positioned slightly overlapping, creating a sense of movement or comparison. The overall style is clean and simple, suitable for use as. Progress decrease illustrations 3 D Green and Red Down Arrows Shiny Glossy Icons 3d arrow. Two three-dimensional arrows pointing downwards are presented against a white background. The arrow on the left is bright green, while the arrow on the right is a vibrant red. Both arrows have a highly polished, glossy surface, reflecting light. The arrows are positioned slightly overlapping, creating a sense of movement or comparison. The overall style is clean and simple, suitable for use as
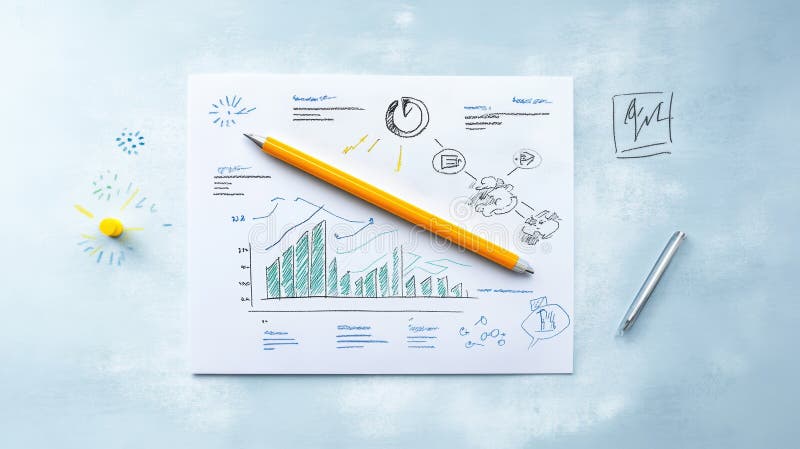
Free with trial Graph depiction on paper with a pencil ,Generative ai. Progress decrease illustrations Pencil and paper, a detailed illustration of graph for data analysis visualization. Graph depiction on paper with a pencil ,Generative ai
Free with trial Downward trend graph with large sad face and woman in casual attire. Ideal for business performance, feedback, failure, regret, decisions, emotions, analytics. Clean simple flat metaphor. Progress decrease vectors Declining Trend Graph with Sad Face and Casual Woman Highlighting Failure or Negative Feedback. Downward trend graph with large sad face and woman in casual attire. Ideal for business performance, feedback, failure, regret, decisions, emotions, analytics. Clean simple flat metaphor
Free with trial Businessman hand on head and looks up to a downward trending arrow chart. Progress decrease illustrations Businessman hand on head and looks up to a downward trending arrow chart
Free with trial A minimalist cartoon-style illustration on a white background depicts a green horseshoe-shaped symbol on the left with two arrows pointing toward it, one green arrow entering from the left and a larger red arrow exiting to the right, pointing downward to signify a decreasing trend in cancer diagnoses, while a second red arrow points upward, creating a contrast that visually communicates changing. Progress decrease illustrations Cancer diagnosis decline concept with arrows and horseshoe shape. A minimalist cartoon-style illustration on a white background depicts a green horseshoe-shaped symbol on the left with two arrows pointing toward it, one green arrow entering from the left and a larger red arrow exiting to the right, pointing downward to signify a decreasing trend in cancer diagnoses, while a second red arrow points upward, creating a contrast that visually communicates changing
Free with trial A conceptual vector illustration depicting business analysis and market research. A hand holds a magnifying glass, focusing on a colorful financial chart with bar and line graphs labeled 'Market Trends'. Surrounding icons represent key business metrics like growth, decline, market share, and innovation. This flat design graphic is ideal for presentations, reports, and web content related to data analytics, strategic planning, and financial performance evaluation, symbolizing the scrutiny of data to identify opportunities and understand market dynamics. Progress decrease illustrations Business Analysis and Market Trends Concept with Magnifying Glass. A conceptual vector illustration depicting business analysis and market research. A hand holds a magnifying glass, focusing on a colorful financial chart with bar and line graphs labeled 'Market Trends'. Surrounding icons represent key business metrics like growth, decline, market share, and innovation. This flat design graphic is ideal for presentations, reports, and web content related to data analytics, strategic planning, and financial performance evaluation, symbolizing the scrutiny of data to identify opportunities and understand market dynamics.
Free with trial Visualize cost reduction strategies with this image. A finger touches a glowing hexagon icon with "cost reduction" text, representing business finance and savings. Ideal for corporate presentations on management. Progress decrease illustrations Touching a glowing hexagon icon with the words cost reduction on a dark background. Visualize cost reduction strategies with this image. A finger touches a glowing hexagon icon with "cost reduction" text, representing business finance and savings. Ideal for corporate presentations on management
Free with trial Colorful Bar Chart Graph Showing Growth and Performance Over Time with Upward Trend. Progress decrease vectors Colorful Bar Chart Graph Showing Growth and Performance Over Time with Upward Trend
Free with trial This vibrant image, generated by AI, depicts a cityscape with a dynamic graph illustrating growth and potential decline. The color transition symbolizes economic fluctuations, offering a visual representation of urban development and market trends. Progress decrease illustrations AI-Generated Cityscape Growth Chart. This vibrant image, generated by AI, depicts a cityscape with a dynamic graph illustrating growth and potential decline. The color transition symbolizes economic fluctuations, offering a visual representation of urban development and market trends.
Free with trial Five colorful bars, resembling a chart, visually represent a downward trend. The bars are yellow, green, blue and purple. Progress decrease vectors Colorful bar chart illustration showing declining trend on transparent background. Five colorful bars, resembling a chart, visually represent a downward trend. The bars are yellow, green, blue and purple.
Free with trial This futuristic visualization, generated by AI, depicts a global Bitcoin network, highlighting its worldwide reach and digital infrastructure. Data streams and interactive elements showcase the complex interplay of transactions and information flow within the cryptocurrency ecosystem. Progress decrease illustrations Global Bitcoin Network
Free with trial This conceptual illustration depicts the relationship between productivity signals and cognitive flow lines in human brains. The image features two stylized human heads, one with a red and orange network representing a decrease in productivity, and the other with a blue and green network representing an increase in productivity. The illustration highlights the importance of understanding mental states and optimizing workflow to achieve success and improve overall well-being. Progress decrease vectors Mental health A conceptual illustration of productivity signals and cognitive flow lines in human brains. This conceptual illustration depicts the relationship between productivity signals and cognitive flow lines in human brains. The image features two stylized human heads, one with a red and orange network representing a decrease in productivity, and the other with a blue and green network representing an increase in productivity. The illustration highlights the importance of understanding mental states and optimizing workflow to achieve success and improve overall well-being.
Free with trial Simple vector graph illustration showing increasing and decreasing trend with bars. Progress decrease vectors Simple vector graph illustration showing increasing and decreasing trend with bars
Free with trial Three stacked downward pointing chevrons inside a circle with decorative plus symbols. Progress decrease vectors Three stacked downward pointing chevrons inside a circle with decorative plus symbols
Free with trial Financial Growth Chart on a Suitcase Business Investment Economy Graphic Illustration. Progress decrease vectors Financial Growth Chart on a Suitcase Business Investment Economy Graphic Illustration
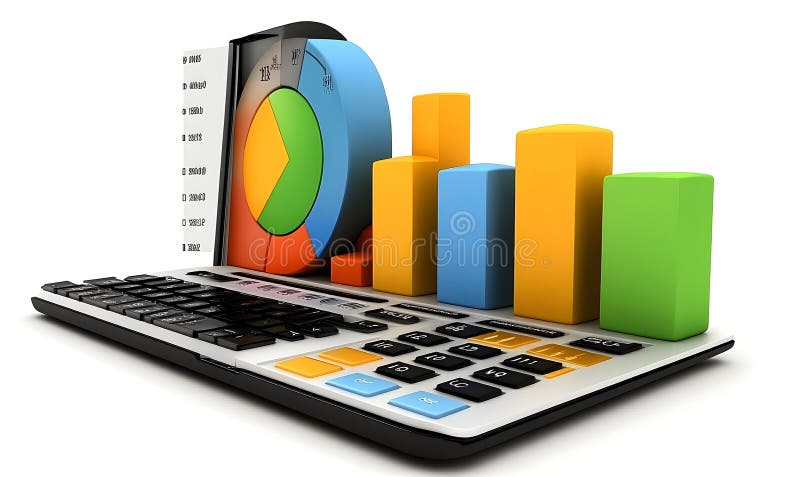
Free with trial Colorful Charts on a Calculator Keyboard. Progress decrease illustrations Colorful Charts on a Calculator Keyboard
Free with trial A vibrant circular chart displaying a twenty percent decrease with bright colors and clean design, ideal for business, finance, and analytics presentations. Progress decrease illustrations Colorful Circular Chart with Percentage Reduction in Modern Data Visualization Style. A vibrant circular chart displaying a twenty percent decrease with bright colors and clean design, ideal for business, finance, and analytics presentations
Free with trial A modern workspace features a desktop computer displaying hand-drawn charts and graphs, representing data analysis and business insights. The screen shows various types of charts including bar graphs, line graphs, and pie charts. The overall image projects a sense of productivity and strategic pla. Progress decrease illustrations Data Visualization on Desktop. A modern workspace features a desktop computer displaying hand-drawn charts and graphs, representing data analysis and business insights. The screen shows various types of charts including bar graphs, line graphs, and pie charts. The overall image projects a sense of productivity and strategic pla
Free with trial This image shows a calculator, tablet, and financial charts, all generated by AI for illustrative purposes. The blue color scheme emphasizes the data-driven nature of modern finance and business analytics. The image suggests efficiency and precision in financial planning and analysis. Progress decrease illustrations Financial Data Analysis. This image shows a calculator, tablet, and financial charts, all generated by AI for illustrative purposes. The blue color scheme emphasizes the data-driven nature of modern finance and business analytics. The image suggests efficiency and precision in financial planning and analysis.
Free with trial Understanding bar graph charts data analysis and visualization for business and financial performance metrics. Progress decrease vectors Understanding bar graph charts data analysis and visualization for business
Free with trial Business data is visually represented in black and white through various charts and graphs illustrating growth analysis and strategic planning for financial reporting showing a clear picture of market. Progress decrease vectors Black and white business data visualization with charts and graphs showing growth and analysis for financial reporting and. Business data is visually represented in black and white through various charts and graphs illustrating growth analysis and strategic planning for financial reporting showing a clear picture of market
Free with trial A collection of minimalist, gray 3D icons representing various data points and processes, including charts, graphs, documents, cloud computing, location markers, and alerts. The design suggests data analysis, project management, or business intelligence concepts. Progress decrease illustrations Data Visualization Icons. A collection of minimalist, gray 3D icons representing various data points and processes, including charts, graphs, documents, cloud computing, location markers, and alerts. The design suggests data analysis, project management, or business intelligence concepts.
Free with trial Graphs set with line charts, bar charts, and scatter plots illustrating upward and downward trends with arrows and data points. Progress decrease vectors Graphs set with line charts, bar charts, and scatter plots illustrating upward and
Free with trial 3D bar chart with red arrows pointing upwards, reflecting off a shiny, blue surface. The clean, minimalist design symbolizes financial growth, business success, and positive market trends. Ideal for use in presentations, financial reports, and marketing materials related to investment, stock market, and economic progress. Progress decrease illustrations Financial Growth 3D Bar Chart with Red Arrows. 3D bar chart with red arrows pointing upwards, reflecting off a shiny, blue surface. The clean, minimalist design symbolizes financial growth, business success, and positive market trends. Ideal for use in presentations, financial reports, and marketing materials related to investment, stock market, and economic progress
Free with trial A simple bar graph illustrating upward growth and financial success. Ideal for presentations, reports, and website use. Progress decrease vectors Upward Trending Bar Graph: Business Growth and Financial Success. A simple bar graph illustrating upward growth and financial success. Ideal for presentations, reports, and website use.
Free with trial Financial planning graph shows coins and pen. Progress decrease illustrations Financial planning graph shows coins and pen
Free with trial A clean, minimalist 3D render depicts a series of white arrows of varying heights arranged in a graph-like formation. The tallest arrows, on the left, are illuminated with a warm, orange glow, symbolizing growth, success, and positive trends. The arrows decrease in size towards the right, suggesting a progression or trend line. The reflective surface and bright, airy background create a modern and optimistic feel, ideal for business, finance, and technology-related concepts. Progress decrease illustrations Rising Arrows Graph. A clean, minimalist 3D render depicts a series of white arrows of varying heights arranged in a graph-like formation. The tallest arrows, on the left, are illuminated with a warm, orange glow, symbolizing growth, success, and positive trends. The arrows decrease in size towards the right, suggesting a progression or trend line. The reflective surface and bright, airy background create a modern and optimistic feel, ideal for business, finance, and technology-related concepts.
Free with trial Arrows and text indicating upward and downward movement, representing growth and decline in business. Progress decrease vectors Arrows and text indicating upward and downward movement, representing growth and
Free with trial A conceptual vector illustration depicting the duality of business performance. On a modern teal background, two reports are shown side-by-side. One features a rising red graph symbolizing growth, profit, and success, while the other displays a descending graph representing decline, loss, and failure. This flat design graphic is ideal for financial analysis, market trend comparisons, business presentations, and infographics illustrating opposite outcomes or strategic choices. The long shadow effect adds a contemporary feel to the design. Progress decrease vectors Growth and Decline Business Charts Comparison. A conceptual vector illustration depicting the duality of business performance. On a modern teal background, two reports are shown side-by-side. One features a rising red graph symbolizing growth, profit, and success, while the other displays a descending graph representing decline, loss, and failure. This flat design graphic is ideal for financial analysis, market trend comparisons, business presentations, and infographics illustrating opposite outcomes or strategic choices. The long shadow effect adds a contemporary feel to the design.
Free with trial Brightly colored wooden blocks arranged as a bar graph with one block falling represents decline Use for financial or business illustrations. Progress decrease illustrations Colorful Wooden Blocks Forming a Graph, One Falling, on Data Chart. Brightly colored wooden blocks arranged as a bar graph with one block falling represents decline Use for financial or business illustrations
Free with trial A magnifying glass focuses on a vibrant bar graph, symbolizing financial growth and investment opportunities. Stacks of gold coins rest on a financial report, enhancing the visual representation of wealth and prosperity. This 3D rendering, generated by AI, is ideal for illustrating financial concep. Progress decrease illustrations Financial Growth Analysis. A magnifying glass focuses on a vibrant bar graph, symbolizing financial growth and investment opportunities. Stacks of gold coins rest on a financial report, enhancing the visual representation of wealth and prosperity. This 3D rendering, generated by AI, is ideal for illustrating financial concep
Free with trial A striking, stylized vector logo featuring a majestic bird, possibly a phoenix or eagle, rendered in vibrant red with bold black outlines. The bird's body elegantly transforms into a prominent downward-pointing arrow, creating a dynamic and powerful visual. This modern, geometric design conveys concepts of descent, direction, strength, and transformation. Ideal for branding, gaming, sports teams, financial graphics indicating a downturn, or any project requiring a strong, symbolic icon with a clear directional message. Progress decrease vectors Stylized Phoenix Bird with Downward Arrow Logo. A striking, stylized vector logo featuring a majestic bird, possibly a phoenix or eagle, rendered in vibrant red with bold black outlines. The bird's body elegantly transforms into a prominent downward-pointing arrow, creating a dynamic and powerful visual. This modern, geometric design conveys concepts of descent, direction, strength, and transformation. Ideal for branding, gaming, sports teams, financial graphics indicating a downturn, or any project requiring a strong, symbolic icon with a clear directional message.
Free with trial A black graph on a white background depicts a sharp downward trend with an arrow indicating further decline. Progress decrease illustrations Black graph showing a downward trend on a white background chart decline. A black graph on a white background depicts a sharp downward trend with an arrow indicating further decline
Free with trial An eye-catching 3D bar graph illustration with yellow, blue, and red elements. It is designed to represent data or growth concepts. Progress decrease vectors Colorful 3D bar graph illustration showing descending values on transparent background. An eye-catching 3D bar graph illustration with yellow, blue, and red elements. It is designed to represent data or growth concepts.