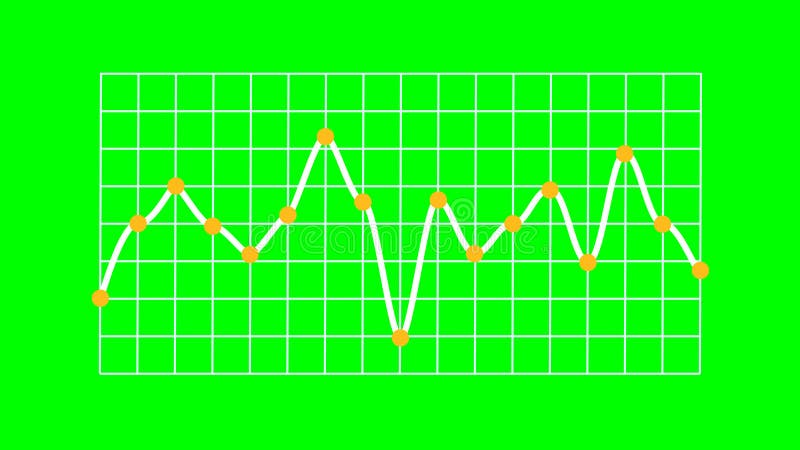
Free with trial Rendered line graph showing a single white line indicating data trends with distinct fluctuations. Yellow marker points animate vertically from the X-axis, and each plotted value features an orange circular dot. The white line runs over a structured white grid on a bright green screen background, enabling chroma keying. No axis values or units are present, emphasizing visual representation of abstract data and business trends. Progress decrease illustrations Business Trend Line Graph Showing Trading on Green Screen. Rendered line graph showing a single white line indicating data trends with distinct fluctuations. Yellow marker points animate vertically from the X-axis, and each plotted value features an orange circular dot. The white line runs over a structured white grid on a bright green screen background, enabling chroma keying. No axis values or units are present, emphasizing visual representation of abstract data and business trends.
Free with trial A bright neon blue arrow points downwards, surrounded by dynamic, swirling light trails, against a dark, abstract background. Clear details and vibrant colors enhance visual appeal. Progress decrease illustrations Neon blue arrow pointing down with swirling light trails on a dark background abstract business. A bright neon blue arrow points downwards, surrounded by dynamic, swirling light trails, against a dark, abstract background. Clear details and vibrant colors enhance visual appeal
Free with trial A grid of black and white icons depicting financial charts with rising and falling trends, magnifying glasses with download arrows, and dollar signs. Progress decrease vectors Collection of black and white icons representing financial charts and data analysis graph bar chart. A grid of black and white icons depicting financial charts with rising and falling trends, magnifying glasses with download arrows, and dollar signs
Free with trial This vector illustration presents a comprehensive set of four distinct volume level icons, ideal for user interface design. Each icon features a stylized blue and black speaker, accompanied by horizontal bars indicating varying sound intensities: high, medium, low, and mute. The set also includes subtle arrows suggesting volume adjustment. Perfect for web applications, mobile apps, multimedia players, or any digital interface requiring clear and intuitive audio control indicators. The clean, modern design ensures versatility across various platforms and projects. Progress decrease vectors Volume Level Icon Set. This vector illustration presents a comprehensive set of four distinct volume level icons, ideal for user interface design. Each icon features a stylized blue and black speaker, accompanied by horizontal bars indicating varying sound intensities: high, medium, low, and mute. The set also includes subtle arrows suggesting volume adjustment. Perfect for web applications, mobile apps, multimedia players, or any digital interface requiring clear and intuitive audio control indicators. The clean, modern design ensures versatility across various platforms and projects.
Free with trial A vibrant bar graph shows an upward trend with a green arrow, indicating growth. The bars are blue, yellow, green, and red, set against a clean white background. Progress decrease illustrations Colorful Bar Graph with Upward Trend Line and Green Arrow Indicator on White Background. A vibrant bar graph shows an upward trend with a green arrow, indicating growth. The bars are blue, yellow, green, and red, set against a clean white background
Free with trial This image illustrates a comparison between an increasing trend and a decreasing trend using bar graphs and arrows. Progress decrease illustrations Comparison of increasing and decreasing trends. This image illustrates a comparison between an increasing trend and a decreasing trend using bar graphs and arrows
Free with trial Hand presents a declining bar graph illustrating cost reduction, creating a compelling business visual Perfect for presentations and financial analysis. Progress decrease illustrations Presenting Cost Reduction with Graph and Hand. Hand presents a declining bar graph illustrating cost reduction, creating a compelling business visual Perfect for presentations and financial analysis
Free with trial This 3D rendered image shows a computer screen displaying various charts and graphs, including bar charts, pie charts, and line graphs. The data visualization is colorful and easy to understand, generated by AI for quick data interpretation. The design is simple and modern, ideal for presentations. Progress decrease illustrations AI-Generated Data Dashboard. This 3D rendered image shows a computer screen displaying various charts and graphs, including bar charts, pie charts, and line graphs. The data visualization is colorful and easy to understand, generated by AI for quick data interpretation. The design is simple and modern, ideal for presentations
Free with trial Illustration of economic growth is depicted by a green staircase ascending toward light, symbolizing progress and increased prosperity. Progress decrease vectors Illustration of economic growth is depicted by a green staircase ascending toward light
Free with trial A striking 3D render features a bold red arrow, sharply angled downwards, positioned on a textured wooden surface. The arrow's zigzag path suggests a dynamic decline, making it a powerful visual metaphor for financial downturns, market crashes, or negative trends. The warm tones of the wood contrast with the vibrant red, creating a visually engaging composition. This image is ideal for illustrating concepts related to economic recession, business failure, loss, or any situation involving a downward trajectory. Progress decrease illustrations Red Arrow Pointing Downward on Wooden Background. A striking 3D render features a bold red arrow, sharply angled downwards, positioned on a textured wooden surface. The arrow's zigzag path suggests a dynamic decline, making it a powerful visual metaphor for financial downturns, market crashes, or negative trends. The warm tones of the wood contrast with the vibrant red, creating a visually engaging composition. This image is ideal for illustrating concepts related to economic recession, business failure, loss, or any situation involving a downward trajectory.
Free with trial Green thermometer with arc and downward arrows indicating temperature change or comparison. Progress decrease vectors Green thermometer with arc and downward arrows indicating temperature change or comparison
Free with trial Modern, minimalistic chart icon for business and finance. Progress decrease illustrations Modern, minimalistic chart icon for business and finance
Free with trial The concept of a business financial crash depicted by a vibrant 3D rendering of a declining chart. Progress decrease illustrations The concept of a business financial crash depicted by a vibrant 3D rendering of a declining chart.
Free with trial Financial chart displays data points and lines indicating trends against a blue background and is useful for presentations. Progress decrease illustrations Financial Data on Chart. Financial chart displays data points and lines indicating trends against a blue background and is useful for presentations
Free with trial This image showcases a person using a tablet to interact with business analytics data, generated by AI. The visualization includes graphs and charts, providing real-time insights into key performance indicators. This technology streamlines business decision-making. Progress decrease illustrations AI-Powered Business Analytics. This image showcases a person using a tablet to interact with business analytics data, generated by AI. The visualization includes graphs and charts, providing real-time insights into key performance indicators. This technology streamlines business decision-making.
Free with trial Financial arrows up and down icon on circle. Growth and decline graph sign symbol illustration. Progress decrease vectors Financial arrows up and down icon on circle. Growth and decline graph sign symbol
Free with trial Person using laptop, calendar representing planning, carbon footprint icon with CO2, and thermometer pointing down. Ideal for sustainability, eco-friendly practices, remote work, planning, emission. Progress decrease vectors Man working on laptop with calendar, carbon footprint icon, and thermometer symbolizing emission reduction. Person using laptop, calendar representing planning, carbon footprint icon with CO2, and thermometer pointing down. Ideal for sustainability, eco-friendly practices, remote work, planning, emission
Free with trial A cartoon illustration of a man interacting with a bar chart. The man is depicted in a simple, clean style, wearing a blue shirt and brown pants. He is holding a green bar, seemingly adjusting or interacting with the colorful bars displayed on a table. The illustration is suitable for conveying concepts related to data analysis, business, finance, and presentation. Progress decrease illustrations Cartoon Man and Bar Chart. A cartoon illustration of a man interacting with a bar chart. The man is depicted in a simple, clean style, wearing a blue shirt and brown pants. He is holding a green bar, seemingly adjusting or interacting with the colorful bars displayed on a table. The illustration is suitable for conveying concepts related to data analysis, business, finance, and presentation.
Free with trial Description: Simple line art illustration of a scatter plot graph showing an uneven distribution of data points. Perfect for presentations or reports. Progress decrease vectors Abstract Data Visualization: Scatter Plot Chart with Irregular Data Points. Description: Simple line art illustration of a scatter plot graph showing an uneven distribution of data points. Perfect for presentations or reports.
Free with trial A bold line graph icon displays business data with trend analysis, featuring circles marking data points and horizontal lines indicating value levels. Progress decrease vectors Bold Line Graph Icon: Business Data Visualization with Trend Analysis. A bold line graph icon displays business data with trend analysis, featuring circles marking data points and horizontal lines indicating value levels
Free with trial Abstract downward pointing arrow graphic with three layered chevrons in warm gradient colors. Progress decrease vectors Abstract downward pointing arrow graphic with three layered chevrons in warm gradient colors
Free with trial Unemployment rate gauge shows the current economic climate with a red needle pointing towards a high rate indicating potential financial instability market downturn and job insecurity reflecting conc. Progress decrease illustrations Unemployment rate gauge showing economic conditions with a red indicator needle pointing up. Unemployment rate gauge shows the current economic climate with a red needle pointing towards a high rate indicating potential financial instability market downturn and job insecurity reflecting conc
Free with trial Red bar graph with decreasing values. Generative AI. Progress decrease illustrations Red bar graph with decreasing values
Free with trial Colorful blocks in decreasing order on a blue surface. Represents decline or recession in a vibrant, illustrative manner. Stock photo. Progress decrease illustrations Colorful blocks in decreasing order on a blue surface. Represents decline or recession in a vibrant, illustrative manner
Free with trial A person's hands gently cradle a vibrant, dynamic data visualization generated by AI. The image showcases interconnected nodes and lines, forming a complex yet aesthetically pleasing network. This represents the power of AI in data analysis and presentation. Progress decrease illustrations AI-Generated Data Visualization. A person's hands gently cradle a vibrant, dynamic data visualization generated by AI. The image showcases interconnected nodes and lines, forming a complex yet aesthetically pleasing network. This represents the power of AI in data analysis and presentation.
Free with trial This vibrant 3D rendering showcases a bar chart and pie chart, illustrating data growth and proportions. Ideal for presentations, reports, or educational materials. The colorful design makes it visually appealing and easy to understand. Progress decrease illustrations Colorful 3D Bar Chart and Pie Chart Data Presentation. This vibrant 3D rendering showcases a bar chart and pie chart, illustrating data growth and proportions. Ideal for presentations, reports, or educational materials. The colorful design makes it visually appealing and easy to understand.
Free with trial A bold red arrow curves downwards, indicating a negative trend or a directional choice. This simple yet impactful graphic is isolated for clarity. Progress decrease illustrations Red arrow pointing down on. A bold red arrow curves downwards, indicating a negative trend or a directional choice. This simple yet impactful graphic is isolated for clarity
Free with trial Data visualization with red and green chart on a wall display ,Generative ai. Progress decrease illustrations Dynamic data visualization, red and green chart analysis on wall display. Data visualization with red and green chart on a wall display ,Generative ai
Free with trial Line Graph Trend Analysis Line And Solid Icon Set. Data Visualization, Business Growth, Statistical Analysis Symbol Collection. Financial And Market Insights. Isolated Vector Illustration. Progress decrease vectors Line Graph Trend Analysis Line And Solid Icon Set. Data Visualization, Business Growth, Statistical Analysis Symbol
Free with trial Graph showing a line that is green and has a black background. The line is going up and to the right. Progress decrease illustrations Graph showing a line that is green and has a black background
Free with trial A dynamic display of market trends with charts and graphs in a cool blue color scheme. Progress decrease illustrations Financial market analysis with data charts and line graphs in blue tone. a dynamic display of market trends with charts and graphs in a cool blue color scheme
Free with trial This image showcases a dynamic graph, generated by AI, illustrating fluctuating data patterns. The abstract, wave-like design creates a visually engaging representation of complex information, perfect for presentations or reports needing a modern aesthetic. Its cool blue tones evoke a sense of calm. Progress decrease illustrations Abstract Data Visualization. This image showcases a dynamic graph, generated by AI, illustrating fluctuating data patterns. The abstract, wave-like design creates a visually engaging representation of complex information, perfect for presentations or reports needing a modern aesthetic. Its cool blue tones evoke a sense of calm
Free with trial Analyze Data with Colorful Graph and Notes for Business Planning Strategy , layered depth. Progress decrease illustrations Analyze Data with Colorful Graph and Notes for Business Planning Strategy
Free with trial Pastel-colored bar graph with downward trending arrow illustrates financial decline or loss This image is suitable for business presentations or economic reports. Progress decrease illustrations Declining Bar Graph with Arrow Showing Downtrend, Financial Loss Concept. Pastel-colored bar graph with downward trending arrow illustrates financial decline or loss This image is suitable for business presentations or economic reports
Free with trial Hand holding smartphone displaying stock market graph, Create with artificial intelligence. Progress decrease illustrations Hand holding smartphone displaying stock market graph
Free with trial A businessman in a suit is interacting with a digital interface, highlighting the balance between increasing quality and decreasing costs. The interface shows 'Quality' with an upward arrow and 'Cost' with a downward arrow, both marked with checkmarks, symbolizing successful optimization. This image represents business strategy, efficiency, and the importance of finding the right balance for success. Progress decrease illustrations Quality vs. Cost Optimization. A businessman in a suit is interacting with a digital interface, highlighting the balance between increasing quality and decreasing costs. The interface shows 'Quality' with an upward arrow and 'Cost' with a downward arrow, both marked with checkmarks, symbolizing successful optimization. This image represents business strategy, efficiency, and the importance of finding the right balance for success.
Free with trial A modern, clean isometric illustration showcasing various data visualizations. Multiple charts and graphs, including bar charts, line graphs, and pie charts, are displayed on floating screens, representing data analysis, business intelligence, or financial reporting. Ideal for presentations, reports, or website banners related to data-driven concepts. Progress decrease illustrations Isometric 3D Data Visualization: Charts and Graphs on Floating Screens. A modern, clean isometric illustration showcasing various data visualizations. Multiple charts and graphs, including bar charts, line graphs, and pie charts, are displayed on floating screens, representing data analysis, business intelligence, or financial reporting. Ideal for presentations, reports, or website banners related to data-driven concepts.
Free with trial Graph with a green arrow pointing upwards. The graph is labeled with numbers and the numbers are increasing. Progress decrease illustrations Graph with a green arrow pointing upwards
Free with trial Bar graphs with various upward and downward trending arrows and a stylized dollar sign indicating financial growth and decline. Progress decrease vectors Bar graphs with various upward and downward trending arrows and a stylized dollar sign
Free with trial Hand drawing a decreasing bar graph with chalk on a dark chalkboard. Progress decrease illustrations Hand drawing declining bar chart on blackboard. Hand drawing a decreasing bar graph with chalk on a dark chalkboard
Free with trial A clear and modern set of speaker and volume level icons, featuring a black loudspeaker symbol paired with progressive green bar indicators. This collection visually represents various sound intensities, from low to high, ideal for user interface design. Perfect for web applications, mobile apps, multimedia players, and any digital project requiring intuitive audio control elements. The flat design ensures versatility and readability across different platforms. Progress decrease illustrations Speaker Volume Level Icons Set. A clear and modern set of speaker and volume level icons, featuring a black loudspeaker symbol paired with progressive green bar indicators. This collection visually represents various sound intensities, from low to high, ideal for user interface design. Perfect for web applications, mobile apps, multimedia players, and any digital project requiring intuitive audio control elements. The flat design ensures versatility and readability across different platforms.
Free with trial A 3D rendered icon of a bar chart with four ascending bars. The bars are a deep blue color and are heavily covered in realistic ice and snow, dripping from the tops. The chart is framed by metallic gray and dark gray. The icon is presented on a white background. Progress decrease illustrations 3D Bar Chart Icon With Blue Bars Covered in Ice and Snow. A 3D rendered icon of a bar chart with four ascending bars. The bars are a deep blue color and are heavily covered in realistic ice and snow, dripping from the tops. The chart is framed by metallic gray and dark gray. The icon is presented on a white background
Free with trial A clean, minimalist illustration featuring a combined line graph and bar chart on a white background. The line graph, with circular data points, shows an upward trend with fluctuations. It is overlaid on a series of vertical bars, alternating in black and white, representing discrete data values. The grid lines behind the charts suggest a data analysis or financial context. This graphic is ideal for presentations, reports, and websites related to statistics, business growth, market trends, and data visualization. Progress decrease vectors Line and Bar Chart Combination. A clean, minimalist illustration featuring a combined line graph and bar chart on a white background. The line graph, with circular data points, shows an upward trend with fluctuations. It is overlaid on a series of vertical bars, alternating in black and white, representing discrete data values. The grid lines behind the charts suggest a data analysis or financial context. This graphic is ideal for presentations, reports, and websites related to statistics, business growth, market trends, and data visualization.
Free with trial A vibrant red neon arrow sign glows brightly against a dark, textured background. The arrow points directly downwards, its illuminated outline sharp and clear. The background features subtle folds and reflections, adding depth and a sense of atmosphere. This image is perfect for concepts related to direction, decline, downward trends, navigation, or warnings. It can be used in designs for websites, presentations, or marketing materials that need a bold visual cue. Progress decrease illustrations Red Neon Arrow Pointing Down on Dark Textured Background. A vibrant red neon arrow sign glows brightly against a dark, textured background. The arrow points directly downwards, its illuminated outline sharp and clear. The background features subtle folds and reflections, adding depth and a sense of atmosphere. This image is perfect for concepts related to direction, decline, downward trends, navigation, or warnings. It can be used in designs for websites, presentations, or marketing materials that need a bold visual cue.
Free with trial This hand-drawn bar chart, generated by AI, visually represents growth over time. The chart shows an initial decline followed by a significant upward trend, highlighting potential recovery or resurgence after a setback. The artistic style adds a unique touch. Progress decrease illustrations AI-Generated Growth Chart. This hand-drawn bar chart, generated by AI, visually represents growth over time. The chart shows an initial decline followed by a significant upward trend, highlighting potential recovery or resurgence after a setback. The artistic style adds a unique touch.
Free with trial Simple double arrow icon, pointing both up and down, representing movement or options. Perfect for website or app interface design. Progress decrease vectors Double Arrow Icon: Up and Down Direction Symbol. Simple double arrow icon, pointing both up and down, representing movement or options. Perfect for website or app interface design.
Free with trial Abstract Business Growth Chart with Vintage Texture. Progress decrease illustrations Abstract Business Growth Chart with Vintage Texture
Free with trial A businessman in a suit is pointing at a digital screen displaying a graph. The graph illustrates the concept of quality improvement and cost reduction. An upward-pointing arrow signifies the increas. Progress decrease illustrations Businessman pointing at a graph showing quality improvement and cost reduction on a digital screen. A businessman in a suit is pointing at a digital screen displaying a graph. The graph illustrates the concept of quality improvement and cost reduction. An upward-pointing arrow signifies the increas
Free with trial An illustration depicts a sad face atop a credit card and rising green bars with upward arrows in a flat design style. Progress decrease vectors Financial Burden and Growth: Sad Face with Credit Card and Rising Arrows Concept. An illustration depicts a sad face atop a credit card and rising green bars with upward arrows in a flat design style.
Free with trial A pair of black and white line art icons depicting hand gestures. The top icon shows a hand with its palm facing down, accompanied by an upward arrow and a curved arrow, symbolizing actions like lifting, raising, or uploading. The bottom icon features a hand with its palm facing up, alongside a downward arrow and a curved arrow, representing actions such as dropping, lowering, or downloading. These clean, minimalist vector illustrations are ideal for user interface design, instructional graphics, web and mobile applications, or any project requiring clear visual representation of up and down movements, data transfer, or interactive commands. Progress decrease vectors Lift and Drop Hand Gesture Icons. A pair of black and white line art icons depicting hand gestures. The top icon shows a hand with its palm facing down, accompanied by an upward arrow and a curved arrow, symbolizing actions like lifting, raising, or uploading. The bottom icon features a hand with its palm facing up, alongside a downward arrow and a curved arrow, representing actions such as dropping, lowering, or downloading. These clean, minimalist vector illustrations are ideal for user interface design, instructional graphics, web and mobile applications, or any project requiring clear visual representation of up and down movements, data transfer, or interactive commands.
Free with trial A person's hand holds a glowing arrow pointing downwards, with a digital cube labeled Kkg, symbolizing weight reduction. The image is set against a dark background. Progress decrease illustrations Digital Weight Reduction Concept: Hand Holding Glowing Arrow and Kkg Cube. A person's hand holds a glowing arrow pointing downwards, with a digital cube labeled Kkg, symbolizing weight reduction. The image is set against a dark background
Free with trial Colorful bar chart on a red background displaying data ,Generative ai. Progress decrease illustrations Vibrant colorful bar chart on red background, data visualization and analysis colorful. Colorful bar chart on a red background displaying data ,Generative ai
Free with trial A simple bar chart with alternating blue and green bars illustrates a clear downward trend over time. Progress decrease illustrations Bar chart showing declining trend. A simple bar chart with alternating blue and green bars illustrates a clear downward trend over time
Free with trial This minimalist graphic illustration features a bold red line chart indicating a significant decline. The visual composition uses a clean white background to emphasize the downward trajectory of the data points. The aesthetic is professional and modern, suitable for business presentations or financial reports. Progress decrease vectors A red line graph showing a downward trend on a white background. This minimalist graphic illustration features a bold red line chart indicating a significant. This minimalist graphic illustration features a bold red line chart indicating a significant decline. The visual composition uses a clean white background to emphasize the downward trajectory of the data points. The aesthetic is professional and modern, suitable for business presentations or financial reports
Free with trial Green up arrow and orange down arrow icon symbolizing direction change data flow transfer growth decline. Progress decrease vectors Green up arrow and orange down arrow icon symbolizing direction change data flow transfer growth decline
Free with trial Arrows up and down with human pictogram figures showing business growth versus decline, career promotion concept, minimal paper cut icons on yellow background. Progress decrease illustrations Arrows up and down with human pictogram figures showing business growth versus decline
Free with trial Bright green upward and red downward curved arrow icons in vector style. Progress decrease illustrations Up and down curved arrows icon set. Bright green upward and red downward curved arrow icons in vector style
Free with trial A set of ten different downward-pointing arrow icons in black and white. The arrows vary in style, including solid, outlined, geometric, and abstract designs. Perfect for use in presentations, websites, infographics, and other design projects where a visual cue for direction or download is needed. The diverse styles offer flexibility for different aesthetic preferences and design contexts. Progress decrease vectors Collection of Downward Arrow Icons. A set of ten different downward-pointing arrow icons in black and white. The arrows vary in style, including solid, outlined, geometric, and abstract designs. Perfect for use in presentations, websites, infographics, and other design projects where a visual cue for direction or download is needed. The diverse styles offer flexibility for different aesthetic preferences and design contexts.
Free with trial A 3D graph chart on a plain white background, representing data visualization and statistics. Progress decrease illustrations 3D Graph Chart on White Background. A 3D graph chart on a plain white background, representing data visualization and statistics
Free with trial A flat design illustration of a bar chart with bars decreasing in height, accompanied by a red arrow pointing downwards, symbolizing a negative trend or financial loss. Progress decrease illustrations Bar chart showing a downward trend. A flat design illustration of a bar chart with bars decreasing in height, accompanied by a red arrow pointing downwards, symbolizing a negative trend or financial loss
Free with trial A vibrant red arrow curves downwards, indicating a direction or trend. The arrow has a gradient effect and a sharp point. Progress decrease illustrations Red curved arrow pointing downward. A vibrant red arrow curves downwards, indicating a direction or trend. The arrow has a gradient effect and a sharp point
Free with trial Colorful wooden blocks arranged in a bar graph formation on a weathered wooden surface , artistic vibe. Progress decrease illustrations Colorful wooden blocks arranged in a bar graph formation on a weathered wooden surface
Free with trial An abstract 3D visualization of a symmetrical red bar graph or chart on a white background. The bars are arranged in a pattern that rises to a central peak and then descends, resembling a wave or mountain range. The bars are rounded at the top. Progress decrease illustrations Abstract Red Bar Graph on White Background chart statistics. An abstract 3D visualization of a symmetrical red bar graph or chart on a white background. The bars are arranged in a pattern that rises to a central peak and then descends, resembling a wave or mountain range. The bars are rounded at the top
Free with trial A clean, minimalist vector illustration of a bar chart featuring three distinct columns. The columns are colored in vibrant orange, teal, and yellow, representing different data points or categories. The chart is set against a white background with a dark blue axis line, making it ideal for presentations, reports, and infographics focused on data visualization, business growth, or financial analysis. Progress decrease vectors Simple Bar Chart with Three Columns. A clean, minimalist vector illustration of a bar chart featuring three distinct columns. The columns are colored in vibrant orange, teal, and yellow, representing different data points or categories. The chart is set against a white background with a dark blue axis line, making it ideal for presentations, reports, and infographics focused on data visualization, business growth, or financial analysis.
Free with trial This 3D rendering shows a bar graph of increasing value, represented by white bars, alongside stacks of gold coins, visually depicting financial growth. The image was generated by AI, showcasing the potential of AI in visualizing financial data. Progress decrease illustrations AI-Generated Financial Growth Chart. This 3D rendering shows a bar graph of increasing value, represented by white bars, alongside stacks of gold coins, visually depicting financial growth. The image was generated by AI, showcasing the potential of AI in visualizing financial data.
Free with trial A 3D rendered bar chart encased in clear glass, displaying year-end business performance. The chart features three vertical bars in blue, pink, and yellow, representing 61%, 24%, and 35% respectively. The clean, modern design and transparent material create a sophisticated visual suitable for presentations, reports, and data visualization concepts related to business growth, financial analysis, and success metrics. Progress decrease illustrations Year End Business Performance Chart. A 3D rendered bar chart encased in clear glass, displaying year-end business performance. The chart features three vertical bars in blue, pink, and yellow, representing 61%, 24%, and 35% respectively. The clean, modern design and transparent material create a sophisticated visual suitable for presentations, reports, and data visualization concepts related to business growth, financial analysis, and success metrics.
Free with trial A 3D rendered icon featuring a vibrant blue circle with a prominent white arrow pointing downwards. The arrow is stylized and appears to be slightly raised from the surface of the blue circle, giving it a dimensional quality. The icon is set against a stark white background, emphasizing its clean and graphic design. Progress decrease illustrations 3D Blue Circle with White Downward Arrow Icon on White Background. A 3D rendered icon featuring a vibrant blue circle with a prominent white arrow pointing downwards. The arrow is stylized and appears to be slightly raised from the surface of the blue circle, giving it a dimensional quality. The icon is set against a stark white background, emphasizing its clean and graphic design
Free with trial Trend artwork composite banner 3D photo collage of analyzing graphics target goal business young man scream pressure arrow down crisis. Progress decrease illustrations Trend artwork composite banner 3D photo collage of analyzing graphics target goal business young man scream pressure
Free with trial Green chart visualizing a downward trend, indicating a decline in values ,Generative ai. Progress decrease illustrations Declining values, green chart depicts a downward trend and financial analysis green. Green chart visualizing a downward trend, indicating a decline in values ,Generative ai
Free with trial Set of 16 black and white graph icons in a 4x4 grid. Each icon depicts variations of bar charts with upward and downward arrows, suggesting growth or decline. Some include additional elements like magnifying glasses, checkmarks, and data points connected by lines. Icons vary slightly in design, representing different data trends with simple, bold lines on a white background, ideal for business and statistical representation. Progress decrease vectors Graph icon set. Increase and decrease graph icon. Growth icon. Graph chart icons. Icon set. 16 icons. Set of 16 black and white graph icons in a 4x4 grid. Each icon depicts variations of bar charts with upward and downward arrows, suggesting growth or decline. Some include additional elements like magnifying glasses, checkmarks, and data points connected by lines. Icons vary slightly in design, representing different data trends with simple, bold lines on a white background, ideal for business and statistical representation.
Free with trial A single, glossy, bright blue arrow points downwards. The arrow has a rounded top and a sharp arrowhead. It is rendered in 3D with a reflective surface, casting a faint shadow on the white background. Progress decrease illustrations Glossy Blue Down Arrow Icon On White Background direction move. A single, glossy, bright blue arrow points downwards. The arrow has a rounded top and a sharp arrowhead. It is rendered in 3D with a reflective surface, casting a faint shadow on the white background
Free with trial An elderly woman is struggling with dementia and memory loss, requiring specialized care from trained caregivers, as her. Progress decrease illustrations An elderly woman is struggling with dementia and memory loss, requiring specialized care from trained caregivers, as her
Free with trial Colorful 3D Bar Chart Illustration for indicator economic review. Progress decrease illustrations Colorful 3D Bar Chart Illustration
Free with trial A vibrant 3D bar chart, featuring glossy blue and orange rectangular segments, illustrates data progression or comparison. The varying bar heights convey growth or statistical analysis. This modern graphic is ideal for business, finance, and analytical concepts, presented cleanly isolated on a transparent background. Progress decrease vectors Glossy 3D bar chart showing data growth and statistics with blue and orange segments, perfect for business and finance presentatio. A vibrant 3D bar chart, featuring glossy blue and orange rectangular segments, illustrates data progression or comparison. The varying bar heights convey growth or statistical analysis. This modern graphic is ideal for business, finance, and analytical concepts, presented cleanly isolated on a transparent background.
Free with trial This set includes 15 high-quality, vector business icons representing various aspects of finance, networking, and growth. Perfect for websites, presentations, and applications. These simple yet effective icons provide visual clarity and professionalism. Progress decrease illustrations Business Icon Set. This set includes 15 high-quality, vector business icons representing various aspects of finance, networking, and growth. Perfect for websites, presentations, and applications. These simple yet effective icons provide visual clarity and professionalism.
Free with trial A graph showing global sales growth trends on a printed document with multiple colored lines. Progress decrease illustrations Global Sales Growth Chart on Document. A graph showing global sales growth trends on a printed document with multiple colored lines
Free with trial Colorful Charts and Graphs Data Visualization Infographic. Progress decrease illustrations Colorful Charts and Graphs Data Visualization Infographic
Free with trial Hand-drawn financial charts and graphs displayed on a transparent glass board, perfect for business presentations. Progress decrease illustrations Glass Board with Hand-Drawn Financial Charts and Graphs. Hand-drawn financial charts and graphs displayed on a transparent glass board, perfect for business presentations
Free with trial This minimalist vector illustration depicts a human hand holding a pen, actively drawing a downward-trending bar graph. The composition features a clean, flat design style with a neutral white background, emphasizing the red and grey bars. The visual mood is professional and analytical, representing concepts of financial loss, market decline, or negative performance metrics. Progress decrease vectors A hand uses a pen to draw a declining bar chart on a white background. This minimalist vector illustration depicts a human hand holding a pen, actively drawing a downward-trending bar graph. The composition features a clean, flat design style with a neutral white background, emphasizing the red and grey bars. The visual mood is professional and analytical, representing concepts of financial loss, market decline, or negative performance metrics
Free with trial A hand interacting with a graph showing quality increasing and cost decreasing. it represents business success, improvement, and strategic financial planning. Progress decrease illustrations Hand interacting with a quality and cost graph showing increasing quality and decreasing cost. a hand interacting with a graph showing quality increasing and cost decreasing. it represents business success, improvement, and strategic financial planning.