Free with trial A set of twelve colorful icons representing various data visualization methods, including bar charts, pie charts, line graphs, and other visual representations of data analysis. Perfect for presentations, reports, and websites needing clear data insights. Progress decrease illustrations Data Visualization Icons. A set of twelve colorful icons representing various data visualization methods, including bar charts, pie charts, line graphs, and other visual representations of data analysis. Perfect for presentations, reports, and websites needing clear data insights.
Free with trial Night city, red graph decline, road, blurred lights, financial downturn. Progress decrease illustrations Night city, red graph decline, road, blurred lights, financial downturn
Free with trial Abstract Black White Up Down Arrows Growth Chart Business Infographic Design. Generative AI. Progress decrease illustrations Abstract Black White Up Down Arrows Growth Chart Business Infographic Design
Free with trial Set of 16 line icons representing various types of charts, graphs, clocks, and data-related symbols. Perfect for business presentations, reports, or website design. Clean and modern style. Progress decrease illustrations Data Visualization Icons. Set of 16 line icons representing various types of charts, graphs, clocks, and data-related symbols. Perfect for business presentations, reports, or website design. Clean and modern style.
Free with trial A blue arrow pointing upwards next to a bar graph, some bars are broken, symbolizing growth and decline in a business or market. Progress decrease illustrations Blue Arrow and Bar Graph Showing Growth and Decline. A blue arrow pointing upwards next to a bar graph, some bars are broken, symbolizing growth and decline in a business or market
Free with trial An unstable business situation. A businessman flying in a balloon symbolizes success, while another businessman descending symbolizes business failure. Progress decrease vectors The business situation is fluctuating and unstable. An unstable business situation. A businessman flying in a balloon symbolizes success, while another businessman descending symbolizes business failure
Free with trial A blue 3D coin with a downward-pointing arrow is positioned next to ascending green bars. The coin and bars are arranged on a white background, with the bars increasing in height from left to right, representing growth or progress. The combination of elements might symbolize financial or economic trends, with the blue coin indicating a decrease and the green bars suggesting upward momentum or improvement. Progress decrease illustrations Blue coin with down arrow and green growth bars. A blue 3D coin with a downward-pointing arrow is positioned next to ascending green bars. The coin and bars are arranged on a white background, with the bars increasing in height from left to right, representing growth or progress. The combination of elements might symbolize financial or economic trends, with the blue coin indicating a decrease and the green bars suggesting upward momentum or improvement.
Free with trial A green upward arrow and a red downward arrow on a white background, often used to represent growth versus decline, or positive versus negative trends in business, finance, or stock market concepts. Progress decrease illustrations Green up arrow and red down arrow on white background. A green upward arrow and a red downward arrow on a white background, often used to represent growth versus decline, or positive versus negative trends in business, finance, or stock market concepts.
Free with trial A bright green 3D arrow icon is depicted against a clean white background. The arrow is stylized with a thick outline and a slightly angled perspective, clearly indicating a downward direction. The object casts a subtle shadow, adding depth and dimension to the graphic. Progress decrease illustrations 3D Green Arrow Icon Pointing Downward on White Background direction symbol. A bright green 3D arrow icon is depicted against a clean white background. The arrow is stylized with a thick outline and a slightly angled perspective, clearly indicating a downward direction. The object casts a subtle shadow, adding depth and dimension to the graphic
Free with trial Geometric design featuring four overlapping downward arrows with a gradient transitioning from yellow at the top to red at the bottom. Each arrow is uniformly shaped, forming a V with pointed edges and a clean finish. The arrows are symmetrically aligned and progressively change color from top to bottom, creating a smooth visual flow. Set against a plain white background, enhancing the gradient effect and geometric precision. Progress decrease vectors Geometric arrow downward gradient design element. Geometric design featuring four overlapping downward arrows with a gradient transitioning from yellow at the top to red at the bottom. Each arrow is uniformly shaped, forming a V with pointed edges and a clean finish. The arrows are symmetrically aligned and progressively change color from top to bottom, creating a smooth visual flow. Set against a plain white background, enhancing the gradient effect and geometric precision.
Free with trial This graphic features a dynamic composition of overlapping line charts and arrows representing fluctuating economic data. Vibrant green and red lines indicate upward and downward trends, while blue nodes highlight specific data points. A stylized building icon and currency symbol are integrated into the design to signify banking and monetary concepts. The clean, flat aesthetic provides a clear. Progress decrease vectors A colorful illustration showing financial growth and market decline trends. This graphic features a dynamic composition of overlapping line charts and arrows representing fluctuating economic data. Vibrant green and red lines indicate upward and downward trends, while blue nodes highlight specific data points. A stylized building icon and currency symbol are integrated into the design to signify banking and monetary concepts. The clean, flat aesthetic provides a clear
Free with trial This minimalist vector illustration depicts a declining line chart against a clean background. The graphic features a prominent red arrow pointing downward, symbolizing a negative trend or financial loss. The composition uses a professional color palette of muted grays and a bold red accent to highlight the downward movement of the data points. Progress decrease vectors A simple line graph showing a downward trend in business performance metrics. This minimalist vector illustration depicts a declining line chart against a clean background. The graphic features a prominent red arrow pointing downward, symbolizing a negative trend or financial loss. The composition uses a professional color palette of muted grays and a bold red accent to highlight the downward movement of the data points
Free with trial A vibrant blue, transparent, three-dimensional arrow curves and points downward against a clean white background. The arrow has a glossy, smooth finish, and a subtle shadow is visible beneath it, suggesting depth. This graphic element clearly indicates a downward direction or trend. Progress decrease illustrations Blue Transparent Arrow Pointing Downward on a White Background image photo. A vibrant blue, transparent, three-dimensional arrow curves and points downward against a clean white background. The arrow has a glossy, smooth finish, and a subtle shadow is visible beneath it, suggesting depth. This graphic element clearly indicates a downward direction or trend
Free with trial A clean, minimalist set of line art icons representing business and service plan management. The icons depict 'Plan Switch' with a toggle symbol, 'Upgrade' with an upward arrow, and 'Downgrade' with a downward arrow. Another 'Downgrade' icon shows a document transitioning to a dollar sign, indicating a change in service level or cost. These graphics are ideal for websites, apps, presentations, and marketing materials related to subscription services, software features, or financial planning. Progress decrease illustrations Business Plan Icons: Upgrade, Downgrade, and Switch. A clean, minimalist set of line art icons representing business and service plan management. The icons depict 'Plan Switch' with a toggle symbol, 'Upgrade' with an upward arrow, and 'Downgrade' with a downward arrow. Another 'Downgrade' icon shows a document transitioning to a dollar sign, indicating a change in service level or cost. These graphics are ideal for websites, apps, presentations, and marketing materials related to subscription services, software features, or financial planning.
Free with trial A simple yet effective visualization showing data via a pie chart and bar graph Ideal for presentations and reports. Progress decrease illustrations Colorful Pie Chart and Bar Graph Data Visualization. A simple yet effective visualization showing data via a pie chart and bar graph Ideal for presentations and reports
Free with trial Financial candlestick charts showing stock market trading data over an abstract blurred city lights background during nighttime. Progress decrease illustrations Financial market data showing city trading analysis. Financial candlestick charts showing stock market trading data over an abstract blurred city lights background during nighttime
Free with trial A 3D isometric bar chart with a gradient color scheme from blue to red and orange, depicting a downward trend. The bars are arranged in descending order of height, set against a clean white background. This visual represents data analysis, financial decline, or a negative trend. Progress decrease illustrations Isometric Gradient Bar Chart Showing Decline on White Background graph data. A 3D isometric bar chart with a gradient color scheme from blue to red and orange, depicting a downward trend. The bars are arranged in descending order of height, set against a clean white background. This visual represents data analysis, financial decline, or a negative trend
Free with trial A 3d rendered clock icon with a red downward arrow, isolated on black background. Progress decrease vectors Clock icon with downward arrow blue red 3d render. a 3d rendered clock icon with a red downward arrow, isolated on black background
Free with trial A captivating arrangement of white blocks displaying percentage values, symbolizing statistical data analysis. Perfect for business and finance projects. Progress decrease illustrations White Percentage Blocks Representing Statistical Data and Trends. A captivating arrangement of white blocks displaying percentage values, symbolizing statistical data analysis. Perfect for business and finance projects
Free with trial A collection of colorful 3D financial graphics on a white background. This includes a rising candlestick chart with red and green bars, a segmented pie chart with four colors, and a circular segmented chart with five colors. Progress decrease illustrations Colorful 3D Financial Charts and Graphs on White Background finance business. A collection of colorful 3D financial graphics on a white background. This includes a rising candlestick chart with red and green bars, a segmented pie chart with four colors, and a circular segmented chart with five colors
Free with trial Abstract 3D render of a colorful descending bar chart with cubes. Perfect for data visualization, business presentations, or illustrating trends. Representing financial, statistical or marketing information. Progress decrease illustrations Colorful 3D Bar Chart, Data Visualization Concept. Abstract 3D render of a colorful descending bar chart with cubes. Perfect for data visualization, business presentations, or illustrating trends. Representing financial, statistical or marketing information.
Free with trial This 3D illustration features a series of vertical bars arranged in a descending sequence, representing a decline in data. A smooth, continuous line graph follows the top of the bars, emphasizing the negative trajectory. The color palette uses shades of blue and light gray against a clean white background, creating a professional and minimalist aesthetic suitable for financial or analytical. Progress decrease vectors A three dimensional bar chart showing a downward trend with a line graph overlay. This 3D illustration features a series of vertical bars arranged in a descending sequence, representing a decline in data. A smooth, continuous line graph follows the top of the bars, emphasizing the negative trajectory. The color palette uses shades of blue and light gray against a clean white background, creating a professional and minimalist aesthetic suitable for financial or analytical
Free with trial A modern minimalist digital illustration depicts an oval-shaped light bulb with a curved top and pointed bottom containing a three-dimensional bar graph showing a clear downward trend with bars of varying heights representing different business metrics decreasing in value against a clean background symbolizing negative performance, decline, or economic downturn in corporate or financial contexts. Progress decrease illustrations Modern light bulb icon with declining bar graph inside representing business concept and negative trend. A modern minimalist digital illustration depicts an oval-shaped light bulb with a curved top and pointed bottom containing a three-dimensional bar graph showing a clear downward trend with bars of varying heights representing different business metrics decreasing in value against a clean background symbolizing negative performance, decline, or economic downturn in corporate or financial contexts
Free with trial A line art illustration isolated on white background displays business performance indicators: a speedometer, arrows, a bar graph, and a line graph, all in a minimalist style. Progress decrease vectors Vector art of line art illustration of business performance indicators featuring a speedometer, arrows, bar graph, and line graph. A line art illustration isolated on white background displays business performance indicators: a speedometer, arrows, a bar graph, and a line graph, all in a minimalist style
Free with trial This image showcases a variety of modern, flat-design charts and graphs commonly used in business, finance, and data analysis. It includes bar charts, pie charts, and line graphs, presented in a clean, minimalist style with teal and gray color accents. These visual representations are ideal for illustrating trends, statistics, performance, and financial data in presentations, reports, and web content. Progress decrease illustrations Collection of Business and Financial Charts and Graphs. This image showcases a variety of modern, flat-design charts and graphs commonly used in business, finance, and data analysis. It includes bar charts, pie charts, and line graphs, presented in a clean, minimalist style with teal and gray color accents. These visual representations are ideal for illustrating trends, statistics, performance, and financial data in presentations, reports, and web content.
Free with trial Value slider shows a hand adjusting a control from minimum to maximum representing business growth performance optimization and strategic decision making for financial investment success indicating a. Progress decrease illustrations Value slider control max min business technology finance investment growth performance indicator optimization. Value slider shows a hand adjusting a control from minimum to maximum representing business growth performance optimization and strategic decision making for financial investment success indicating a
Free with trial A clean, minimalist 3D rendering of a descending bar graph composed of sleek, white rectangular prisms. The graph is set against a bright, neutral background, creating a modern and versatile image ideal for presentations, reports, or website design related to business, finance, or data visualization. The image offers a clean, uncluttered aesthetic. Progress decrease illustrations Abstract White Bar Graph: Minimalist 3D Render. A clean, minimalist 3D rendering of a descending bar graph composed of sleek, white rectangular prisms. The graph is set against a bright, neutral background, creating a modern and versatile image ideal for presentations, reports, or website design related to business, finance, or data visualization. The image offers a clean, uncluttered aesthetic.
Free with trial Elderly woman suffers from dementia and memory loss and is in need of specialized caregivers. Sad female pensioner is sick with dementia due to advancing age or lot of psychological stress in youth. Progress decrease vectors Elderly woman suffers from dementia and memory loss and is in need of specialized caregivers
Free with trial Financial decision and interest rate change concept, wooden blocks showing percentage symbol with green upward and red downward arrows. Progress decrease illustrations Financial decision and interest rate change concept
Free with trial Financial decision and interest rate change concept, wooden blocks showing percentage symbol with green upward and red downward arrows. Progress decrease illustrations Financial decision and interest rate change concept
Free with trial Financial decision and interest rate change concept, wooden blocks showing percentage symbol with green upward and red downward arrows. Progress decrease illustrations Financial decision and interest rate change concept
Free with trial Financial decision and interest rate change concept, wooden blocks showing percentage symbol with green upward and red downward arrows. Progress decrease illustrations Financial decision and interest rate change concept
Free with trial Close-up view of financial charts in shades of blue with two pens resting on the document. The charts display various lines and bar graphs indicating data trends. The image has a cool tone and a shallow depth of field. Progress decrease illustrations Closeup Blue Financial Charts Two Pens Business Data Analysis Report Graphs Statistics business report. Close-up view of financial charts in shades of blue with two pens resting on the document. The charts display various lines and bar graphs indicating data trends. The image has a cool tone and a shallow depth of field
Free with trial A collection of six black depicting various business analytics charts and graphs, including bar charts, a pie chart, and line graphs on presentation boards. Progress decrease vectors Black analytics chart and graph on white background. A collection of six black depicting various business analytics charts and graphs, including bar charts, a pie chart, and line graphs on presentation boards
Free with trial A dynamic collection of eight distinct dollar sign symbols, each uniquely rendered in a bold, grunge, and street art style. Featuring dripping ink effects, distressed textures, and halftone patterns, these black and white icons are integrated with various arrows depicting financial trends. The arrows illustrate upward growth, downward decline, and fluctuating market movements, conveying concepts of profit, loss, and economic change. This versatile set is perfect for modern designs related to finance, investment, business, and urban culture, suitable for web, print, and creative projects. Progress decrease vectors Grunge Dollar Signs with Financial Trend Arrows Set. A dynamic collection of eight distinct dollar sign symbols, each uniquely rendered in a bold, grunge, and street art style. Featuring dripping ink effects, distressed textures, and halftone patterns, these black and white icons are integrated with various arrows depicting financial trends. The arrows illustrate upward growth, downward decline, and fluctuating market movements, conveying concepts of profit, loss, and economic change. This versatile set is perfect for modern designs related to finance, investment, business, and urban culture, suitable for web, print, and creative projects.
Free with trial A gleaming golden arrow is depicted in a 3D render, angled downwards and to the right. The arrow has a hollow, geometric design with sharp edges, reflecting light and appearing highly polished. It casts a subtle shadow on the clean white background, emphasizing its three-dimensional form and isolation. Progress decrease illustrations Shiny Golden Arrow Pointing Downwards on a White Background direction decline. A gleaming golden arrow is depicted in a 3D render, angled downwards and to the right. The arrow has a hollow, geometric design with sharp edges, reflecting light and appearing highly polished. It casts a subtle shadow on the clean white background, emphasizing its three-dimensional form and isolation
Free with trial A comprehensive vector icon set featuring essential symbols for business, finance, time management, and status indicators. The collection includes icons representing growth, trends, success, failure, deadlines, time tracking, and financial assets like coin stacks and currency. Designed in a clean, flat style, these versatile pictograms are ideal for web interfaces, mobile applications, presentations, infographics, and various digital projects requiring clear visual communication of progress, results, and financial concepts. Perfect for illustrating reports, dashboards, or user feedback. Progress decrease vectors Business, Time, and Financial Status Vector Icons Set. A comprehensive vector icon set featuring essential symbols for business, finance, time management, and status indicators. The collection includes icons representing growth, trends, success, failure, deadlines, time tracking, and financial assets like coin stacks and currency. Designed in a clean, flat style, these versatile pictograms are ideal for web interfaces, mobile applications, presentations, infographics, and various digital projects requiring clear visual communication of progress, results, and financial concepts. Perfect for illustrating reports, dashboards, or user feedback.
Free with trial Bar graph growth and decline icon in flat style. Up and down arrow chart symbol. Infographic elements illustration. Progress decrease vectors Bar graph growth and decline icon in flat style. Up and down arrow chart symbol. Infographic elements
Free with trial Bar chart is showing growth and decline with blue and purple bars. Progress decrease vectors Blue and purple bar chart showing growth and decline. Bar chart is showing growth and decline with blue and purple bars
Free with trial Up and Down Arrows Choice Decision Direction Concept, illustration. Progress decrease illustrations Up and Down Arrows Choice Decision Direction Concept
Free with trial Financial data chart, glowing lines, digital display. Stock image showing trends. Progress decrease illustrations Digital financial graph with candlestick chart, data analytics, stock market trend, technology concept. Financial data chart, glowing lines, digital display. Stock image showing trends
Free with trial A 3D rendered bar graph composed of six vertical bars arranged in a descending sequence. The bars transition in color from a deep blue at the tallest end to a bright orange at the shortest end, showcasing a gradient of blues, purples, and reds. The graph is set against a clean white background with subtle shading, emphasizing the visual representation of a declining trend. Progress decrease illustrations Decreasing Bar Graph with Gradient Colors on White Background chart statistics. A 3D rendered bar graph composed of six vertical bars arranged in a descending sequence. The bars transition in color from a deep blue at the tallest end to a bright orange at the shortest end, showcasing a gradient of blues, purples, and reds. The graph is set against a clean white background with subtle shading, emphasizing the visual representation of a declining trend
Free with trial A grid of diverse icons representing different types of charts and graphs, including bar, line, and pie charts, symbolizing data analysis and business performance metrics. Progress decrease vectors Collection of various business and financial chart icons. A grid of diverse icons representing different types of charts and graphs, including bar, line, and pie charts, symbolizing data analysis and business performance metrics
Free with trial A vibrant bar graph graphic with a gradient of colors, representing data visualization and statistical analysis. The bars vary in height, indicating different values or categories. The image is set against a clean white background, making it suitable for a variety of applications, including presentations, reports, and website design. The color palette adds visual interest and can be used to represent trends, comparisons, or performance metrics. Progress decrease illustrations Colorful Bar Graph Illustrating Data and Statistics. A vibrant bar graph graphic with a gradient of colors, representing data visualization and statistical analysis. The bars vary in height, indicating different values or categories. The image is set against a clean white background, making it suitable for a variety of applications, including presentations, reports, and website design. The color palette adds visual interest and can be used to represent trends, comparisons, or performance metrics.
Free with trial A red zigzag arrow points downwards, descending a staircase made of beige blocks against a light blue background , image generative using ai tools. Progress decrease illustrations Red downward trending arrow on a staircase of blocks. A red zigzag arrow points downwards, descending a staircase made of beige blocks against a light blue background , image generative using ai tools
Free with trial The image features a 3D bar graph showing an upward trend in growth, represented by increasing bar heights, followed by a sharp decline indicated by a downward arrow. A green upward arrow emphasizes the growth phase, while a downward arrow highlights the decline phase. Progress decrease illustrations Growth and decline illustrated with bar graph and arrows. The image features a 3D bar graph showing an upward trend in growth, represented by increasing bar heights, followed by a sharp decline indicated by a downward arrow. A green upward arrow emphasizes the growth phase, while a downward arrow highlights the decline phase
Free with trial This minimalist graphic illustration features a bold red line chart trending downwards against a clean background. Several small downward-pointing arrows are positioned along the slope to emphasize the decline. The composition uses a flat design aesthetic with high contrast, conveying a clear message of loss, reduction, or negative performance in a professional context. Progress decrease vectors A red line graph showing a sharp downward trend with multiple directional arrows. This minimalist graphic illustration features a bold red line chart trending downwards against a clean background. Several small downward-pointing arrows are positioned along the slope to emphasize the decline. The composition uses a flat design aesthetic with high contrast, conveying a clear message of loss, reduction, or negative performance in a professional context
Free with trial 3D rendered pyramid chart with a pie chart overlay and data icons on a light background. Useful for infographics and business presentations. Progress decrease illustrations 3d pyramid infographic with pie chart and data icons. 3D rendered pyramid chart with a pie chart overlay and data icons on a light background. Useful for. 3D rendered pyramid chart with a pie chart overlay and data icons on a light background. Useful for infographics and business presentations
Free with trial A set of sixteen modern line icons depicting various business and finance concepts, including graphs, charts, planning, ideas, and global connectivity. Perfect for presentations, reports, and websites. Progress decrease vectors Collection of Business and Finance Line Icons Set. A set of sixteen modern line icons depicting various business and finance concepts, including graphs, charts, planning, ideas, and global connectivity. Perfect for presentations, reports, and websites.
Free with trial Reduce inflation by increase interest rate, Entrepreneur using a needle to pop a balloon representing inflation with a price tag attached. Progress decrease vectors Reduce inflation by increase interest rate, Entrepreneur using a needle to pop a balloon representing inflation with a price tag
Free with trial The image depicts two bar graphs side by side. The left graph shows an upward trend with green bars increasing in height from left to right, accompanied by a green upward arrow, and is labeled 'Growth. ' The right graph shows a downward trend with red bars decreasing in height from left to right, accompanied by a red downward arrow, and is labeled 'Decline. ' The visual effectively contrasts the. Progress decrease illustrations Illustrative comparison of growth and decline trends. The image depicts two bar graphs side by side. The left graph shows an upward trend with green bars increasing in height from left to right, accompanied by a green upward arrow, and is labeled 'Growth.' The right graph shows a downward trend with red bars decreasing in height from left to right, accompanied by a red downward arrow, and is labeled 'Decline.' The visual effectively contrasts the
Free with trial This image displays two distinct charts illustrating annual revenue performance over quarters. The left chart features a line graph with shaded areas, showing trends and cumulative revenue. The right chart presents a bar graph with stacked segments, offering a clear comparison of revenue contributions across different quarters. Both charts use a clean, modern design with blue, green, and gray color palettes, suitable for business presentations, financial reports, and data visualization. Progress decrease illustrations Annual Revenue Performance Charts: Line and Bar Graphs. This image displays two distinct charts illustrating annual revenue performance over quarters. The left chart features a line graph with shaded areas, showing trends and cumulative revenue. The right chart presents a bar graph with stacked segments, offering a clear comparison of revenue contributions across different quarters. Both charts use a clean, modern design with blue, green, and gray color palettes, suitable for business presentations, financial reports, and data visualization.
Free with trial A striking, three-dimensional number '7' is prominently displayed against a dark, gradient background. The numeral is rendered in a clean, modern style with sharp edges and a subtle highlight, suggesting depth and volume. The lighting creates a dramatic effect, with shadows cast on the background, emphasizing the numeral's presence. This image is ideal for concepts related to numbers, counting, achievements, rankings, or any context where the number seven holds significance. Progress decrease illustrations Bold Number 7 Illuminated on Dark Gradient Background. A striking, three-dimensional number '7' is prominently displayed against a dark, gradient background. The numeral is rendered in a clean, modern style with sharp edges and a subtle highlight, suggesting depth and volume. The lighting creates a dramatic effect, with shadows cast on the background, emphasizing the numeral's presence. This image is ideal for concepts related to numbers, counting, achievements, rankings, or any context where the number seven holds significance.
Free with trial A collection of eight black silhouette representing various business analytics charts, including bar graphs, pie charts, and line graphs, against a white background. Progress decrease vectors Set of black silhouette for business analytics charts. A collection of eight black silhouette representing various business analytics charts, including bar graphs, pie charts, and line graphs, against a white background
Free with trial This image depicts a hand-drawn or sketched line graph illustrating a general upward trend with significant fluctuations and sharp peaks. The graph shows a series of rapid increases and decreases, indicating volatility in the data, but overall points to a positive growth trajectory. The peaks are pronounced, suggesting periods of high activity or spikes in whatever variable is being measured. Progress decrease illustrations Spiking upward trend line graph with volatility peaks. This image depicts a hand-drawn or sketched line graph illustrating a general upward trend with significant fluctuations and sharp peaks. The graph shows a series of rapid increases and decreases, indicating volatility in the data, but overall points to a positive growth trajectory. The peaks are pronounced, suggesting periods of high activity or spikes in whatever variable is being measured
Free with trial A simple blue line graph with circular data points is displayed against a clean white background with subtle horizontal grid lines. The graph shows fluctuations and trends, making it suitable for representing data, analytics, or financial performance. Generated by AI. Progress decrease vectors Blue Line Graph with Data Points on White Background. A simple blue line graph with circular data points is displayed against a clean white background with subtle horizontal grid lines. The graph shows fluctuations and trends, making it suitable for representing data, analytics, or financial performance. Generated by AI
Free with trial Two distinct green, pixelated arrows are presented vertically on a white background. The top arrow points upwards, constructed from stacked cubes, while the bottom arrow points downwards, also formed from a pixelated cube structure. The arrows are identical in style and color, representing opposing directions or concepts. Progress decrease illustrations Two Green Pixelated Arrows Pointing Up and Down on White Background image photo. Two distinct green, pixelated arrows are presented vertically on a white background. The top arrow points upwards, constructed from stacked cubes, while the bottom arrow points downwards, also formed from a pixelated cube structure. The arrows are identical in style and color, representing opposing directions or concepts
Free with trial A line graph depicting a downward trend, symbolizing a decline in performance, sales, or economic activity, often used in business and financial contexts. Progress decrease vectors Vector art of a line graph showing a downward trend, , indicating a decline in performance, sales, or economic activity in a. A line graph depicting a downward trend, symbolizing a decline in performance, sales, or economic activity, often used in business and financial contexts
Free with trial Two distinct 3D rendered arrow icons are positioned against a soft, light gray background. A vibrant purple arrow points upwards, signifying an increase or positive direction. Adjacent to it, a pastel pink arrow points downwards, indicating a decrease or negative direction. The icons are smooth and rounded, presented in a clean, minimalist style. Progress decrease illustrations Purple Up Arrow and Pink Down Arrow Icons on a Light Gray Background direction choice. Two distinct 3D rendered arrow icons are positioned against a soft, light gray background. A vibrant purple arrow points upwards, signifying an increase or positive direction. Adjacent to it, a pastel pink arrow points downwards, indicating a decrease or negative direction. The icons are smooth and rounded, presented in a clean, minimalist style
Free with trial A minimalist black outline arrow pointing directly downwards, set against a clean white background. This simple graphic element is ideal for indicating direction, flow, download, reduction, or a downward trend. Its clean design makes it versatile for various digital and print applications, including user interfaces, presentations, infographics, and instructional materials. The clear, uncluttered composition ensures easy integration into any project. Generated by AI. Progress decrease illustrations Vertical Downward Arrow Line Icon on White Background. A minimalist black outline arrow pointing directly downwards, set against a clean white background. This simple graphic element is ideal for indicating direction, flow, download, reduction, or a downward trend. Its clean design makes it versatile for various digital and print applications, including user interfaces, presentations, infographics, and instructional materials. The clear, uncluttered composition ensures easy integration into any project. Generated by AI
Free with trial Financial Growth Represented by Coins and Dynamic Charts. Progress decrease illustrations Financial Growth Represented by Coins and Dynamic Charts
Free with trial This image showcases vibrant 3D bar and pie charts illustrating upward trending business growth and financial success. Perfect for presentations or reports. Progress decrease illustrations Colorful 3D Bar Charts and Pie Charts Showing Business Growth. This image showcases vibrant 3D bar and pie charts illustrating upward trending business growth and financial success. Perfect for presentations or reports.
Free with trial A colorful, hand-drawn illustration depicting a large percentage symbol surrounded by various financial and statistical icons. This doodle-style artwork includes bar graphs, pie charts, stacks of coins, dollar signs, and arrows indicating growth and decline. The sketch effectively visualizes concepts like interest rates, economic trends, business analytics, investment returns, and market data. Isolated on a white background, this versatile image is perfect for presentations, infographics, financial reports, and educational materials related to business, finance, and statistics. Progress decrease illustrations Hand Drawn Finance and Percentage Concept Illustration. A colorful, hand-drawn illustration depicting a large percentage symbol surrounded by various financial and statistical icons. This doodle-style artwork includes bar graphs, pie charts, stacks of coins, dollar signs, and arrows indicating growth and decline. The sketch effectively visualizes concepts like interest rates, economic trends, business analytics, investment returns, and market data. Isolated on a white background, this versatile image is perfect for presentations, infographics, financial reports, and educational materials related to business, finance, and statistics.
Free with trial Global economic slowdown, businessman is using a slow snail to represent the gradual growth of GDP in the world economy. Progress decrease vectors Global economic slowdown, businessman is using a slow snail to represent the gradual growth of GDP in the world economy
Free with trial This vector illustration features a comprehensive set of modern infographic and decision-making elements, isolated on a clean white background with subtle reflections. The collection includes stylized casino chips marked "YES" and "NO" for choices, various bar charts depicting growth and data, and segmented donut pie charts representing proportions. An abstract 3D shape adds a contemporary touch. Ideal for presentations, business reports, websites, and applications requiring visual representation of data, statistics, polls, and strategic decisions in a clean, professional design. Progress decrease vectors Business Infographics and Decision Making Elements Set. This vector illustration features a comprehensive set of modern infographic and decision-making elements, isolated on a clean white background with subtle reflections. The collection includes stylized casino chips marked "YES" and "NO" for choices, various bar charts depicting growth and data, and segmented donut pie charts representing proportions. An abstract 3D shape adds a contemporary touch. Ideal for presentations, business reports, websites, and applications requiring visual representation of data, statistics, polls, and strategic decisions in a clean, professional design.
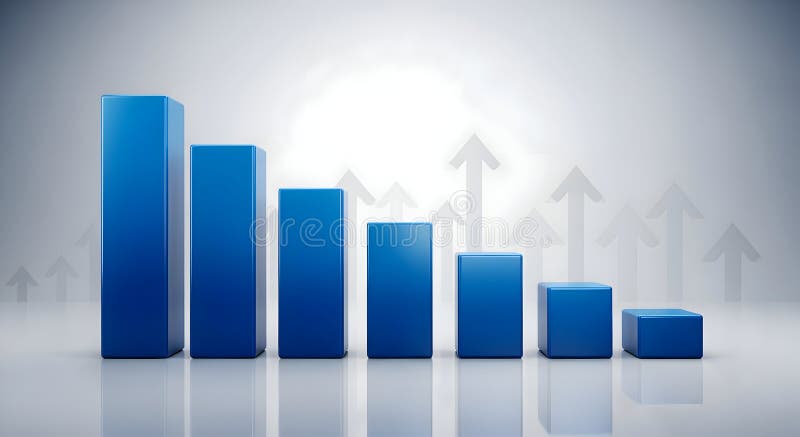
Free with trial A 3D render of a blue bar chart displaying a downward trend, with bars decreasing in height from left to right. The background features a subtle pattern of translucent upward-pointing arrows, suggesting growth or recovery despite the current decline. The scene is set against a clean, gradient gray backdrop with reflections, creating a modern and professional aesthetic. This image is ideal for representing financial downturns, market analysis, economic challenges, or the concept of overcoming obstacles. Progress decrease illustrations Declining Blue Bar Chart with Upward Arrows Background. A 3D render of a blue bar chart displaying a downward trend, with bars decreasing in height from left to right. The background features a subtle pattern of translucent upward-pointing arrows, suggesting growth or recovery despite the current decline. The scene is set against a clean, gradient gray backdrop with reflections, creating a modern and professional aesthetic. This image is ideal for representing financial downturns, market analysis, economic challenges, or the concept of overcoming obstacles.
Free with trial A digital bar chart displayed on a dark blue screen with a grid overlay. The bars are predominantly blue, with some white bars indicating significant spikes. The chart fluctuating data with reflections on the glossy surface below. Numbers and percentages are visible on the grid lines. Progress decrease illustrations Blue digital bar chart with grid and reflections graph. A digital bar chart displayed on a dark blue screen with a grid overlay. The bars are predominantly blue, with some white bars indicating significant spikes. The chart fluctuating data with reflections on the glossy surface below. Numbers and percentages are visible on the grid lines
Free with trial A collection of nine flat vector icons for data visualization including bar graphs, line charts, pie charts, and performance meters isolated on a white background. Progress decrease vectors Simple black data analysis and business chart icon set. A collection of nine flat vector icons for data visualization including bar graphs, line charts, pie charts, and performance meters isolated on a white background
Free with trial Simple Bar Chart Showing Business Growth and Data Trends. Progress decrease vectors Simple Bar Chart Showing Business Growth and Data Trends
Free with trial Two identical green 3D arrows are positioned vertically on a white background. Both arrows are pointing directly downwards. The top arrow is positioned above the bottom arrow, creating a sense of sequence or progression. The arrows have a smooth, rounded appearance and cast subtle shadows. Progress decrease illustrations Two Green 3D Arrows Pointing Downward on a White Background down arrow direction. Two identical green 3D arrows are positioned vertically on a white background. Both arrows are pointing directly downwards. The top arrow is positioned above the bottom arrow, creating a sense of sequence or progression. The arrows have a smooth, rounded appearance and cast subtle shadows
Free with trial A bold green arrow symbol pointing downwards, presented as an isolated object on a white background for easy integration into designs. Progress decrease illustrations Green arrow pointing down isolated on white background. A bold green arrow symbol pointing downwards, presented as an isolated object on a white background for easy integration into designs
Free with trial 3d bar graph illustrating financial growth with upward green arrow and downward red arrows indicating trends. Progress decrease vectors Bar graph rising with arrows showing increase decrease. 3d bar graph illustrating financial growth with upward green arrow and downward red arrows indicating trends
Free with trial Laptop displaying a bar chart indicating growth and analysis ,Generative ai. Progress decrease illustrations Laptop with bar chart, visualizing growth, analysis, and business trends. Laptop displaying a bar chart indicating growth and analysis ,Generative ai
Free with trial Red cube with arrow up. Business and market growth concept. Close-up. Progress decrease illustrations Red cube with arrow up. Business and market growth concept
Free with trial Red cube with arrow up. Business and market growth concept. Close-up. Progress decrease illustrations Red cube with arrow up. Business and market growth concept
Free with trial Red cube with arrow up. Business and market growth concept. Close-up. Progress decrease illustrations Red cube with arrow up. Business and market growth concept
Free with trial A dynamic black and white background pattern featuring a collection of hand-drawn financial and economic elements. The design includes various currency symbols like the Dollar, Euro, and Yen, alongside upward and downward arrows, zig-zag lines representing market volatility, and simple bar charts indicating growth or decline. Scattered ink splatters add a grunge, artistic touch to the overall composition. This versatile illustration is ideal for conveying concepts related to global finance, business trends, investment, stock market fluctuations, economic data, and wealth management in a creative and engaging way. Progress decrease vectors Hand Drawn Financial Market Elements Background Pattern. A dynamic black and white background pattern featuring a collection of hand-drawn financial and economic elements. The design includes various currency symbols like the Dollar, Euro, and Yen, alongside upward and downward arrows, zig-zag lines representing market volatility, and simple bar charts indicating growth or decline. Scattered ink splatters add a grunge, artistic touch to the overall composition. This versatile illustration is ideal for conveying concepts related to global finance, business trends, investment, stock market fluctuations, economic data, and wealth management in a creative and engaging way.
Free with trial A minimalist black and white icon representing a bar graph. The graph features several vertical bars of varying heights, arranged in a sequence that initially ascends to a peak and then descends. This versatile graphic symbolizes data, statistics, growth, decline, trends, and analysis. Its clean design makes it suitable for presentations, reports, websites, and applications related to finance, business, technology, and research. Progress decrease vectors Black Bar Graph Icon with Ascending and Descending Bars. A minimalist black and white icon representing a bar graph. The graph features several vertical bars of varying heights, arranged in a sequence that initially ascends to a peak and then descends. This versatile graphic symbolizes data, statistics, growth, decline, trends, and analysis. Its clean design makes it suitable for presentations, reports, websites, and applications related to finance, business, technology, and research.
Free with trial A 3D rendered image of a solid, light purple arrow pointing directly downwards. The arrow has a smooth, matte finish and is positioned on a plain, light purple background. The lighting creates a subtle shadow beneath the arrow, giving it a sense of depth. Progress decrease illustrations 3D rendered light purple arrow pointing downwards on a plain background direction. A 3D rendered image of a solid, light purple arrow pointing directly downwards. The arrow has a smooth, matte finish and is positioned on a plain, light purple background. The lighting creates a subtle shadow beneath the arrow, giving it a sense of depth