Free with trial The "Vector Up and Down Graph Icon" is a graphic symbol designed to represent data trends, changes, or comparisons within a graph or chart. Progress decrease vectors Vector Up And Down Graph Icon. Up And Down Chart Icon. Growth Diagram Icon. The "Vector Up and Down Graph Icon" is a graphic symbol designed to represent data trends, changes, or comparisons within a graph or chart.
Free with trial Four distinct 3D graphs illustrating different data trends and representations, featuring upward and downward movements. Progress decrease illustrations Collection of 3d graphs showing various trends and data representations isolated on transparent background. Four distinct 3D graphs illustrating different data trends and representations, featuring upward and downward movements
Free with trial Bar graph depicting a decline, representing economic downturn, stock market decline, and company insolvency with a dropping red arrow. Progress decrease vectors Bar chart illustrating a downward trend, symbolizing financial loss, market crash, and business failure with a falling red arrow. Bar graph depicting a decline, representing economic downturn, stock market decline, and company insolvency with a dropping red arrow
Free with trial The "Vector Up and Down Graph Icon" is a graphic symbol designed to represent data trends, changes, or comparisons within a graph or chart. Progress decrease vectors Vector Up And Down Graph Icon. Up And Down Chart Icon. Growth Diagram Icon. The "Vector Up and Down Graph Icon" is a graphic symbol designed to represent data trends, changes, or comparisons within a graph or chart
Free with trial Flat design illustration showing colorful bar graph combined with a line chart, both displaying data trends against a simple black background. Progress decrease vectors Colorful Bar Graph and Line Chart on Black Background Illustrating Data Analysis and Trends. Flat design illustration showing colorful bar graph combined with a line chart, both displaying data trends against a simple black background.
Free with trial Downward glowing arrow over planet earth. Concept showing global economic crisis or financial downturn. Digital data visualization for business analysis. Progress decrease illustrations Downward glowing arrow over planet earth. Concept showing global economic crisis or financial downturn
Free with trial Performance showing colorful graph with magnifying glass and pie chart on white background keywords: graph, chart, data, analytics, statistics. Progress decrease illustrations Colorful graph with magnifying glass and pie chart on white background Keywords: graph, chart, data, analytics
Free with trial A 3D bar graph displays a downward trend represented by a red arrow. The bars are composed of orange, green, and red cubes, illustrating fluctuating data points. The overall mood is one of decline or setback. Progress decrease illustrations Red Arrow Downward Trend Chart Showing Decreasing Business Growth Statistics with Green Orange. A 3D bar graph displays a downward trend represented by a red arrow. The bars are composed of orange, green, and red cubes, illustrating fluctuating data points. The overall mood is one of decline or setback
Free with trial A bold red arrow with a textured, brush-like edge points diagonally downwards against a stark black backdrop. Progress decrease vectors Bright red arrow pointing down with rough edges isolated on a transparent background direction. A bold red arrow with a textured, brush-like edge points diagonally downwards against a stark black backdrop
Free with trial Wooden blocks spell out CO2. A hand adds a block with a downward green arrow, signifying a decrease in carbon emissions. Progress decrease illustrations Hand places a green arrow down block next to co2 blocks symbolizing carbon emission reduction. Wooden blocks spell out CO2. A hand adds a block with a downward green arrow, signifying a decrease in carbon emissions
Free with trial Green glossy arrow pointing upwards isolated on white background. Direction guide. Close-up. Progress decrease illustrations Green glossy arrow pointing upwards isolated on white background. Direction guide
Free with trial Green glossy arrow pointing upwards isolated on white background. Direction guide. Close-up. Progress decrease illustrations Green glossy arrow pointing upwards isolated on white background. Direction guide
Free with trial Green glossy arrow pointing upwards isolated on white background. Direction guide. Close-up. Progress decrease illustrations Green glossy arrow pointing upwards isolated on white background. Direction guide
Free with trial Green glossy arrow pointing upwards isolated on white background. Direction guide. Close-up. Progress decrease illustrations Green glossy arrow pointing upwards isolated on white background. Direction guide
Free with trial Descending bar graph icon with downward arrow, decline in sales or profits, loss chart, bad investment. Progress decrease vectors Descending bar graph icon with downward arrow, decline in sales or profits, loss chart, bad investment
Free with trial Green screen chart analysis, data visualization, metrics tracking, business growth ,Generative ai. Progress decrease illustrations Green screen chart analysis, datadriven insights for business growth and performance tracking. Green screen chart analysis, data visualization, metrics tracking, business growth ,Generative ai
Free with trial Bar chart illustration showing a downward trend with a red arrow indicating a significant drop in values. Progress decrease vectors Bar chart illustration showing a downward trend with a red arrow indicating a significant drop in values
Free with trial Graphic icon shows two squares with directional arrows suggesting scaling or responsiveness within systems. Flat illustration on black. Progress decrease vectors Scalability Vector Illustration: Square Expanding and Contracting Graphic on Black Background. Graphic icon shows two squares with directional arrows suggesting scaling or responsiveness within systems. Flat illustration on black.
Free with trial Colorful data charts, graphs, and infographics on white background, illustrating business analytics, breathtaking wallpaper background Generative AI. Progress decrease illustrations Colorful data charts, graphs, and infographics on white background, illustrating business analytics
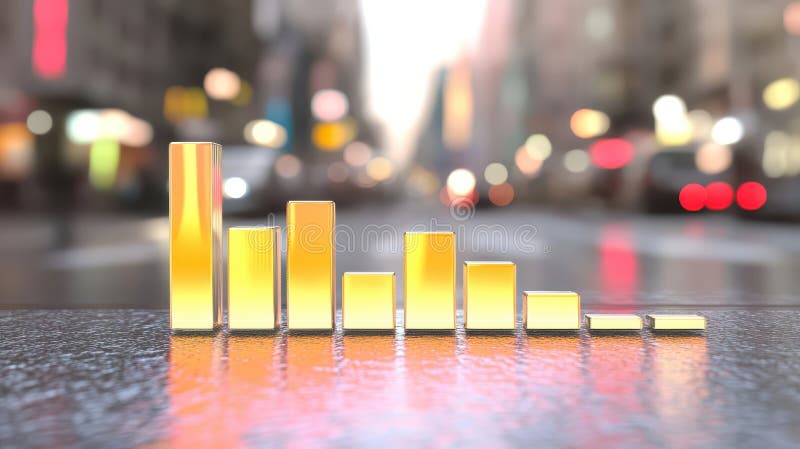
Free with trial Close-up view of city street with bar chart overlay, visualizing urban data analysis ,Generative AI. Progress decrease illustrations Urban data analysis, closeup view of city street with bar chart visualization closeup. Close-up view of city street with bar chart overlay, visualizing urban data analysis ,Generative AI
Free with trial Futuristic red stock market graph showing a sharp decline in business and finance Digital Display. Progress decrease illustrations Red Stock Market Decline Graph Digital Display Futuristic Technology Finance Business Data Chart. Futuristic red stock market graph showing a sharp decline in business and finance Digital Display
Free with trial Black and white icon representing a bar graph with rising and falling values indicated by arrows. Progress decrease illustrations Simple bar graph icon with arrows. Black and white icon representing a bar graph with rising and falling values indicated by arrows
Free with trial High and Low Percent arrow icon logo sign vector outline in black and white color. Progress decrease vectors High and Low Percent arrow icon logo set vector. High and Low Percent arrow icon logo sign vector outline in black and white color
Free with trial This is an detailed set of line icons showing asset management techniques, cryptocurrency market trends, and professional trading chart indicators. Progress decrease vectors Asset management and cryptocurrency trading icons featuring candlestick charts and trend indicators. This is an detailed set of line icons showing asset management techniques, cryptocurrency market trends, and professional trading chart indicators
Free with trial This striking visual depicts a steep downturn in data, signifying negative trends and potential instability within the economic landscape. Progress decrease illustrations Dramatic red arrow pointing downward on financial chart representing market decline and economic loss. This striking visual depicts a steep downturn in data, signifying negative trends and potential instability within the economic landscape
Free with trial Isometric design of user profiles with upward and downward arrows symbolizing change or growth. Progress decrease vectors Isometric user avatars with arrows. Isometric design of user profiles with upward and downward arrows symbolizing change or growth
Free with trial Man in a beige brown shirt and jeans holding a paper with charts and business reports, isolated white background. AI-generated. Progress decrease illustrations Close up of hands holding a paper sheet with colorful business charts and graphs. Man in a beige brown shirt and jeans holding a paper with charts and business reports, isolated white background. AI-generated
Free with trial A symbolic pathway leading toward a goal, representing strategic planning, financial growth and long-term business development. Progress decrease illustrations AI generated Business direction and strategic growth concept with pathway and target, financial planning. A symbolic pathway leading toward a goal, representing strategic planning, financial growth and long-term business development
Free with trial PNG 3D Bar Chart Data Visualization Business Analytics Performance Metrics Colorful Graph against transparent Background. Progress decrease illustrations PNG 3D Bar Chart Data Visualization Business Analytics Performance Metrics Colorful Graph against transparent Background
Free with trial A neon bar chart with downward arrow showing decline in data, glowing pink and blue on black background. Generative AI. Progress decrease illustrations Neon bar chart with downward arrow showing decline in data glowing pink and blue on black background. A neon bar chart with downward arrow showing decline in data, glowing pink and blue on black background. Generative AI
Free with trial A man is giving a business presentation, pointing to a graph on a whiteboard. He is using a laptop and explaining the data. The scene is set in an office. Progress decrease illustrations Business presentation with a man pointing to a graph isolated on white background. A man is giving a business presentation, pointing to a graph on a whiteboard. He is using a laptop and explaining the data. The scene is set in an office
Free with trial Futuristic data visualization dashboards with various charts and graphs in purple hues. Progress decrease illustrations Futuristic data visualization dashboards
Free with trial A collection of colorful isometric bar charts and line graphs are displayed on a white background, representing data visualization and analysis. Progress decrease illustrations Isometric colorful bar charts and line graphs displayed on a white background for data visualization. a collection of colorful isometric bar charts and line graphs are displayed on a white background, representing data visualization and analysis
Free with trial Line art business trend icons set featuring growth and decline bar charts for financial data visualization. Progress decrease vectors Line art business trend icons set featuring growth and decline bar charts for financial data visualization
Free with trial Business bar chart showing decreasing values and a prominent downward arrow indicating decline or loss. Progress decrease vectors Business bar chart showing decreasing values and a prominent downward arrow indicating decline or loss
Free with trial Description: A vibrant 3D rendering showcasing a bar chart with orange, blue, and yellow bars, representing upward financial trends or business growth. Ideal for presentations and reports. Progress decrease illustrations Colorful 3D Bar Chart: Business Growth and Financial Success. Description: A vibrant 3D rendering showcasing a bar chart with orange, blue, and yellow bars, representing upward financial trends or business growth. Ideal for presentations and reports.
Free with trial A magnifying glass hovers over a grid paper background displaying two line graphs, one red and one blue. The red graph a general upward trend with several peaks and valleys, while the blue graph a downward trend. The magnifying glass focuses on a prominent red upward arrow within the red graph, highlighting an increase. Progress decrease illustrations Magnifying glass over red and blue upward and downward trending graphs on grid paper chart data analysis. A magnifying glass hovers over a grid paper background displaying two line graphs, one red and one blue. The red graph a general upward trend with several peaks and valleys, while the blue graph a downward trend. The magnifying glass focuses on a prominent red upward arrow within the red graph, highlighting an increase
Free with trial A high-tech visualization of financial data, showing a glowing blue bar chart and line graphs representing stock market trends, business analytics, and economic growth. Progress decrease illustrations Futuristic digital stock market chart with glowing blue graphs and data analysis on a dark background. A high-tech visualization of financial data, showing a. A high-tech visualization of financial data, showing a glowing blue bar chart and line graphs representing stock market trends, business analytics, and economic growth
Free with trial A series of small, stylized houses are arranged in a stepped pattern, each displaying a large golden percentage symbol. They ascend from left to right against a gradient sky. Progress decrease illustrations Miniature houses with percentage symbols arranged in an ascending staircase against a soft sunset sky. A series of small, stylized houses are arranged in a stepped pattern, each displaying a large golden percentage symbol. They ascend from left to right against a gradient sky
Free with trial Blue arrow ascending, meeting a descending white arrow, symbolizing convergence or intersection ,Generative ai. Progress decrease illustrations Ascending blue arrow meets descending white arrow symbolic representation of convergence and intersection. Blue arrow ascending, meeting a descending white arrow, symbolizing convergence or intersection ,Generative ai
Free with trial Bold, black squiggly arrow pointing downward against a clean white background, effectively symbolizing a downward trend or direction, perfect for illustrating decline or loss. Progress decrease vectors Bold, black squiggly arrow pointing downward against a clean white background, effectively symbolizing a downward trend
Free with trial Close-up view of computer screen with colorful graphs, charts, representing financial, economic data visualization. Stock market analysis, business statistics investment data displayed. Progress decrease illustrations Close-up view of computer screen with colorful graphs, charts, representing financial, economic data visualization. Stock market
Free with trial A sharply declining red arrow against a grid evokes negative trends and downward movement overall. Progress decrease illustrations A sharply declining red arrow against a grid evokes negative trends and downward movement overall
Free with trial Reduction chart icon set depicting data reduction symbols, ideal for business analytics and performance visuals. Progress decrease vectors Reduction chart icon set depicting data reduction symbols.Vector illustration. Reduction chart icon set depicting data reduction symbols, ideal for business analytics and performance visuals
Free with trial A man is presenting business data on a whiteboard, using a laptop. He is explaining the chart and graph to his colleagues. The scene is set in an office. Progress decrease illustrations Man presenting business data on a whiteboard with laptop isolated on white background. A man is presenting business data on a whiteboard, using a laptop. He is explaining the chart and graph to his colleagues. The scene is set in an office
Free with trial A 3D illustration representing financial concepts. It features a white document with a pink dollar sign and blue horizontal lines indicating text. A purple clock with white hands sits to the right, and a teal arrow curves downwards from the left, pointing towards the clock. The composition is set against a soft blue background with subtle shadow effects. Progress decrease illustrations 3D Illustration Of Financial Document With Dollar Sign Clock And Downward Arrow Keywords: finance, money, dollar sign, document. A 3D illustration representing financial concepts. It features a white document with a pink dollar sign and blue horizontal lines indicating text. A purple clock with white hands sits to the right, and a teal arrow curves downwards from the left, pointing towards the clock. The composition is set against a soft blue background with subtle shadow effects
Free with trial 3d man analyzing bar chart, a visual representation of growth, business performance, and investment strategy ,Generative ai. Progress decrease illustrations 3d man analyzing bar chart, a visual representation of growth, business performance, and investment strategy
Free with trial 3D rendered green and red arrows pointing up and down representing financial growth, loss, and market exchange , abstract background. Progress decrease illustrations 3D rendered green and red arrows pointing up and down representing financial growth, loss, and market exchange
Free with trial This clean studio shot illustrates a workplace safety management concept using four wooden blocks. The blocks feature icons representing hard hats, a downward trending graph labeled 'ACCIDENTS,' and a shield with a checkmark, symbolizing successful accident prevention and worker protection. It's ideal for themes related to occupational health, risk management, and industrial safety protocols. Progress decrease illustrations Workplace Safety Management Concept. Hard Hat, Accident Reduction Graph, and Shield Icons on Wooden Blocks. This clean studio shot illustrates a workplace safety management concept using four wooden blocks. The blocks feature icons representing hard hats, a downward trending graph labeled 'ACCIDENTS,' and a shield with a checkmark, symbolizing successful accident prevention and worker protection. It's ideal for themes related to occupational health, risk management, and industrial safety protocols.
Free with trial Line art business graphs set featuring financial growth and decline with dollar signs for economic performance. Progress decrease vectors Line art business graphs set featuring financial growth and decline with dollar signs for economic performance
Free with trial A vibrant green arrow curves downwards, rendered with a subtle gradient effect, against a solid black backdrop. Progress decrease vectors Green curved arrow pointing downwards with subtle shading isolated on a transparent background direction. A vibrant green arrow curves downwards, rendered with a subtle gradient effect, against a solid black backdrop
Free with trial Two wooden blocks symbolize contrasting trends, with one showing red up arrow, black down arrow. Blocks represent opposing forces, choices, directional indicators in concepts like. Progress decrease illustrations Two wooden blocks symbolize contrasting trends, with one showing red up arrow, black down arrow. Blocks represent opposing
Free with trial Finances statistics descending bars graphic outline icon in white and black colors. finances statistics descending bars graphic flat vector icon from business collection for web, mobile apps and ui. Progress decrease vectors Finances statistics descending bars graphic outline icon in white and black colors. finances statistics descending bars graphic
Free with trial High and Low Percent arrow icon Vector symbol or sign set collection in black and white outline. Progress decrease vectors High and Low Percent arrow icon mark in filled style. High and Low Percent arrow icon Vector symbol or sign set collection in black and white outline
Free with trial Stylized graphics depict market trends with up and down arrows. Flat design with simple shapes for business and financial presentations. Progress decrease vectors Stylized infographics illustrating growth and decline with upward and downward arrows on black background. Stylized graphics depict market trends with up and down arrows. Flat design with simple shapes for business and financial presentations.
Free with trial Comprehensive data visualization, graphs and charts on a computer monitor for trend analysis reporting ,Generative AI. Progress decrease illustrations Comprehensive data visualization, graphs and charts on a computer monitor for trend analysis reporting
Free with trial A set of business and data analysis icons, perfect for presentations, reports, and dashboards. These icons cover various aspects of data management and reporting. Progress decrease vectors Vector art of collection of business and data analysis icons, representing various aspects of data management and reporting. A set of business and data analysis icons, perfect for presentations, reports, and dashboards. These icons cover various aspects of data management and reporting
Free with trial Vibrant data visualization featuring bar and line graphs, sun icon, and descending trend lines against a stark black background in a flat style. Progress decrease vectors Colorful data visualization with bar graphs, line graph, sun icon, and descending trends on a black background. Vibrant data visualization featuring bar and line graphs, sun icon, and descending trend lines against a stark black background in a flat style.
Free with trial Set of chart icons with dollar sign in even silhouette on a white background. The graph shows downward and upward trends. Vector. Progress decrease vectors Set of graphic icons with dollar. Set of chart icons with dollar sign in even silhouette on a white background. The graph shows downward and upward trends. Vector
Free with trial A line art illustration shows a bar graph with arrows and a star on a purple background. It represents business growth, success, and achievement of goals. Progress decrease vectors Vector art of line art illustration of a bar graph with arrows and a star on a purple background business growth concept. A line art illustration shows a bar graph with arrows and a star on a purple background. It represents business growth, success, and achievement of goals
Free with trial Dollar sign up and down arrow icon logo sign vector outline in black and white color. Progress decrease vectors Dollar sign up and down arrow icon logo sign vector outline
Free with trial Flat style 2D illustration A diverse team collaborates to analyze a large screen displaying a Bounce Rate chart with a downward trend indicating successful performance improvement efforts. Progress decrease vectors Business Team Analyzing Decreasing Bounce Rate Chart for Website Optimization Strategy Flat style 2D illustration. Flat style 2D illustration A diverse team collaborates to analyze a large screen displaying a Bounce Rate chart with a downward trend indicating successful performance improvement efforts.
Free with trial A bright yellow 3D arrow points downwards against a solid arrow, down, direction. bright yellow 3 d arrow pointing downwards. Progress decrease vectors Bright yellow 3 D arrow pointing downwards isolated on a transparent background direction symbol sign. A bright yellow 3D arrow points downwards against a solid arrow, down, direction. bright yellow 3 d arrow pointing downwards
Free with trial The red futuristic with a neon lights background. Hi-tech backdrop. Generative AI. Progress decrease illustrations The red futuristic with a neon lights background. Hi-tech backdrop. Generative AI
Free with trial Isometric graph with dollar sign. The graph shows a downward trend. Vector. Progress decrease vectors Isometric graphic icon with dollar. Isometric graph with dollar sign. The graph shows a downward trend. Vector
Free with trial Green up and red down 3d arrow graph showing rising, descending trend, business result, profit or loss symbol symbol. Business arrow, goals concept. 3d world money symbols. Financial growth vector isolated. Progress decrease vectors Green up and red down 3d arrow graph showing rising, descending trend, business result, profit. world money symbols. Green up and red down 3d arrow graph showing rising, descending trend, business result, profit or loss symbol symbol. Business arrow, goals concept. 3d world money symbols. Financial growth vector isolated
Free with trial Green up and red down 3d arrow graph showing rising, descending trend, business result, profit or loss symbol symbol. Business arrow, goals concept. 3d world money symbols. Financial growth vector isolated. Progress decrease vectors Green up and red down 3d arrow graph showing rising, descending trend, business result, profit. world money symbols. Green up and red down 3d arrow graph showing rising, descending trend, business result, profit or loss symbol symbol. Business arrow, goals concept. 3d world money symbols. Financial growth vector isolated
Free with trial Dollar sign up and down arrow icon Vector symbol or sign set collection in black and white outline. Progress decrease vectors Dollar sign up and down arrow icon mark in filled style. Dollar sign up and down arrow icon Vector symbol or sign set collection in black and white outline
Free with trial Three blue arrows pointing down, one blue plus sign, abstract elements, directional indicators, digital symbols, plus minus, concept. Progress decrease vectors Three blue arrows pointing down and one blue plus sign, directional indicators, abstract elements, digital symbols, plus and minus. Three blue arrows pointing down, one blue plus sign, abstract elements, directional indicators, digital symbols, plus minus, concept
Free with trial Simple line graph illustration showing trend fluctuations, ideal for financial concepts. Progress decrease illustrations Outline of ups and downs chart vector icon. Simple line graph illustration showing trend fluctuations, ideal for financial concepts
Free with trial Graph going Up and Down sign with green and red arrows vector. Flat design vector illustration concept of sales bar chart symbol icon with arrow moving down and sales bar chart with arrow moving up. Progress decrease vectors Graph going Up and Down sign with green and red arrows vector. Flat design vector illustration concept of sales bar chart symbol. Graph going Up and Down sign with green and red arrows vector. Flat design vector illustration concept of sales bar chart symbol icon with arrow moving down and sales bar chart with arrow moving up.
Free with trial Document is being analyzed with a bar graph and pie chart representing market data. Progress decrease vectors Document with charts showing market analysis and financial report. Document is being analyzed with a bar graph and pie chart representing market data
Free with trial A professional set of icons depicting various data chart types, including exponential growth, volatility, and linear trends for business analytics and reporting. Progress decrease illustrations Collection of professional data graph icons illustrating different growth patterns and financial statistics trends. a professional set of icons depicting various data chart types, including exponential growth, volatility, and linear trends for business analytics and reporting
Free with trial Visualize complex market trends and strategy using this metallic, AI-generated bar chart illustration. Perfect for financial reports, planning presentations, and investor materials that require a sophisticated, high-impact visual representation of business growth, decline, and future success. Progress decrease illustrations Conceptual 3D business bar chart illustrating market performance, showing initial decline followed by upward growth. Visualize complex market trends and strategy using this metallic, AI-generated bar chart illustration. Perfect for financial reports, planning presentations, and investor materials that require a sophisticated, high-impact visual representation of business growth, decline, and future success.
Free with trial This image showcases a 3D bar chart with four distinct vertical bars. The bars vary in height, forming a pattern that. Progress decrease illustrations A 3D bar chart displays a downward trend on a smooth light surface suggesting diminishing returns or financial decline. This image showcases a 3D bar chart with four distinct vertical bars. The bars vary in height, forming a pattern that.
Free with trial Marketing campaign failing despite positive feedback, represented by a graph. Progress decrease illustrations Social media marketing campaign failing with negative trend graph. Marketing campaign failing despite positive feedback, represented by a graph
Free with trial Laptop screen with two graphs showing opposite trends. Perfect for illustrating financial data, market analysis, business statistics in presentations. Progress decrease illustrations Laptop screen with two graphs showing opposite trends.
Free with trial Towering wooden blocks symbolize stability versus crumbling blocks representing instability. One structure grows tall, another diminishes as pieces fall, showing construction, disarray. Progress decrease illustrations Towering wooden blocks symbolize stability versus crumbling blocks representing instability. One structure grows tall, another
Free with trial Isometric illustration of a chart board displaying upward and downward trend lines. Progress decrease vectors Isometric graph chart with trends on display. Isometric illustration of a chart board displaying upward and downward trend lines
Free with trial A document with bar and line graphs is being examined with a magnifying glass. This suggests a detailed analysis of data, trends, and insights. It is isolated on white background. Progress decrease vectors Vector art of analyzing data with a magnifying glass on a report it shows bar graphs and a line graph indicating trends and. A document with bar and line graphs is being examined with a magnifying glass. This suggests a detailed analysis of data, trends, and insights. It is isolated on white background