Free with trial A bold black arrow points diagonally downward with the word DOWN printed below it. Trend decrease illustrations Black Downward Arrow with Text DOWN on White Background Keywords: arrow, down, downward. A bold black arrow points diagonally downward with the word DOWN printed below it
Free with trial Black and white line graph comparing nominal and real return over time with axes labeled. Trend decrease illustrations Black and white line graph showing nominal and real return over time chart nominal return. Black and white line graph comparing nominal and real return over time with axes labeled
Free with trial Dynamic teal graph visually represents financial data. Professional design elements provide an ideal visual for business reports and presentations , dreamy concept. Trend decrease illustrations Abstract Digital Financial Graph with Teal Data. Dynamic teal graph visually represents financial data. Professional design elements provide an ideal visual for business reports and presentations , dreamy concept
Free with trial A black wavy arrow points downwards on a white background Clear details and vibrant colors enhance visual appeal. Trend decrease illustrations Black wavy downward trending arrow on a white background decline. A black wavy arrow points downwards on a white background Clear details and vibrant colors enhance visual appeal
Free with trial A dynamic image of a digital stock market ticker screen displaying financial data. The background is filled with red, downward-pointing arrows and negative numbers, symbolizing a bearish market, recession, or economic downturn. In stark contrast, a single, large, bright green arrow points upwards, representing growth, success, profit, and recovery. This powerful visual metaphor illustrates a single stock's success or a broader economic turnaround amidst widespread losses. It's perfect for concepts related to investment strategy, financial analysis, market volatility, and economic hope. Trend decrease illustrations Stock Market Recovery and Growth Concept. A dynamic image of a digital stock market ticker screen displaying financial data. The background is filled with red, downward-pointing arrows and negative numbers, symbolizing a bearish market, recession, or economic downturn. In stark contrast, a single, large, bright green arrow points upwards, representing growth, success, profit, and recovery. This powerful visual metaphor illustrates a single stock's success or a broader economic turnaround amidst widespread losses. It's perfect for concepts related to investment strategy, financial analysis, market volatility, and economic hope.
Free with trial Arrow Direction and Percentage Icons for Business Growth Concept. Trend decrease illustrations Arrow Direction and Percentage Icons for Business Growth Concept
Free with trial A 3D rendered icon depicting a blue document with a raised bar graph. The bar graph features alternating blue, orange, and yellow bars of varying heights. White lines and a circular orange and white element are also present on the blue document surface. The icon is isolated on a white background. Trend decrease vectors 3 D blue document icon with orange and blue bar graph and white lines image. A 3D rendered icon depicting a blue document with a raised bar graph. The bar graph features alternating blue, orange, and yellow bars of varying heights. White lines and a circular orange and white element are also present on the blue document surface. The icon is isolated on a white background
Free with trial A dramatic visual representation of a stock market crash, featuring a downward trending red candlestick chart against a dark, grid-like background. Numbers and financial data are subtly visible, emphasizing the financial context. This image evokes feelings of loss, recession, and economic downturn, making it ideal for illustrating financial crises, market volatility, and investment risks. Trend decrease illustrations Red Stock Market Crash Chart. A dramatic visual representation of a stock market crash, featuring a downward trending red candlestick chart against a dark, grid-like background. Numbers and financial data are subtly visible, emphasizing the financial context. This image evokes feelings of loss, recession, and economic downturn, making it ideal for illustrating financial crises, market volatility, and investment risks.
Free with trial Bad stock market chart and sad bear. Trend decrease illustrations Bad stock market chart and sad bear
Free with trial This infographic features a collection of colorful charts and graphs on a white background, surrounded by arrows pointing in different directions. The image represents business and finance concepts, such as data analysis, statistics, and trends. The vibrant colors and dynamic design make it visually appealing and engaging. Trend decrease vectors A colorful infographic with arrows and charts on a white background. This infographic features a collection of colorful charts and graphs on a white background, surrounded by arrows pointing in different directions. The image represents business and finance concepts, such as data analysis, statistics, and trends. The vibrant colors and dynamic design make it visually appealing and engaging.
Free with trial Black and white icon of a bar graph with a diagonal arrow indicating a sharp decline. Trend decrease illustrations Falling bar graph with diagonal arrow showing sharp decline bar chart. Black and white icon of a bar graph with a diagonal arrow indicating a sharp decline
Free with trial A black icon representing a bar chart with bars decreasing in height Clear details and vibrant colors enhance. Trend decrease illustrations Black descending bar chart icon on white background graph decline. A black icon representing a bar chart with bars decreasing in height Clear details and vibrant colors enhance
Free with trial Purple glassmorphism downward arrow chart icon, representing business loss, market drop, or negative metrics, 3d rendering. Trend decrease vectors Purple glassmorphism downward arrow chart icon, representing business loss, market drop, or negative metrics, 3d rendering
Free with trial Dollar Coins with Upward and Downward Arrows Representing Financial Growth and Decline in Minimalist Flat Style. Trend decrease vectors Dollar Coins with Upward and Downward Arrows Representing Financial Growth and Decline in Minimalist Flat Style.
Free with trial Businessman with downward graph indicating financial decline, recession, and negative growth. Ideal for economic analysis, loss reporting, and business downturn visuals. Trend decrease vectors Business decline graph with downward arrow showing financial loss recession and negative growth concept. Businessman with downward graph indicating financial decline, recession, and negative growth. Ideal for economic analysis, loss reporting, and business downturn visuals
Free with trial A conceptual vector illustration depicting a severe economic downturn. The image features a grey bar chart with progressively shorter bars, symbolizing declining profits or performance. A bold red arrow points sharply downwards, representing a crash or significant loss, alongside a blue line graph also showing a negative trend. This graphic is ideal for illustrating concepts such as financial crisis, recession, stock market crash, business failure, bankruptcy, and negative growth. Perfect for financial reports, business presentations, news articles, and economic analysis infographics. Trend decrease illustrations Economic Downturn and Financial Crisis Graph. A conceptual vector illustration depicting a severe economic downturn. The image features a grey bar chart with progressively shorter bars, symbolizing declining profits or performance. A bold red arrow points sharply downwards, representing a crash or significant loss, alongside a blue line graph also showing a negative trend. This graphic is ideal for illustrating concepts such as financial crisis, recession, stock market crash, business failure, bankruptcy, and negative growth. Perfect for financial reports, business presentations, news articles, and economic analysis infographics.
Free with trial A minimalist illustration of a downward pointing zigzag arrow, conveying decline, direction, and a sense of motion. Great for illustrating a negative trend or movement. Trend decrease vectors Simple Bold Zigzag Decline Arrow Direction Sign Symbol Icon Element. A minimalist illustration of a downward pointing zigzag arrow, conveying decline, direction, and a sense of motion. Great for illustrating a negative trend or movement.
Free with trial Vibrant 3D red bar chart illustrating declining growth trends for business analytics, finance reports, and data visualization projects. Trend decrease vectors 3D red bar chart decreasing growth business data analysis concept. Vibrant 3D red bar chart illustrating declining growth trends for business analytics, finance reports, and data visualization projects
Free with trial Black line graph showing upward and downward trends with arrows on a white background. Trend decrease illustrations Black line graph with upward and downward trends and arrows chart data. Black line graph showing upward and downward trends with arrows on a white background
Free with trial Three stacks of coins decreasing in height, each topped with a wooden block featuring a black downward arrow, symbolizing financial decline, economic downturn, or decreasing profits against a blue background. Trend decrease illustrations Financial Decline Concept with Stacks of Coins and Downward Arrows. Three stacks of coins decreasing in height, each topped with a wooden block featuring a black downward arrow, symbolizing financial decline, economic downturn, or decreasing profits against a blue background
Free with trial Business Chart and Graph Set with Line, Bar, and Pie Icons for Data Analysis or Statistics in Reports and Research. Vector. Editable stroke. Trend decrease vectors Business Chart and Graph Set with Line, Bar, and Pie Icons for Data Analysis or Statistics in Reports and Research
Free with trial Bear market business vector concept. Symbol of finance, downturn, trading. Minimal design eps10 illustration. Trend decrease vectors Bear market business vector concept. Symbol of finance, downturn, trading. Minimal illustration
Free with trial This image features an abstract illustration of a bar graph against a dark gray background. The graph consists of three vertical bars of varying heights, each with horizontal rectangles inside. The bars are shades of white and gray, creating a minimalist and modern design. This image can be used to represent data, growth, statistics, or business performance in a visually appealing manner. Trend decrease vectors Abstract Bar Graph Illustration. This image features an abstract illustration of a bar graph against a dark gray background. The graph consists of three vertical bars of varying heights, each with horizontal rectangles inside. The bars are shades of white and gray, creating a minimalist and modern design. This image can be used to represent data, growth, statistics, or business performance in a visually appealing manner.
Free with trial Stack of books with red downward arrow. Decline in education or reading, concept. 3D rendering isolated on white background. Trend decrease illustrations Stack of books with red downward arrow. Decline in education or reading, concept. 3D rendering
Free with trial Aesthetic pastel style diminishing line graph illustration soft gradient, design minimal, subtle smooth aesthetic pastel style diminishing line graph. Trend decrease illustrations Aesthetic pastel style diminishing line graph
Free with trial Bar chart representation of data increase growth and finance. Data analysis. Trend decrease vectors Bar chart representation of data increase growth and finance. Data analysis
Free with trial A 3D rendering depicts a scale balancing location markers (representing market presence) and a downward-trending arrow (symbolizing market value decline). It visually represents the complex relationship between a business's geographic reach and its financial performance, highlighting how even strong. Trend decrease illustrations Location vs. Market Value. A 3D rendering depicts a scale balancing location markers (representing market presence) and a downward-trending arrow (symbolizing market value decline). It visually represents the complex relationship between a business's geographic reach and its financial performance, highlighting how even strong
Free with trial A flat depicting two distinct financial charts against a white background. The left chart a bar graph with bars in shades of green and blue, topped by a jagged blue line graph ascending towards a green percentage symbol and an upward arrow. The right chart a bar graph with bars in yellow, orange, and red, with a red line graph descending from a yellow dollar sign. Trend decrease illustrations Upward and downward financial charts with percentage and dollar symbols. A flat depicting two distinct financial charts against a white background. The left chart a bar graph with bars in shades of green and blue, topped by a jagged blue line graph ascending towards a green percentage symbol and an upward arrow. The right chart a bar graph with bars in yellow, orange, and red, with a red line graph descending from a yellow dollar sign
Free with trial Line art depicting a magnifying glass focused on a declining sales graph and a thumbs-down gesture. Trend decrease illustrations Declining Sales Analysis Magnifying Glass, Downward Trend, Thumbs Down. Line art depicting a magnifying glass focused on a declining sales graph and a thumbs-down gesture.
Free with trial Displays collection decline-themed icons forms reduction failure deterioration across domains, setback regression worsening adversity ,. Trend decrease vectors Decline themed icons forms reduction failure deterioration, setback regression worsening adversity. displays collection decline-themed icons forms reduction failure deterioration across domains, setback regression worsening adversity ,
Free with trial A sophisticated 3D rendered bar graph composed of multiple vertical blue glass bars arranged in a line with varying heights, where the tallest bar appears at the bottom right side and the shortest bars are positioned at the top left, creating a visually striking data visualization against a clean white background that emphasizes the transparent glass-like material and realistic lighting effects. Trend decrease illustrations 3D rendered blue glass bar graph showing data visualization with vertical columns of varying heights on white background. A sophisticated 3D rendered bar graph composed of multiple vertical blue glass bars arranged in a line with varying heights, where the tallest bar appears at the bottom right side and the shortest bars are positioned at the top left, creating a visually striking data visualization against a clean white background that emphasizes the transparent glass-like material and realistic lighting effects
Free with trial This image features three bold, three-dimensional arrows pointing sharply downward, each rendered in distinct vibrant colors�'blue, yellow, and red�'symbolizing a significant market downturn, financial loss, or economic decline, set against a clean, minimalist white background that enhances their striking visual impact and conveys urgency and negative momentum in business, trading, or investment. Trend decrease illustrations Colorful downward trending financial arrows in blue yellow and red illustrating market decline and economic downturn concepts. This image features three bold, three-dimensional arrows pointing sharply downward, each rendered in distinct vibrant colors�'blue, yellow, and red�'symbolizing a significant market downturn, financial loss, or economic decline, set against a clean, minimalist white background that enhances their striking visual impact and conveys urgency and negative momentum in business, trading, or investment
Free with trial This image features a minimalist and modern vector icon of a jagged downward trending line graph, sharply declining from left to right, symbolizing financial loss, economic downturn, or market decline, set against a clean and uncluttered white background suitable for use in presentations, reports, infographics, or digital media to visually communicate negative trends or decreasing performance. Trend decrease illustrations Sharp downward trending line graph icon isolated on white background representing financial loss or market decline vector. This image features a minimalist and modern vector icon of a jagged downward trending line graph, sharply declining from left to right, symbolizing financial loss, economic downturn, or market decline, set against a clean and uncluttered white background suitable for use in presentations, reports, infographics, or digital media to visually communicate negative trends or decreasing performance
Free with trial A thick, bright red arrow with a white outline, angled downwards and to the right, indicating direction or decline. Trend decrease vectors Bold red arrow pointing down and to the right. A thick, bright red arrow with a white outline, angled downwards and to the right, indicating direction or decline
Free with trial A vibrant red arrow graph sharply declining against a dark, textured background, symbolizing a significant financial downturn or economic crisis. Trend decrease illustrations Red downward arrow graph on dark background showing financial crisis. A vibrant red arrow graph sharply declining against a dark, textured background, symbolizing a significant financial downturn or economic crisis
Free with trial Businessman presenting falling chart indicating financial decline and loss. Ideal for analytics, reporting, and economic downturn presentations. Trend decrease vectors Business decline presentation with downward chart representing financial loss analysis and negative growth. Businessman presenting falling chart indicating financial decline and loss. Ideal for analytics, reporting, and economic downturn presentations
Free with trial Two sets of simple flat design charts showing bar graphs with line graphs and three-segment pie charts in red, green, and blue. Trend decrease vectors Two bar charts with line graphs and two pie charts data visualization statistics. Two sets of simple flat design charts showing bar graphs with line graphs and three-segment pie charts in red, green, and blue
Free with trial A Bitcoin falling off a cliff against a cloudy horizon. Cryptocurrency fall concept. Trend decrease illustrations A Bitcoin falling off a cliff against a cloudy horizon
Free with trial 3d illustration of red decreasing graph on stand, financial presentation representing negative results or economic downturn. Trend decrease vectors 3d illustration of red decreasing graph on stand, financial presentation representing negative results
Free with trial A black diagonal arrow pointing downwards on a white background. Clear details and vibrant colors enhance visu. Trend decrease illustrations Black Diagonal Down Arrow Icon on White Background direction movement. A black diagonal arrow pointing downwards on a white background. Clear details and vibrant colors enhance visu
Free with trial A black arrow points downwards with the word LOS in white letters on its shaft. Clear details and vibrant colo. Trend decrease illustrations Black arrow pointing down with the word LOS in white direction symbol. A black arrow points downwards with the word LOS in white letters on its shaft. Clear details and vibrant colo
Free with trial An image illustrating economic decline with falling coin stacks and a downward trending financial chart. Trend decrease illustrations Economic downturn depicted by falling coin stacks and declining chart. An image illustrating economic decline with falling coin stacks and a downward trending financial chart
Free with trial A black upward arrow merges into a downward curving line graph on a white background. Trend decrease illustrations Black upward arrow and downward curve graph on white background chart. A black upward arrow merges into a downward curving line graph on a white background
Free with trial Two black arrows, one pointing up and the other down with the word PUT on it, on a white background. Trend decrease illustrations Black upward arrow and downward arrow with the word PUT on the second arrow direction. Two black arrows, one pointing up and the other down with the word PUT on it, on a white background
Free with trial Line art icon featuring a magnifying glass positioned over a vertical bar chart. The design is simple and minimalistic, using grey lines. The bar chart consists of three bars of varying heights, and the magnifying glass is centered over the middle bar, suggesting examination or analysis of data. This icon is likely used to symbolize data analysis, inspection, or detailed observation in a graphical representation. Trend decrease vectors Line art icon of magnifying glass over bar chart. Line art icon featuring a magnifying glass positioned over a vertical bar chart. The design is simple and minimalistic, using grey lines. The bar chart consists of three bars of varying heights, and the magnifying glass is centered over the middle bar, suggesting examination or analysis of data. This icon is likely used to symbolize data analysis, inspection, or detailed observation in a graphical representation.
Free with trial A green line graph illustrating data points over time, with the y-axis labeled 'Value' and the x-axis labeled 'Time', showcasing significant ups and downs in the data. Trend decrease illustrations Line graph showing fluctuating values over time. A green line graph illustrating data points over time, with the y-axis labeled 'Value' and the x-axis labeled 'Time', showcasing significant ups and downs in the data
Free with trial This 3D rendering showcases gold bars and coins against a backdrop of a dynamic stock market graph, generated by AI. The image evokes themes of wealth, investment, and market fluctuations. The high-quality rendering emphasizes the precious nature of gold. Trend decrease illustrations Gold Bullion & Market Graph. This 3D rendering showcases gold bars and coins against a backdrop of a dynamic stock market graph, generated by AI. The image evokes themes of wealth, investment, and market fluctuations. The high-quality rendering emphasizes the precious nature of gold.
Free with trial A comprehensive collection of hand-drawn business and data visualization icons. This doodle-style set features a variety of essential elements, including different types of arrows, bar graphs, line charts, and pie charts. The sketchy, black and white illustrations are perfect for infographics, presentations, financial reports, and marketing materials. Each icon is isolated on a white background, representing concepts like growth, statistics, process flow, and direction. This versatile vector set is ideal for adding a creative, hand-made touch to any project related to analytics, finance, or strategy. Trend decrease illustrations Hand Drawn Business and Finance Doodle Icon Set. A comprehensive collection of hand-drawn business and data visualization icons. This doodle-style set features a variety of essential elements, including different types of arrows, bar graphs, line charts, and pie charts. The sketchy, black and white illustrations are perfect for infographics, presentations, financial reports, and marketing materials. Each icon is isolated on a white background, representing concepts like growth, statistics, process flow, and direction. This versatile vector set is ideal for adding a creative, hand-made touch to any project related to analytics, finance, or strategy.
Free with trial An isometric 3D bar chart with four descending bars, made of a clear glass with a modern, holographic, and iridescent finish in pink and blue. Concept of financial decline or decreasing data trends. Trend decrease vectors Isometric Bar Chart Showing Decline with Iridescent Bars. An isometric 3D bar chart with four descending bars, made of a clear glass with a modern, holographic, and iridescent finish in pink and blue. Concept of financial decline or decreasing data trends
Free with trial A 3d rendering of stack of gold bars with a red arrow pointing downwards, suggesting a decrease in the price or value of gold. Trend decrease illustrations Stack of gold bars with a red arrow pointing downwards
Free with trial Combining love growth and decline charts, symbolizing relationship ups and downs. Perfect for dating, counseling, and emotional data visualization projects. Trend decrease vectors Combining love growth and decline charts, symbolizing relationship ups and downs. Perfect for dating, counseling, and emotional
Free with trial A magnifying glass rests on gold coins atop a financial chart, generated by AI. This image symbolizes the detailed examination and analysis needed for successful investment strategies in the volatile world of finance. The visual representation highlights the intricate process of studying market tre. Trend decrease illustrations Financial Market Analysis. A magnifying glass rests on gold coins atop a financial chart, generated by AI. This image symbolizes the detailed examination and analysis needed for successful investment strategies in the volatile world of finance. The visual representation highlights the intricate process of studying market tre
Free with trial Businessman in suit drawing a downward trending graph with the word RISK Clear details and vibrant colors enha. Trend decrease illustrations Businessman drawing a downward trending graph with the word RISK risk chart. Businessman in suit drawing a downward trending graph with the word RISK Clear details and vibrant colors enha
Free with trial Three black rectangular bars of decreasing height arranged horizontally on a white background. Trend decrease illustrations Three Descending Black Bar Chart Blocks on White Background graph data. Three black rectangular bars of decreasing height arranged horizontally on a white background
Free with trial Inflation sign. Sack pictogram with dollar sign and arrow down. Symbol of money depreciation vector linear illustration. Trend decrease vectors Inflation sign. Sack pictogram with dollar sign and arrow down. Symbol of money depreciation vector linear illustration.
Free with trial This abstract image features a vibrant candlestick chart, common in financial trading visualizations. The chart is overlaid on a blurred background of colorful circles, adding to its abstract aesthetic. Below the chart are vertical bars of varying heights and colors. This image was generated by AI. Trend decrease illustrations Candlestick Chart Abstract. This abstract image features a vibrant candlestick chart, common in financial trading visualizations. The chart is overlaid on a blurred background of colorful circles, adding to its abstract aesthetic. Below the chart are vertical bars of varying heights and colors. This image was generated by AI.
Free with trial A comprehensive collection of cartoon-style vector icons illustrating key financial and economic concepts. This set includes symbols for market decline, payment processing, bull and bear market dynamics, investment analysis, global currencies, financial balance, and rising interest rates. Ideal for use in business presentations, financial reports, banking websites, educational materials, or any project related to economics and investment. Trend decrease vectors Financial and Economic Icons Set. A comprehensive collection of cartoon-style vector icons illustrating key financial and economic concepts. This set includes symbols for market decline, payment processing, bull and bear market dynamics, investment analysis, global currencies, financial balance, and rising interest rates. Ideal for use in business presentations, financial reports, banking websites, educational materials, or any project related to economics and investment.
Free with trial Abstract 3d bar charts illustrating data visualization, financial statistics, and business analysis, presenting growth and decline trends in a report format. Trend decrease illustrations Business data visualization showing 3d bar graphs. Abstract 3d bar charts illustrating data visualization, financial statistics, and business analysis, presenting growth and decline trends in a report format
Free with trial Analyze the crash in the stock market crash. Learn from investment failure mistakes. Assess the damage from the business sector. Experts find the cause of the stock chart fall. Trend decrease vectors Analyze the crash in the stock market crash. Learn from investment failure mistakes. Assess the damage from the business
Free with trial A digital illustration on a black background features a world map rendered in shades of pink and purple with Data Doomsday text above it, divided into sections representing different data levels and centered by a line graph tracking data progression from 2000 to 2100 with green lines showing pre-industrial and contemporary data trends arranged vertically with a legend explaining each metric. Trend decrease illustrations Data doomsday digital illustration showing world map with pink purple color scheme and line graph tracking data levels from 2000. A digital illustration on a black background features a world map rendered in shades of pink and purple with Data Doomsday text above it, divided into sections representing different data levels and centered by a line graph tracking data progression from 2000 to 2100 with green lines showing pre-industrial and contemporary data trends arranged vertically with a legend explaining each metric
Free with trial Yellow light bulb and red downward arrow. 3D rendering isolated on white background. Trend decrease illustrations Yellow light bulb and red downward arrow. 3D rendering
Free with trial A hand uses chalk to draw a large downward-pointing arrow on a dark chalkboard, symbolizing financial decline, market crash, economic recession, or business loss. The stark contrast highlights the concept of falling values and negative trends. Trend decrease illustrations Hand Drawing Downward Arrow on Chalkboard Representing Decline and Loss. A hand uses chalk to draw a large downward-pointing arrow on a dark chalkboard, symbolizing financial decline, market crash, economic recession, or business loss. The stark contrast highlights the concept of falling values and negative trends
Free with trial Black icon illustrating a downward sloping graph with an arrow indicating decline on a white background. Trend decrease illustrations Black icon showing a downward sloping graph with an arrow chart decline. Black icon illustrating a downward sloping graph with an arrow indicating decline on a white background
Free with trial Black bar graph with downward arrows indicating a decline or loss on a white background. Trend decrease illustrations Falling bar graph with downward arrows indicating decline or loss chart. Black bar graph with downward arrows indicating a decline or loss on a white background
Free with trial Volatility of financial market pleases or upsets man standing near chart with sharp fluctuations. Problems of volatility in trading and influence of emotional background on investor. Trend decrease vectors Volatility of financial market pleases or upsets man standing near chart with sharp fluctuations
Free with trial A close-up view of black financial and business chart icons arranged in a grid on a light background. Trend decrease illustrations Close-up of financial and business chart icons on a grid finance charts. A close-up view of black financial and business chart icons arranged in a grid on a light background
Free with trial Collection of business growth and financial analysis icons featuring bar charts and arrows with editable line art and flat shape style. Editable vector icon set. Trend decrease vectors Collection of business growth and financial analysis icons featuring bar charts and arrows with editable line art and flat shape
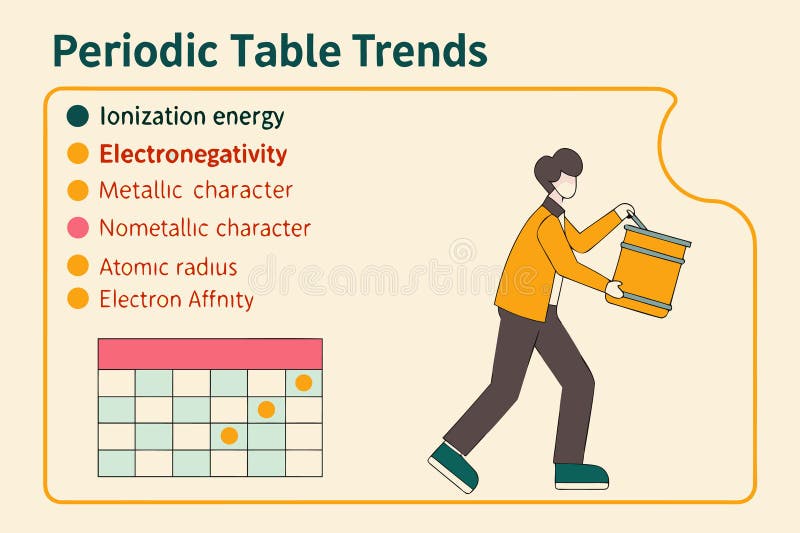
Free with trial Vector illustration depicting periodic table trends variety. Trend decrease vectors Vector illustration depicting periodic table trends
Free with trial A minimalist graphic featuring a green footprint icon next to a downward-pointing arrow. The image is clean and simple, set against a white background. This design can represent various concepts such as progress, direction, or a decline. Suitable for use in educational materials, infographics, websites, or presentations related to movement, steps, or downward trends. Trend decrease illustrations Footprint and Down Arrow Icon. A minimalist graphic featuring a green footprint icon next to a downward-pointing arrow. The image is clean and simple, set against a white background. This design can represent various concepts such as progress, direction, or a decline. Suitable for use in educational materials, infographics, websites, or presentations related to movement, steps, or downward trends.
Free with trial Displaying purple world map with rising red bars, red line graph on slide with green grid. Infographic, analytics, digital, technology, finance, strategic, modern. Trend decrease illustrations Displaying purple world map with rising red bars, red line graph on slide with green grid
Free with trial A black bar labeled PRICE tapers to a point above a long black bar labeled BASE. Clear details and vibrant col. Trend decrease illustrations Black price bar tapering to a point above a long base bar on white graph chart. A black bar labeled PRICE tapers to a point above a long black bar labeled BASE. Clear details and vibrant col
Free with trial Multiple stacks of gold coins are arranged in a line on a dark, reflective surface. The stacks vary in height, with the tallest on the far left and progressively shorter stacks to the right, creating a visual representation of a declining trend. The lighting is dramatic, casting reflections and highlighting the metallic sheen of the coins against the dark background. Trend decrease illustrations Stacks of coins arranged in a descending line on a dark reflective surface. Multiple stacks of gold coins are arranged in a line on a dark, reflective surface. The stacks vary in height, with the tallest on the far left and progressively shorter stacks to the right, creating a visual representation of a declining trend. The lighting is dramatic, casting reflections and highlighting the metallic sheen of the coins against the dark background
Free with trial Displaying dashboard grid showing fluctuating blue and red line graphs with metallic green sphere. Analytics, investment, data visualization, technology, finance, bar chart, dashboard. Trend decrease illustrations Displaying dashboard grid showing fluctuating blue and red line graphs with metallic green sphere
Free with trial Basic charts line icon set. Bar diagram, pie and histogram graph. Data visualization, growth and distribution analysis for business and finance. Vector illustration Editable Stroke. Trend decrease illustrations Basic charts line icon set. Bar diagram, pie and histogram graph. Data visualization, growth and distribution analysis
Free with trial This image showcases three gold bars resting on a screen displaying a dynamic stock market chart, generated by AI. The scene is visually striking, suggesting the relationship between gold as an investment and market trends. The high-resolution image is perfect for illustrating financial articles o. Trend decrease illustrations Gold Bars & Stock Market Chart. This image showcases three gold bars resting on a screen displaying a dynamic stock market chart, generated by AI. The scene is visually striking, suggesting the relationship between gold as an investment and market trends. The high-resolution image is perfect for illustrating financial articles o
Free with trial Hands Collaborating to Represent Efficiency in Artificial Intelligence with Rising Quality and Falling Cost Graphs in a Modern Business Concept Gluon. Trend decrease illustrations Hands Collaborating to Represent Efficiency in Artificial Intelligence with Rising Quality and Falling Cost Graphs in a
Free with trial Downward arrow, swirling line with blue concentric circles, and percentage symbol suggest falling rates. Ideal for finance, economy, interest, discount, marketing statistics cost management. Flat. Trend decrease vectors Declining Percentage Rate Represented by Downward Arrow and Percentage Symbol. Downward arrow, swirling line with blue concentric circles, and percentage symbol suggest falling rates. Ideal for finance, economy, interest, discount, marketing statistics cost management. Flat
Free with trial Red hand-drawn up and down arrows on white background. Trend decrease illustrations Two hand-drawn red chalk arrows, one pointing up and one pointing down, isolated On Transparent Background, minimal directional. Red hand-drawn up and down arrows on white background
Free with trial A modern vector illustration of a line graph showing a clear decline, emphasized by a red downtrend arrow. Ideal for financial reports, business presentations, or data visualization projects illustrating negative trends or decreases. This graphic effectively communicates a downward movement in statistics, vector design Generative AI. Trend decrease vectors Declining Line Graph with Red Downtrend Arrow, vector design Generative AI. A modern vector illustration of a line graph showing a clear decline, emphasized by a red downtrend arrow. Ideal for financial reports, business presentations, or data visualization projects illustrating negative trends or decreases. This graphic effectively communicates a downward movement in statistics, vector design Generative AI
Free with trial This image showcases colorful 3D charts and graphs, representing financial data, generated by AI. It includes bar graphs, pie charts, and other visual representations of financial performance, displayed on a tablet and printed reports. The image suggests growth and positive financial trends. Trend decrease illustrations AI-Generated Financial Charts. This image showcases colorful 3D charts and graphs, representing financial data, generated by AI. It includes bar graphs, pie charts, and other visual representations of financial performance, displayed on a tablet and printed reports. The image suggests growth and positive financial trends.