Free with trial The image shows a stock market crash represented by a downward-sloping line graph against a backdrop of a galaxy filled with stars and nebulous clouds. the line graph, rendered in a light purple hue, indicates a significant decline, culminating in a sharp drop represented by an arrow pointing downwards. the background galaxy adds a dramatic and symbolic layer, suggesting a cosmic scale of economic downturn. Trend decrease illustrations Stock market crash in a galaxy background. the image shows a stock market crash represented by a downward-sloping line graph against a backdrop of a galaxy filled with stars and nebulous clouds. the line graph, rendered in a light purple hue, indicates a significant decline, culminating in a sharp drop represented by an arrow pointing downwards. the background galaxy adds a dramatic and symbolic layer, suggesting a cosmic scale of economic downturn.
Free with trial Blue downward arrow, injured thumbs-up hand, and calculator icon highlight financial setback, risk management, medical expenses, cost analysis. Ideal for business, healthcare, budgeting. Trend decrease vectors Financial Loss Concept with Downward Arrow, Bandaged Thumbs-Up, and Calculator Symbol. Blue downward arrow, injured thumbs-up hand, and calculator icon highlight financial setback, risk management, medical expenses, cost analysis. Ideal for business, healthcare, budgeting
Free with trial The image shows a neon pink graph descending sharply against a dark blue, grid-patterned background. the graph starts high on the left, then plummets downwards with some zigzags before leveling out near the bottom. an arrow at the end of the line points downwards, emphasizing the decline. the overall effect is a visual representation of a significant drop or loss. Trend decrease illustrations Descending neon graph on a dark blue background. the image shows a neon pink graph descending sharply against a dark blue, grid-patterned background. the graph starts high on the left, then plummets downwards with some zigzags before leveling out near the bottom. an arrow at the end of the line points downwards, emphasizing the decline. the overall effect is a visual representation of a significant drop or loss.
Free with trial An abstract 3D illustration shows intertwined upward and downward arrows with stacks of coins, symbolizing financial fluctuations and market trends. Trend decrease illustrations Abstract 3D visualization of upward and downward arrows intertwined with stacks of coins. An abstract 3D illustration shows intertwined upward and downward arrows with stacks of coins, symbolizing financial fluctuations and market trends
Free with trial Three black arrows pointing down connected by horizontal lines on a white background. Trend decrease illustrations Three Black Arrows Pointing Downward Connected by Horizontal Lines direction movement. Three black arrows pointing down connected by horizontal lines on a white background
Free with trial Illustrated business chart displays a drop in finances, demonstrated through declining bar graphs and a downward trending line. Geometric shapes and a dollar sign add visual interest to the illustration. Trend decrease illustrations Financial Decline Shown by Business Chart with Graphic Elements. Illustrated business chart displays a drop in finances, demonstrated through declining bar graphs and a downward trending line. Geometric shapes and a dollar sign add visual interest to the illustration.
Free with trial A minimalist dark gray bar chart on a white background displays varying heights, illustrating data fluctuations and trends. Trend decrease illustrations Simple bar chart showing increasing and decreasing data trends. A minimalist dark gray bar chart on a white background displays varying heights, illustrating data fluctuations and trends
Free with trial Red dollar coin with a downward arrow, representing currency decline, devaluation, or financial loss. Trend decrease vectors Minimalist Red dollar coin with a downward arrow. Red dollar coin with a downward arrow, representing currency decline, devaluation, or financial loss
Free with trial Drop down red arrow business market crisis on world map red dark background. Crisis economy and investment loss graph. vector illustration fantastic design. Trend decrease vectors Drop down red arrow business market crisis on world map red dark background.
Free with trial The image displays a green line graph illustrating a sharp decline. the graph is set against a backdrop of a stylized forest scene, also rendered in shades of green. the overall impression is one of environmental or economic downturn, with the forest possibly symbolizing natural resources or a green economy. the graph's dramatic downward trajectory emphasizes the severity of the decline being depicted. Trend decrease illustrations Green decline graph with forest background. the image displays a green line graph illustrating a sharp decline. the graph is set against a backdrop of a stylized forest scene, also rendered in shades of green. the overall impression is one of environmental or economic downturn, with the forest possibly symbolizing natural resources or a green economy. the graph's dramatic downward trajectory emphasizes the severity of the decline being depicted.
Free with trial Showing helix graph tracking market data in dotted grid display, with bars and arrowed markers. Financial, technology, innovation, data, analytics, digital, futuristic. Trend decrease illustrations Showing helix graph tracking market data in dotted grid display, with bars and arrowed markers
Free with trial Red arrow pointing downward on financial graph. Business chart showing recession in economy. Digital stock market data visualization for investment analysis. Trend decrease illustrations Red arrow pointing downward on financial graph. Business chart showing recession in economy
Free with trial Conceptual image depicting real estate market analysis. A magnifying glass focuses on a brightly lit house model, surrounded by other house models and a rising graph, all set on a reflective surface. The scene suggests research, investment, and growth in the housing market. Ideal for illustrating articles or presentations on real estate trends, property valuation, and housing market forecasts. Trend decrease illustrations Real Estate Market Analysis
Free with trial Flat 3d Isometric Falling Arrow Piercing Through Businessman Hand. Investment Risk and Downtrend Stock Market Concept. Trend decrease vectors Isometric Falling Arrow Piercing Through Businessman Hand
Free with trial Financial crisis concept. Decreasing graph with falling columns. Vector illustration showing recession, bankruptcy, and economic decline. Trend decrease vectors Financial crisis concept. Decreasing graph with falling columns. Vector illustration showing recession, bankruptcy
Free with trial A bold red arrow points downwards across a dark, deeply cracked surface, metaphorically representing a market crash, financial decline, or the devastating impact of an economic recession. Trend decrease illustrations Red Downward Arrow on Cracked Earth Symbolizing Economic Recession and Financial Crisis. A bold red arrow points downwards across a dark, deeply cracked surface, metaphorically representing a market crash, financial decline, or the devastating impact of an economic recession
Free with trial Downward arrow pointing alongside a falling dollar coin with a cloud above. Ideal for finance, economics, loss, investment, risk, business, savings, simple flat metaphor. Trend decrease vectors Downward Arrow and Dollar Coin Representing Financial Decline or Economic Loss. Downward arrow pointing alongside a falling dollar coin with a cloud above. Ideal for finance, economics, loss, investment, risk, business, savings, simple flat metaphor
Free with trial Line chart tracks data trends over time, with a downward arrow implying decline and a globe representing global impact. Ideal for analytics, performance, global strategy, tracking, economics, market. Trend decrease illustrations Line Chart with Data Points, Downward Arrow, and Globe for Analysis and Global Trends. Line chart tracks data trends over time, with a downward arrow implying decline and a globe representing global impact. Ideal for analytics, performance, global strategy, tracking, economics, market
Free with trial Blue Glass 3D Bar Chart Showing Data Decline. Trend decrease illustrations Blue Glass 3D Bar Chart Showing Data Decline
Free with trial A focused hand uses red chalk drawing downward arrow on blackboard showing negative business concept and pessimistic financial decline. Trend decrease illustrations Focused hand uses red chalk drawing downward arrow on blackboard showing negative business concept and pessimistic financial. A focused hand uses red chalk. A focused hand uses red chalk drawing downward arrow on blackboard showing negative business concept and pessimistic financial decline
Free with trial Bar graph showing decreasing values alongside arrows moving toward a minimal cloud. Ideal for data analysis, statistics, regression, performance tracking, economy, analytics, simple flat metaphor. Trend decrease vectors Declining Bar Chart with Arrows and Cloud Representing Regression or Data Flow. Bar graph showing decreasing values alongside arrows moving toward a minimal cloud. Ideal for data analysis, statistics, regression, performance tracking, economy, analytics, simple flat metaphor
Free with trial A black downward trending arrow with the text recession risk below it on a white background. Trend decrease illustrations Downward trending arrow indicating recession risk on white background economy financial. A black downward trending arrow with the text recession risk below it on a white background
Free with trial Businessman hand holding digital graph with cost reduction concept showing financial growth saving strategy economic efficiency and business success in modern finance. Trend decrease illustrations Businessman hand holding digital graph with cost reduction concept showing financial growth saving strategy economic efficiency
Free with trial A minimalist graphic featuring two bold blue arrows, one pointing upwards and the other downwards, symbolizing opposing directions or changes. Isolated on white. Trend decrease illustrations Two blue arrows pointing up and down isolated on white background. A minimalist graphic featuring two bold blue arrows, one pointing upwards and the other downwards, symbolizing opposing directions or changes. Isolated on white
Free with trial A stylized declining bar chart with a downward arrow on a red, yellow, and dark backdrop, conveying a sense of financial loss. Trend decrease illustrations Declining bar chart with arrow on a red yellow and dark backdrop. a stylized declining bar chart with a downward arrow on a red, yellow, and dark backdrop, conveying a sense of financial loss
Free with trial A paper cutout illustration of two arrows, one red, one green, indicating upward & downward trends. Trend decrease illustrations Stock market growth red arrow outpacing. A paper cutout illustration of two arrows, one red, one green, indicating upward & downward trends
Free with trial Drop red down arrow illustration uction fall, dip loss, negative ward drop red down arrow. Trend decrease illustrations Drop red down arrow
Free with trial This image features a bold 2. 29% percentage symbol in metallic blue on a black background, ideal for financial presentations and business reports. Trend decrease illustrations Metallic Blue Percentage Symbol 229 on Black Background for Financial and Business Concepts. This image features a bold 2.29% percentage symbol in metallic blue on a black background, ideal for financial presentations and business reports
Free with trial Red and grey arrows pointing up and down. Trend decrease illustrations Red and grey arrows pointing up and down
Free with trial A modern smartphone displays a dynamic Bitcoin trading chart with candlestick patterns and growth percentages. A fingerprint scanner icon emphasizes secure mobile crypto investment and finance technology. Trend decrease illustrations Smartphone with Bitcoin Cryptocurrency Trading Chart and Fingerprint Security. A modern smartphone displays a dynamic Bitcoin trading chart with candlestick patterns and growth percentages. A fingerprint scanner icon emphasizes secure mobile crypto investment and finance technology
Free with trial The image features a red neon arrow pointing downwards, reflected on a dark, glossy surface. the background is a deep blue-gray, creating a stark contrast with the bright red of the arrow. the reflection is slightly blurred, adding depth to the image. the arrow appears to be floating, emphasizing its modern and minimalist design. the overall composition is clean and visually striking. Trend decrease illustrations Red neon arrow pointing downwards reflection. the image features a red neon arrow pointing downwards, reflected on a dark, glossy surface. the background is a deep blue-gray, creating a stark contrast with the bright red of the arrow. the reflection is slightly blurred, adding depth to the image. the arrow appears to be floating, emphasizing its modern and minimalist design. the overall composition is clean and visually striking.
Free with trial The image depicts a red neon arrow pointing downwards against a dark background. the arrow is sleek and minimalist, emitting a bright red glow. below the arrow, a mirrored reflection is visible on a glossy surface, enhancing the visual impact. the overall composition is simple yet striking, creating a sense of depth and direction. the red color and downward pointing arrow often symbolize decline or loss in various contexts. the dark background emphasizes the brightness of the neon arrow. Trend decrease illustrations Red neon arrow pointing down with reflection. the image depicts a red neon arrow pointing downwards against a dark background. the arrow is sleek and minimalist, emitting a bright red glow. below the arrow, a mirrored reflection is visible on a glossy surface, enhancing the visual impact. the overall composition is simple yet striking, creating a sense of depth and direction. the red color and downward pointing arrow often symbolize decline or loss in various contexts. the dark background emphasizes the brightness of the neon arrow.
Free with trial A black silhouette of a financial graph with bars and jagged lines is shown on white. Trend decrease illustrations Black silhouette of a financial graph with bars and jagged lines on white chart business. A black silhouette of a financial graph with bars and jagged lines is shown on white
Free with trial Displaying jagged red line chart declining on trading screen, with numeric labels and lens-flare. Financial, technology, analytics, investment, data visualization, digital, modern. Trend decrease illustrations Displaying jagged red line chart declining on trading screen, with numeric labels and lens-flare
Free with trial Shopping cart with a downward arrow, bar graph indicating loss, and sad face illustrating declining sales or performance. Ideal for business, ecommerce, market decline, economic loss, analytics. Trend decrease vectors Declining Sales Concept with Shopping Cart, Downward Arrow, Bar Graph, and Sad Face. Shopping cart with a downward arrow, bar graph indicating loss, and sad face illustrating declining sales or performance. Ideal for business, ecommerce, market decline, economic loss, analytics
Free with trial An isometric 3D bar chart composed of blue, gray, and orange blocks of varying heights is arranged on a white background. Trend decrease illustrations Isometric 3D bar chart with blue, gray, and orange blocks on a white background graph data. An isometric 3D bar chart composed of blue, gray, and orange blocks of varying heights is arranged on a white background
Free with trial A hand holds a glowing blue bar graph with a downward trending arrow and the word COST above. Trend decrease illustrations Man holding glowing cost reduction graph with downward arrow chart financial. A hand holds a glowing blue bar graph with a downward trending arrow and the word COST above
Free with trial A hand drawn line graph on crumpled graph paper depicts fluctuating market trends. Trend decrease illustrations Hand drawn financial graph on crumpled paper with red and blue lines. A hand drawn line graph on crumpled graph paper depicts fluctuating market trends
Free with trial Doodle style business chart showing decline with a downwards arrow. Trend decrease vectors Doodle style business chart showing decline with a downwards arrow
Free with trial Downward trending bar graph with a black arrow, representing losses. Trend decrease vectors Downward trending bar graph with a black arrow, representing losses
Free with trial Stock showing diverse collection of black and white for financial data analysis charts and graphs keywords: financial, data, analysis, charts. Trend decrease illustrations Diverse Collection of Black and White for Financial Data Analysis Charts and Graphs Keywords: financial, data
Free with trial This image shows two three-dimensional arrows against a white background. One arrow is bright green and points upwards, while the other is bright red and points downwards. The arrows have a glossy, almost reflective surface, giving them a shiny appearance. They are positioned close together, with the green arrow slightly overlapping the red arrow. The overall style is simple and clean, suitable. Trend decrease illustrations 3 D Green Up Arrow and Red Down Arrow Icons arrows. This image shows two three-dimensional arrows against a white background. One arrow is bright green and points upwards, while the other is bright red and points downwards. The arrows have a glossy, almost reflective surface, giving them a shiny appearance. They are positioned close together, with the green arrow slightly overlapping the red arrow. The overall style is simple and clean, suitable
Free with trial The image features a bold red downward-pointing arrow with a white zero percent symbol ('0%') centered inside it. This design is often used to indicate a zero percent change or a complete reduction, typically in contexts such as sales, interest rates, or financial metrics. Trend decrease illustrations Red downward arrow with zero percent symbol. The image features a bold red downward-pointing arrow with a white zero percent symbol ('0%') centered inside it. This design is often used to indicate a zero percent change or a complete reduction, typically in contexts such as sales, interest rates, or financial metrics
Free with trial Downward arrow, segmented pie chart, and analog clock suggest concepts of time management, data analysis, and decline. Ideal for productivity, efficiency, business, strategy evaluation finance. Trend decrease vectors Downward Arrow, Pie Chart, and Clock Representing Time, Decline, and Data Analysis Concept. Downward arrow, segmented pie chart, and analog clock suggest concepts of time management, data analysis, and decline. Ideal for productivity, efficiency, business, strategy evaluation finance
Free with trial Displaying financial chart at digital interface, with blue bars, two line graphs, red decline arrow. Finance, data, analytics, dashboard, technology, investment, digital. Trend decrease illustrations Displaying financial chart at digital interface, with blue bars, two line graphs, red decline arrow
Free with trial Stock market crash showing market downturn with red graph and percentage sign. Trend decrease illustrations Red graph showing a stock market crash and downturn with percentage sign. Stock market crash showing market downturn with red graph and percentage sign
Free with trial A stark red arrow plunges downwards into an empty shopping cart, symbolizing a decline in sales or consumer spending. Trend decrease illustrations Red arrow points down into empty shopping cart symbolizing decline. A stark red arrow plunges downwards into an empty shopping cart, symbolizing a decline in sales or consumer spending
Free with trial Female agent wearing a headset with laptop, gesturing at a downward graph. Ideal for customer support, analytics, communication, sales decrease, remote work, problem-solving, simple flat metaphor. Trend decrease vectors Customer support agent analyzing a decline graph using a laptop during a video meeting. Female agent wearing a headset with laptop, gesturing at a downward graph. Ideal for customer support, analytics, communication, sales decrease, remote work, problem-solving, simple flat metaphor
Free with trial The image displays a stylized representation of a stock market crash and subsequent recovery. a red neon line charts a sharp decline, culminating in a point of impact with sparks. the line then reflects upwards, indicating a rebound. the background is a dark, reflective surface, enhancing the neon glow. the right side of the image shows a blurred, bright room with window panes. the overall effect is a visual metaphor for financial volatility. Trend decrease illustrations Red neon stock market crash and recovery chart. the image displays a stylized representation of a stock market crash and subsequent recovery. a red neon line charts a sharp decline, culminating in a point of impact with sparks. the line then reflects upwards, indicating a rebound. the background is a dark, reflective surface, enhancing the neon glow. the right side of the image shows a blurred, bright room with window panes. the overall effect is a visual metaphor for financial volatility.
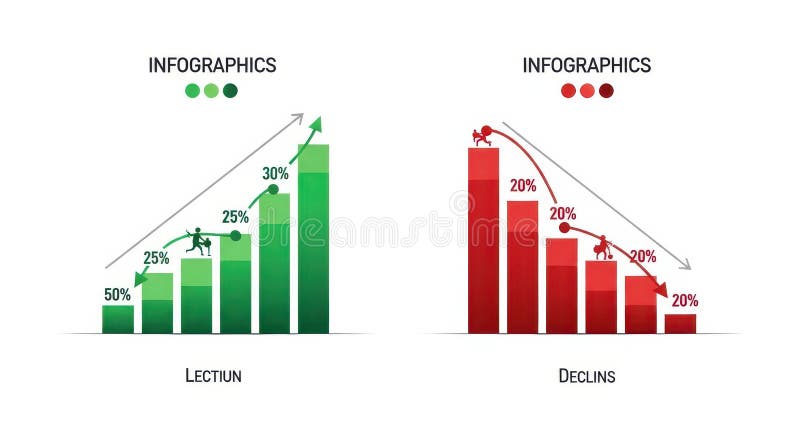
Free with trial The image displays two infographics side by side. the left infographic, titled "lection," depicts a green bar graph showing growth, starting at 50% and increasing to 30% with a figure climbing the bars. an upward-pointing arrow indicates positive growth. the right infographic, titled "declins," shows a red bar graph illustrating decline, starting at 20% and decreasing to 20% with a figure falling down the bars. a downward-pointing arrow indicates negative growth. Trend decrease illustrations Infographics showing growth and decline charts. the image displays two infographics side by side. the left infographic, titled "lection," depicts a green bar graph showing growth, starting at 50% and increasing to 30% with a figure climbing the bars. an upward-pointing arrow indicates positive growth. the right infographic, titled "declins," shows a red bar graph illustrating decline, starting at 20% and decreasing to 20% with a figure falling down the bars. a downward-pointing arrow indicates negative growth.
Free with trial Line graph with a green line and a red dot on top. The red dot is located at the top left corner of the graph. Trend decrease illustrations Graph with a green line and a red dot
Free with trial A shiny, three-dimensional red arrow is depicted, angled downwards. It is isolated against a pure white background, making it stand out clearly. Trend decrease illustrations A glossy red arrow pointing downwards isolated on white background. A shiny, three-dimensional red arrow is depicted, angled downwards. It is isolated against a pure white background, making it stand out clearly
Free with trial A black curved shape descending towards a horizontal line on a white background, symbolizing decline. Trend decrease illustrations Curved Black Shape Descending Towards a Horizontal Line on White Background Keywords: curve. A black curved shape descending towards a horizontal line on a white background, symbolizing decline
Free with trial Four vibrant lines undulating on a dark dashboard, illustrating progress over time while emphasizing key data points with distinct circles for enhanced clarity and analysis. Trend decrease vectors Four vibrant lines undulating on a dark dashboard, illustrating progress over time while emphasizing key data points
Free with trial A bar graph with descending blue, yellow, and red bars, accompanied by a downward-pointing arrow, symbolizes economic decline or negative trends on a clean white background. Trend decrease illustrations Colorful Bar Graph with Downward Arrow Illustrating Economic Decline. A bar graph with descending blue, yellow, and red bars, accompanied by a downward-pointing arrow, symbolizes economic decline or negative trends on a clean white background
Free with trial A sharp, red zigzag arrow points downwards, indicating a decline or loss, isolated on a clean white background. Trend decrease illustrations Red downward zigzag arrow isolated on white background. A sharp, red zigzag arrow points downwards, indicating a decline or loss, isolated on a clean white background
Free with trial A close-up view of four ice formations, resembling pillars or bars, arranged in descending order of height on a dark, textured surface, evoking a sense of cold and decline. Trend decrease illustrations Four ice pillars of varying heights stand on a dark, textured surface. A close-up view of four ice formations, resembling pillars or bars, arranged in descending order of height on a dark, textured surface, evoking a sense of cold and decline
Free with trial Orange Up Arrow and Teal Down Arrow Flat Design Icon for Direction or Change. Trend decrease vectors Orange Up Arrow and Teal Down Arrow Flat Design Icon for Direction or Change
Free with trial The image depicts a neon purple graph trending downwards against a dark, digital-themed background. the graph is the focal point, with its sharp angles and bright color drawing the eye. the background features a grid pattern and various digital elements, creating a futuristic and technological feel. the overall impression is one of economic downturn or decline, conveyed through the visual representation of a falling graph. Trend decrease illustrations Declining neon graph on dark digital background. the image depicts a neon purple graph trending downwards against a dark, digital-themed background. the graph is the focal point, with its sharp angles and bright color drawing the eye. the background features a grid pattern and various digital elements, creating a futuristic and technological feel. the overall impression is one of economic downturn or decline, conveyed through the visual representation of a falling graph.
Free with trial The image features a vibrant red neon arrow pointing downwards, positioned against a stark black background. the surface below is reflective, mirroring the arrow's glow and creating a sense of depth. the lighting is dramatic, emphasizing the contrast between the bright neon and the surrounding darkness. the arrow appears to be floating, adding a futuristic or abstract quality to the composition. Trend decrease illustrations Red arrow neon light on dark reflective surface. the image features a vibrant red neon arrow pointing downwards, positioned against a stark black background. the surface below is reflective, mirroring the arrow's glow and creating a sense of depth. the lighting is dramatic, emphasizing the contrast between the bright neon and the surrounding darkness. the arrow appears to be floating, adding a futuristic or abstract quality to the composition.
Free with trial A digital illustration of a declining line graph with a large downward arrow and a coin at the bottom, representing financial decline or market loss, suitable for economic and business contexts. Trend decrease illustrations Downward Trending Graph with Falling Line Chart and Coin Illustration. A digital illustration of a declining line graph with a large downward arrow and a coin at the bottom, representing financial decline or market loss, suitable for economic and business contexts
Free with trial A graphic illustrating declining gas prices, featuring a fuel pump and a downward trending red line graph, isolated on a white background. Trend decrease illustrations Falling gas prices graph with fuel pump isolated on white background. A graphic illustrating declining gas prices, featuring a fuel pump and a downward trending red line graph, isolated on a white background
Free with trial A striking 3D-rendered image featuring a blue hand emerging from the left side, gripping a red zigzag arrow pointing downward against a solid light blue background. The arrow symbolizes a decline in metrics such as financial performance, market trends, or business growth. This image is ideal for use in economic reports, editorial content, business presentations, and visual storytelling focused on loss, downturns, or negative growth. The clean design and bold color contrast make it a powerful metaphor for financial challenges and strategic analysis. Trend decrease illustrations . A striking 3D-rendered image featuring a blue hand emerging from the left side, gripping a red zigzag arrow pointing downward against a solid light blue background. The arrow symbolizes a decline in metrics such as financial performance, market trends, or business growth. This image is ideal for use in economic reports, editorial content, business presentations, and visual storytelling focused on loss, downturns, or negative growth. The clean design and bold color contrast make it a powerful metaphor for financial challenges and strategic analysis.
Free with trial This conceptual image depicts an industrial factory with a declining graph, symbolizing economic downturn, industrial decline, or environmental impact. The paper cutout style adds a unique visual appeal. The image can be used to represent concepts related to business, finance, economics, manufacturing, environmental concerns, and the impact of industrial activity. It is suitable for presentations, reports, articles, and educational materials. Trend decrease illustrations Industrial Decline and Economic Downturn Concept. This conceptual image depicts an industrial factory with a declining graph, symbolizing economic downturn, industrial decline, or environmental impact. The paper cutout style adds a unique visual appeal. The image can be used to represent concepts related to business, finance, economics, manufacturing, environmental concerns, and the impact of industrial activity. It is suitable for presentations, reports, articles, and educational materials.
Free with trial A simple black and white illustration of a bar chart and a line graph showing business growth trends, isolated on a white background. Trend decrease vectors Business growth bar chart and line graph isolated on white background. A simple black and white illustration of a bar chart and a line graph showing business growth trends, isolated on a white background
Free with trial Sad face symbolizing dissatisfaction or issues, with data point focus and declining performance graph. Ideal for business analytics, performance drops, feedback, emotions, troubleshooting, reporting. Trend decrease illustrations Sad face with declining graph and focus on data highlighting underperformance and issues. Sad face symbolizing dissatisfaction or issues, with data point focus and declining performance graph. Ideal for business analytics, performance drops, feedback, emotions, troubleshooting, reporting
Free with trial Six red arrows with percent symbols point downward. They are arranged in two rows of three on a white background. Each arrow is three-dimensional, with a bold, white percent sign prominently displayed on the front. The arrows are uniformly spaced, creating a symmetrical and orderly pattern. Trend decrease vectors Six red arrows with percent symbols pointing down on a black background. Six red arrows with percent symbols point downward. They are arranged in two rows of three on a white background. Each arrow is three-dimensional, with a bold, white percent sign prominently displayed on the front. The arrows are uniformly spaced, creating a symmetrical and orderly pattern.
Free with trial Loss Arrow 3D Icon, Isolated on White Background. Trend decrease illustrations Loss Arrow 3D Icon
Free with trial Loss Arrow 3D Icon, Isolated on White Background. Trend decrease illustrations Loss Arrow 3D Icon
Free with trial Colorful line graph illustrating growth and decline over time, with variously colored data points on a dark background, visualizing financial performance and trends. Trend decrease vectors Colorful line graph illustrating growth and decline over time, with variously colored data points on a dark background
Free with trial Growth and decline arrow graph icon. Up and down arrows symbol illustration. Trend decrease vectors Growth and decline arrow graph icon. Up and down arrows symbol
Free with trial Week over week on white paper background. Trend decrease illustrations Week over week on white paper
Free with trial Year over year on white paper background. Trend decrease illustrations Year over year on white paper
Free with trial A digital financial chart shows upward market trends. The red line and green bars rise against a grid. A gold data network overlay adds depth to the business graphic. Trend decrease illustrations Growing Financial Chart Shows Market Growth With Data Grid Background. A digital financial chart shows upward market trends. The red line and green bars rise against a grid. A gold data network overlay adds depth to the business graphic.
Free with trial This infographic-style image visually represents business growth and financial performance through various charts and graphs. A line graph illustrates revenue trends with percentage markers, a donut chart displays market share distribution, and a bar chart shows quarterly profit figures. Icons representing data, growth, and reports are subtly integrated into the background, creating a professional and informative visual for business and finance-related content. Trend decrease illustrations Business Growth and Financial Performance Analytics. This infographic-style image visually represents business growth and financial performance through various charts and graphs. A line graph illustrates revenue trends with percentage markers, a donut chart displays market share distribution, and a bar chart shows quarterly profit figures. Icons representing data, growth, and reports are subtly integrated into the background, creating a professional and informative visual for business and finance-related content.
Free with trial A visual representation of opposing forces, illustrating concepts such as growth versus decline, positive versus negative trends, or upward and downward movement in various contexts like finance or pe. Trend decrease illustrations Red down arrow and green up arrow isolated on white background. A visual representation of opposing forces, illustrating concepts such as growth versus decline, positive versus negative trends, or upward and downward movement in various contexts like finance or pe
Free with trial Financial Downtrend Visualization Showcasing Red Stock Market Analysis and Trading Fluctuations, Generated by AI. Trend decrease illustrations Financial Downtrend Visualization Showcasing Red Stock Market Analysis and Trading Fluctuations
Free with trial This image showcases a collection of finance and government icons, generated by AI, perfect for use in presentations, reports, or websites related to business, economics, or politics. The stylized monochrome design provides a professional and consistent aesthetic. Trend decrease illustrations Finance and Government Icons
Free with trial Two flat design icons representing financial trends. One shows an upward bar chart with an arrow and percentage symbol, the other a downward bar chart with a percentage symbol. Trend decrease vectors Upward and Downward Bar Chart Icons with Percentage Symbols Ai-Generated. Two flat design icons representing financial trends. One shows an upward bar chart with an arrow and percentage symbol, the other a downward bar chart with a percentage symbol