Free with trial Up and down directional arrows in vector format for versatile use. Perfect for business infographics and data visualization. EPS 10. Trend decrease vectors Up and down directional arrows in vector format for versatile use. Perfect for business infographics and data visualization. EPS 10
Free with trial 3D red bar graph with downward arrows indicating decline. Suitable for diverse creative needs. Trend decrease illustrations 3D red bar graph with downward arrows indicating decline.
Free with trial A 3D rendering depicting a stone dollar sign symbol being broken apart by a downward trending red graph. The scene suggests economic downturn, financial crisis, or market instability. The image is ideal for illustrating articles, reports, or presentations related to finance, economics, and investment. The neutral color palette provides versatility for various design applications. Trend decrease illustrations Stone Dollar Sign Crumbling with Falling Stock Market Graph. A 3D rendering depicting a stone dollar sign symbol being broken apart by a downward trending red graph. The scene suggests economic downturn, financial crisis, or market instability. The image is ideal for illustrating articles, reports, or presentations related to finance, economics, and investment. The neutral color palette provides versatility for various design applications.
Free with trial Illustration of a business activities. Trend decrease vectors Illustration of a business activities
Free with trial Illustration of a business activities. Trend decrease vectors Illustration of a business activities
Free with trial Illustration of a business activities. Trend decrease vectors Illustration of a business activities
Free with trial A 3D rendering shows a financial graph with a decreasing rate. The pink arrow points downwards, indicating a loss. The bars represent data points in a business or economic context. Trend decrease illustrations Decreasing rate financial graph on white background. A 3D rendering shows a financial graph with a decreasing rate. The pink arrow points downwards, indicating a loss. The bars represent data points in a business or economic context
Free with trial A black jagged arrow pointing diagonally downward on a white background. Clear details and vibrant colors enha. Trend decrease illustrations Black Jagged Arrow Pointing Downward On White Background direction symbol. A black jagged arrow pointing diagonally downward on a white background. Clear details and vibrant colors enha
Free with trial A black curve graph depicts a revenue slowdown on a white background. Clear details and vibrant colors enhance. Trend decrease illustrations Black curve graph showing revenue slowdown on white background chart line. A black curve graph depicts a revenue slowdown on a white background. Clear details and vibrant colors enhance
Free with trial Three black bars with downward arrows indicating decline on white background Clear details and vibrant colors. Trend decrease illustrations Three black bars with downward arrows on white background bar chart graph. Three black bars with downward arrows indicating decline on white background Clear details and vibrant colors
Free with trial Downward arrow next to a small storefront under a cloud. Ideal for business decline, e-commerce, economic downturn, retail impact, cloud-based solutions, analytics, simple flat metaphor. Trend decrease vectors Downward Arrow Beside Small Storefront Under Cloud Highlighting Business or Economic Trends. Downward arrow next to a small storefront under a cloud. Ideal for business decline, e-commerce, economic downturn, retail impact, cloud-based solutions, analytics, simple flat metaphor
Free with trial Three wooden blocks arranged in a step-like formation on a wooden surface, with an upward-pointing arrow on the middle block and a downward-pointing arrow on the top block, representing concepts of growth, decline, and change in business or finance. Trend decrease illustrations Wooden blocks with up and down arrows symbolizing business growth and decline. Three wooden blocks arranged in a step-like formation on a wooden surface, with an upward-pointing arrow on the middle block and a downward-pointing arrow on the top block, representing concepts of growth, decline, and change in business or finance
Free with trial Three stacks of coins, each topped with a wooden block featuring a downward-pointing arrow, illustrating a concept of financial loss, economic downturn, or decreasing value against a blue background. Trend decrease illustrations Decreasing stacks of coins with down arrows symbolizing financial decline. Three stacks of coins, each topped with a wooden block featuring a downward-pointing arrow, illustrating a concept of financial loss, economic downturn, or decreasing value against a blue background
Free with trial Falling Vector arrow. Downward curve set. Motion flow symbol. Dynamic line illustration. Manual vector only. No autotrace used. EPS 10. Trend decrease vectors Falling Vector arrow. Downward curve set. Motion flow symbol. Dynamic line illustration. Manual vector only. No autotrace used.
Free with trial A person in a suit analyzes a financial chart with a pen. The chart displays a red zigzag arrow pointing downward, indicating a decline. Various colorful pie charts and graphs are scattered on the table. The focus is on the financial documents and analysis tools, suggesting an office or business setting. The overall tone conveys economic downturn or negative financial trends. a i generated. Trend decrease illustrations A hand analyzes a declining financial chart with a red arrow pointing downward. A person in a suit analyzes a financial chart with a pen. The chart displays a red zigzag arrow pointing downward, indicating a decline. Various colorful pie charts and graphs are scattered on the table. The focus is on the financial documents and analysis tools, suggesting an office or business setting. The overall tone conveys economic downturn or negative financial trends. a i generated
Free with trial A white line graph with connected points and a bar chart are shown within a dark gray circle icon, representing data analysis. Trend decrease illustrations White line graph and bar chart in a dark gray circle icon data statistics. A white line graph with connected points and a bar chart are shown within a dark gray circle icon, representing data analysis
Free with trial A simple and modern silhouette illustration depicting a bull and a bear, representing the financial markets. Perfect for use in articles, presentations, or designs related to finance, investment, and the stock market. Trend decrease vectors Minimalist Silhouette Bull and Bear Symbol Illustration for Finance Concept. A simple and modern silhouette illustration depicting a bull and a bear, representing the financial markets. Perfect for use in articles, presentations, or designs related to finance, investment, and the stock market.
Free with trial A robotic hand extends toward dynamic financial graphs and data in a cosmic setting. This image symbolizes the intersection of technology and finance, showcasing innovation. Scalp. Trend decrease illustrations Futuristic robotic hand reaching towards digital financial graphs and data visualizations in a cosmic background with. A robotic hand extends toward dynamic financial graphs and data in a cosmic setting. This image symbolizes the intersection of technology and finance, showcasing innovation. Scalp
Free with trial Economic crisis and fall down stock market concept with digital downward yellow and red financial graph on dark background with dots. 3D rendering. Trend decrease illustrations Economic crisis and fall down stock market concept
Free with trial A vibrant and modern illustration of a bar graph, featuring four bars of varying heights and colors: blue, green, orange, and red. The bars are positioned on a gray horizontal line, creating a sense of data comparison and visual hierarchy. This image is ideal for representing data, statistics, business reports, financial analysis, or any concept requiring visual data representation. The clean design and bright colors make it suitable for presentations, websites, and marketing materials. Trend decrease illustrations Colorful Bar Graph Illustration. A vibrant and modern illustration of a bar graph, featuring four bars of varying heights and colors: blue, green, orange, and red. The bars are positioned on a gray horizontal line, creating a sense of data comparison and visual hierarchy. This image is ideal for representing data, statistics, business reports, financial analysis, or any concept requiring visual data representation. The clean design and bright colors make it suitable for presentations, websites, and marketing materials.
Free with trial A red downward-trending arrow overlays a background of financial documents featuring colorful charts and graphs. A person in a suit is writing on one of the pages, indicating analysis or note-taking. The setting suggests a focus on market trends, possibly within a corporate or financial context. The grid pattern across the image adds a conceptual element of data analysis. a i generated. Trend decrease illustrations Declining market trends analysis with a downward trending red arrow overlay. A red downward-trending arrow overlays a background of financial documents featuring colorful charts and graphs. A person in a suit is writing on one of the pages, indicating analysis or note-taking. The setting suggests a focus on market trends, possibly within a corporate or financial context. The grid pattern across the image adds a conceptual element of data analysis. a i generated
Free with trial A businessperson in a blue suit holds a glowing orb with upward and downward arrows labeled and cost. Trend decrease illustrations Businessperson holding glowing orb with and cost arrows above laptop hand. A businessperson in a blue suit holds a glowing orb with upward and downward arrows labeled and cost.
Free with trial A close-up shot of a Bitcoin coin against a background of a falling graph on a dark, moody background. Illustrates market downturn and financial loss. Image is generated using AI. Trend decrease illustrations Bitcoin Coin With Falling Chart. A close-up shot of a Bitcoin coin against a background of a falling graph on a dark, moody background. Illustrates market downturn and financial loss. Image is generated using AI
Free with trial A conceptual image featuring a series of ascending wooden blocks, with a green upward arrow on a lower block and a red downward arrow on a higher block, symbolizing the fluctuating nature of business, market trends, and financial performance. The image conveys concepts of success, failure, progress, and setback in a clear and concise manner. Trend decrease illustrations Wooden Blocks with Up and Down Arrows Representing Business Growth and Decline. A conceptual image featuring a series of ascending wooden blocks, with a green upward arrow on a lower block and a red downward arrow on a higher block, symbolizing the fluctuating nature of business, market trends, and financial performance. The image conveys concepts of success, failure, progress, and setback in a clear and concise manner
Free with trial A striking visual of a vibrant green arrow pointing upwards and a bold red arrow pointing downwards, symbolizing progress, finance, and directional changes. Perfect for presentations. Trend decrease illustrations Green up arrow and red down arrow icons representing growth and decline white background. A striking visual of a vibrant green arrow pointing upwards and a bold red arrow pointing downwards, symbolizing progress, finance, and directional changes. Perfect for presentations
Free with trial Female figure holding a clipboard next to a bold downward arrow and Euro coin representation. Ideal for business, economy, finance, monetary policy, market trends, economic decline, simple flat. Trend decrease vectors Female professional with clipboard standing beside downward arrow and Euro currency circle. Female figure holding a clipboard next to a bold downward arrow and Euro coin representation. Ideal for business, economy, finance, monetary policy, market trends, economic decline, simple flat
Free with trial Strategic Business Meeting on Artificial Intelligence Implementation with Quality and Cost Considerations for Enhanced Decision-Making in Modern Organizations Gluon. Trend decrease illustrations Strategic Business Meeting on Artificial Intelligence Implementation with Quality and Cost Considerations for Enhanced
Free with trial Set of six black business charts icons showing growth and decline trends with arrows and bars in vector style clear and simple design calm. Generative AI. Trend decrease vectors Business growth and decline charts arrows statistics bar graph icons vector illustration. Set of six black business charts icons showing growth and decline trends with arrows and bars in vector style clear and simple design calm. Generative AI
Free with trial The image depicts a downward trending red arrow over a series of stacked gold coins, illustrating a financial decline or loss of wealth. Trend decrease illustrations Financial decline illustrated by descending coin stacks and downward arrow. The image depicts a downward trending red arrow over a series of stacked gold coins, illustrating a financial decline or loss of wealth
Free with trial Smiling blue face beside a decreasing bar graph, signifying satisfaction, feedback, or performance trends. Ideal for analytics, feedback, emotions, surveys, performance data presentation simple. Trend decrease vectors Positive Feedback Represented by Happy Face and Declining Bar Graph. Smiling blue face beside a decreasing bar graph, signifying satisfaction, feedback, or performance trends. Ideal for analytics, feedback, emotions, surveys, performance data presentation simple
Free with trial Downward graph with sad face, warning sign, and thumbs-up suggesting acceptance or strategy. Ideal for business trends, financial loss, feedback, failure impact, caution, recovery simple flat. Trend decrease vectors Business Performance Decline Concept with Sad Face, Graph, Warning Sign, and Thumbs-Up Gesture. Downward graph with sad face, warning sign, and thumbs-up suggesting acceptance or strategy. Ideal for business trends, financial loss, feedback, failure impact, caution, recovery simple flat
Free with trial A macro shot of a negative stock chart in the background and the symbol of the company next to the chart. Concept of declining profits and failure. Image is generated using AI. Trend decrease illustrations Stock Price Drop Symbol on Chart. A macro shot of a negative stock chart in the background and the symbol of the company next to the chart. Concept of declining profits and failure. Image is generated using AI
Free with trial Wooden blocks spelling COST sit atop stacks of coins, with white arrows pointing downwards, signifying cost reduction or savings. Trend decrease illustrations Reducing costs with financial growth and downward trends. Wooden blocks spelling COST sit atop stacks of coins, with white arrows pointing downwards, signifying cost reduction or savings
Free with trial A graphic illustrating a stress zone with a downward trending chart and arrow. Clear details and vibrant color. Trend decrease illustrations Stress zone graphic with downward trending chart and arrow anxiety pressure. A graphic illustrating a stress zone with a downward trending chart and arrow. Clear details and vibrant color
Free with trial A visual representation of declining trends, depicted by a graph with red and blue lines moving downwards, symbolizing a negative trajectory or market shift. Trend decrease illustrations Downward trending graph with word trends. A visual representation of declining trends, depicted by a graph with red and blue lines moving downwards, symbolizing a negative trajectory or market shift
Free with trial This striking image depicts a global oil market decline, featuring barrels and a red arrow, symbolizing economic downturn and financial crisis. Trend decrease illustrations Global oil market decline represented by black barrels and red downward arrow over a world map in dark background. This striking image depicts a global oil market decline, featuring barrels and a red arrow, symbolizing economic downturn and financial crisis
Free with trial This striking image depicts a red globe and barrels, symbolizing economic downturn, financial loss, and market volatility, set against a dark background. Trend decrease illustrations Global Economic Crisis Concept with Red Globe and Barrel Symbols Representing Market Downturn on Black Background. This striking image depicts a red globe and barrels, symbolizing economic downturn, financial loss, and market volatility, set against a dark background
Free with trial This image showcases gleaming gold bars arranged on a digital screen displaying a dynamic stock market chart, generated by AI. The juxtaposition highlights the relationship between precious metals and financial markets, suggesting investment opportunities and market volatility. The image is visual. Trend decrease illustrations Gold Bullion & Stock Market Chart. This image showcases gleaming gold bars arranged on a digital screen displaying a dynamic stock market chart, generated by AI. The juxtaposition highlights the relationship between precious metals and financial markets, suggesting investment opportunities and market volatility. The image is visual
Free with trial Blue sad face next to a declining line graph in a calendar frame under a cloud. Ideal for business loss, economic crisis, emotional impact, failure, disappointment, analytics, trends. Simple flat. Trend decrease vectors Sad face and declining data chart representing failure, downturn, or negative outcome concept. Blue sad face next to a declining line graph in a calendar frame under a cloud. Ideal for business loss, economic crisis, emotional impact, failure, disappointment, analytics, trends. Simple flat
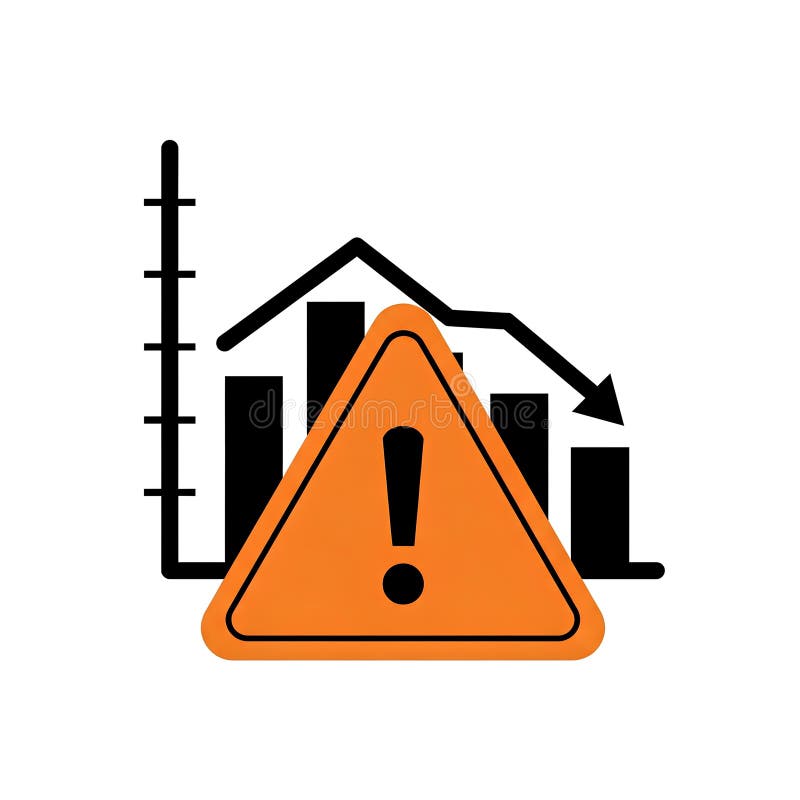
Free with trial Illustration of a downward trending graph with an orange warning sign in the foreground. The graph depicts a decline in performance or value. The warning sign highlights potential risks or negative outcomes. This image can be used to represent financial loss, economic downturn, business failure, or any situation where caution is advised. Trend decrease illustrations Warning Sign with Declining Graph. Illustration of a downward trending graph with an orange warning sign in the foreground. The graph depicts a decline in performance or value. The warning sign highlights potential risks or negative outcomes. This image can be used to represent financial loss, economic downturn, business failure, or any situation where caution is advised.
Free with trial Downward Business Graph with Arrows Financial Loss and Market Decline Concept. Trend decrease vectors Downward Business Graph with Arrows Financial Loss and Market Decline Concept
Free with trial Hand drawn up and down arrows brushstroke icons. Trend decrease illustrations Black brushstroke arrows pointing up and down on white background abstract direction symbols for navigation, growth and. Hand drawn up and down arrows brushstroke icons
Free with trial A 3D render of a blue circular button with a subtle shadow. A white arrow with a gradient effect points downwards, with the word "Downward" written in black text across its surface. The image has a transparent background. Trend decrease illustrations Downward Arrow Icon on Blue Circle direction movement. A 3D render of a blue circular button with a subtle shadow. A white arrow with a gradient effect points downwards, with the word "Downward" written in black text across its surface. The image has a transparent background
Free with trial Downward arrow, magnifying glass, dollar sign indicate declining trends, financial analysis, revenue downturn. Ideal for business, finance, investment, market trends loss economic study simple. Trend decrease vectors Declining Trends in Business Revenue with Analysis and Financial Focus. Downward arrow, magnifying glass, dollar sign indicate declining trends, financial analysis, revenue downturn. Ideal for business, finance, investment, market trends loss economic study simple
Free with trial Red downturn arrow sticker, 3D rendered with a transparent background. Trend decrease illustrations Red downturn arrow sticker, 3D rendered with a transparent background.
Free with trial Concept image representing a falling real estate market. Features a miniature house model, a red downward arrow, and burlap sacks symbolizing economic uncertainty. Trend decrease illustrations Real Estate Decline Concept with House and Arrow Good Resolution Stock Photo. Concept image representing a falling real estate market. Features a miniature house model, a red downward arrow, and burlap sacks symbolizing economic uncertainty.
Free with trial A 3D rendering depicts a scale, one side holding euro-shaped rocks, the other a dollar symbol with a downward arrow. The euro side is crumbling, signifying economic instability and the falling value of the euro against the dollar. The image symbolizes the current economic disparity and potential ri. Trend decrease illustrations Euro vs Dollar: Economic Imbalance. A 3D rendering depicts a scale, one side holding euro-shaped rocks, the other a dollar symbol with a downward arrow. The euro side is crumbling, signifying economic instability and the falling value of the euro against the dollar. The image symbolizes the current economic disparity and potential ri
Free with trial Abstract 3D render of a financial growth chart. The image features a series of vertical bars, some in teal and others in orange, representing data points on a graph. The bars increase in height towards the right, suggesting positive growth or progress. The chart is set against a dark background with a subtle grid pattern and a reflective surface, adding depth and visual interest. Suitable for illustrating financial reports, market analysis, or business trends. Trend decrease illustrations Abstract Financial Growth Chart. Abstract 3D render of a financial growth chart. The image features a series of vertical bars, some in teal and others in orange, representing data points on a graph. The bars increase in height towards the right, suggesting positive growth or progress. The chart is set against a dark background with a subtle grid pattern and a reflective surface, adding depth and visual interest. Suitable for illustrating financial reports, market analysis, or business trends.
Free with trial Orange arrow pointing downward indicating a financial decline in a factory setting. Concept of economic downturn or falling production in industry. Trend decrease illustrations Orange arrow pointing downward indicating a financial decline in a factory setting
Free with trial Paper cutouts Upward red arrow, zigzag green arrow & downward red arrow on pastel background. Trend decrease illustrations Red and green arrows up and. Paper cutouts Upward red arrow, zigzag green arrow & downward red arrow on pastel background
Free with trial A blue bar and line graph showing upward financial trends against a backdrop of a world map, symbolizing global economic growth and market expansion. Trend decrease illustrations Global business growth chart with world map background. A blue bar and line graph showing upward financial trends against a backdrop of a world map, symbolizing global economic growth and market expansion
Free with trial A simple black silhouette of a bar chart with varying heights on a white background. The icon represents data analysis and statistical representation. Trend decrease vectors Bar chart icon for data analysis and statistics graph. A simple black silhouette of a bar chart with varying heights on a white background. The icon represents data analysis and statistical representation
Free with trial Up and down sign with green and black arrows in flat style showing movement direction and sales change. Vector illustration of a sales bar chart icon used as an elevator symbol or universal pictogram. Trend decrease vectors Up and down sign with green and black arrows in flat style showing movement direction
Free with trial A vibrant red arrow curves downwards, pointing to the right, isolated on a clean white background. Trend decrease illustrations Red downward curved arrow isolated on white background. A vibrant red arrow curves downwards, pointing to the right, isolated on a clean white background
Free with trial A graph displays trading data with green and red bars showing price changes during a stock trading session. Investors analyze the fluctuations and trends. Trend decrease vectors A graph displays trading data with green and red bars showing price changes during a stock trading session. Investors analyze the
Free with trial Black icon of an upward arrow and a downward arrow on a white background Clear details and vibrant colors enha. Trend decrease illustrations Up and down arrows icon on a white background direction movement. Black icon of an upward arrow and a downward arrow on a white background Clear details and vibrant colors enha
Free with trial A thick black curved arrow points downwards and to the right on a white background. Trend decrease illustrations Black Curved Arrow Pointing Down and to the Right on White downward direction. A thick black curved arrow points downwards and to the right on a white background
Free with trial Economy downturn concept showing declining bar graph with red arrow, background,. Trend decrease illustrations Economy downturn concept showing declining bar graph with red arrow, background
Free with trial Sixteen simple yellow candlestick charts with black lines on a white background, arranged in a four by four grid. Trend decrease vectors Vector illustration of sixteen yellow candlestick charts. Sixteen simple yellow candlestick charts with black lines on a white background, arranged in a four by four grid
Free with trial Stacks of gold coins rise incrementally, aligning with a candlestick chart. The chart shows alternating red and green candlesticks, increasing in height and following an upward trend. This visual represents financial growth and market analysis. Candlesticks typically illustrate market price movements in trading, where red indicates a decrease and green an increase in value. Trend decrease vectors Candlestick Chart & Gold Coins: Rising Stock Market Growth. Stacks of gold coins rise incrementally, aligning with a candlestick chart. The chart shows alternating red and green candlesticks, increasing in height and following an upward trend. This visual represents financial growth and market analysis. Candlesticks typically illustrate market price movements in trading, where red indicates a decrease and green an increase in value.
Free with trial Ai-Generated. Professional chart stock image featuring set of black and white minimalist chart and graph line icons. Trend decrease vectors Set of black and white minimalist chart and graph line icons
Free with trial A collage of various hand-drawn charts and graphs in shades of blue, illustrating business growth, data analysis, and financial trends. The collection includes bar charts, line graphs, and pie charts, all rendered with a sketchy, artistic style. These visuals are perfect for presentations, reports, or any project requiring a dynamic and informative representation of data and progress. Trend decrease illustrations Hand-Drawn Business Growth Charts and Graphs Collection. A collage of various hand-drawn charts and graphs in shades of blue, illustrating business growth, data analysis, and financial trends. The collection includes bar charts, line graphs, and pie charts, all rendered with a sketchy, artistic style. These visuals are perfect for presentations, reports, or any project requiring a dynamic and informative representation of data and progress.
Free with trial Abstract illustration of business growth, featuring bar graphs and line graphs in shades of blue and grey. The image conveys concepts of data analysis, progress, and financial performance. Suitable for presentations, reports, and marketing materials related to business, finance, and technology. Trend decrease illustrations Abstract Business Growth Chart. Abstract illustration of business growth, featuring bar graphs and line graphs in shades of blue and grey. The image conveys concepts of data analysis, progress, and financial performance. Suitable for presentations, reports, and marketing materials related to business, finance, and technology.
Free with trial A stark red arrow zigzags downwards, powerfully representing economic downturns, market crashes, and negative financial trends. This visual signifies a crisis or significant drop. Trend decrease illustrations Red downward arrow symbolizing financial decline and economic recession trends. A stark red arrow zigzags downwards, powerfully representing economic downturns, market crashes, and negative financial trends. This visual signifies a crisis or significant drop
Free with trial Stacked black oil barrels on a circular platform with a prominent red downward-pointing arrow. Isolated on a transparent background. Trend decrease vectors Oil barrels with red downward arrow isolated on a transparent background black. Stacked black oil barrels on a circular platform with a prominent red downward-pointing arrow. Isolated on a transparent background
Free with trial A conceptual illustration of market analysis featuring a bar chart, magnifying glass, upward and downward arrows, and business icons on white. Trend decrease illustrations Market Analysis Concept with Bar Chart Magnifying Glass and Upward Arrow graph. A conceptual illustration of market analysis featuring a bar chart, magnifying glass, upward and downward arrows, and business icons on white
Free with trial A black downward arrow with a percentage symbol and a jagged line inside it on a white background. Trend decrease illustrations Black downward arrow with percentage sign and jagged line on white image photo. A black downward arrow with a percentage symbol and a jagged line inside it on a white background
Free with trial Worried man holding a red downward pointing arrow represents financial decline or business failure. Flat vector illustration isolated on white background. Trend decrease illustrations Worried man holding a red downward pointing arrow represents financial decline or business failure
Free with trial Mathematical showing black curve graph showing exponential decay on white background keywords: graph, chart. Trend decrease illustrations Black curve graph showing exponential decay on white background Keywords: graph, chart, curve. Mathematical showing black curve graph showing exponential decay on white background keywords: graph, chart
Free with trial A graph with a curved line labeled "SOFT LANDING" shows a gradual decline on white. Trend decrease illustrations Graph showing a soft landing curve with text on white background chart decline. A graph with a curved line labeled "SOFT LANDING" shows a gradual decline on white
Free with trial A curved orange arrow with a lighter orange segment pointing downwards, isolated on a clean white background. Trend decrease illustrations Orange arrow pointing down isolated on white background. A curved orange arrow with a lighter orange segment pointing downwards, isolated on a clean white background
Free with trial The image depicts a line graph with fluctuating values, marked by upward and downward arrows indicating trends. The graph starts at a low point, rises sharply, dips, and then continues to fluctuate with peaks and troughs. There are arrows pointing up and down at various points on the graph, suggesting increases and decreases in the values. The graph is set against a light, transparent background. Trend decrease illustrations A fluctuating line graph with upward and downward trends highlighted by arrows. The image depicts a line graph with fluctuating values, marked by upward and downward arrows indicating trends. The graph starts at a low point, rises sharply, dips, and then continues to fluctuate with peaks and troughs. There are arrows pointing up and down at various points on the graph, suggesting increases and decreases in the values. The graph is set against a light, transparent background
Free with trial Negative red down arrows illustration turn loss, drop slump, dip uction negative red down arrows. Trend decrease illustrations Negative red down arrows
Free with trial A black and white illustration features a thermometer, a warning triangle with an exclamation mark, a percentage symbol, and a downward trending arrow. Trend decrease vectors Warning Sign with Thermometer, Percentage Symbol, and Downward Arrow danger alert. A black and white illustration features a thermometer, a warning triangle with an exclamation mark, a percentage symbol, and a downward trending arrow
Free with trial A 3D bar chart with two red bars and one taller green bar, topped by a percentage symbol in a circle. Trend decrease illustrations 3d bar chart illustrating percentage growth and decline. A 3D bar chart with two red bars and one taller green bar, topped by a percentage symbol in a circle
Free with trial 3D rendered sticker of a red downturn arrow, with a transparent background. Trend decrease illustrations 3D rendered sticker of a red downturn arrow, with a transparent background.
Free with trial Several white and black arrows point upward at different angles on a light background. One black arrow in the upper right hand corner points downward. Trend decrease illustrations Arrows Indicate Growth Upward, One Arrow Points Downward. Several white and black arrows point upward at different angles on a light background. One black arrow in the upper right hand corner points downward.
Free with trial A close-up of paper cutouts, showing a red background and a declining green arrow. Trend decrease illustrations Red paper with green arrow up. A close-up of paper cutouts, showing a red background and a declining green arrow
Free with trial Concept of economic crash with connected icons. Trend decrease illustrations Concept of economic crash
Free with trial Stacks of silver coins ascend with a red arrow graph line indicating growth, contrasted by a blue downward arrow and house outlines. Trend decrease illustrations Stacks of coins with rising and falling graph lines and house outlines money finance. Stacks of silver coins ascend with a red arrow graph line indicating growth, contrasted by a blue downward arrow and house outlines