Free with trial Illustration of a smartphone displaying financial charts and a stack of gold coins with dollar signs. Arrows circulate around the phone, suggesting a cycle of investment and growth. The image represents mobile banking, online trading, and the potential for financial success through digital platforms. Trend decrease illustrations Mobile Investment and Financial Growth. Illustration of a smartphone displaying financial charts and a stack of gold coins with dollar signs. Arrows circulate around the phone, suggesting a cycle of investment and growth. The image represents mobile banking, online trading, and the potential for financial success through digital platforms.
Free with trial Colorful bar graph with stacked segments illustrating growth and data analysis. Trend decrease vectors Colorful bar graph with stacked segments illustrating growth and data analysis
Free with trial Business decline, Businessman examines decreasing bar graph and chart. Trend decrease vectors Business decline, Businessman examines decreasing bar graph and chart
Free with trial A graph with a reduction report. A dagram showing the recession and bankruptcy. Business and finance concept. Vector illustration. Trend decrease vectors Graph with a reduction report. A dagram showing the recession and bankruptcy. Business and finance concept. Vector illustration
Free with trial This vibrant illustration showcases a bold red arched arrow descending sharply against a clean white textured background. The drawing style mimics a crayon or colored pencil sketch giving it a playful and attention-grabbing aesthetic. Rendered by Ai, this graphic element is perfect for indicating trends direction or highlighting specific information on marketing materials or websites. It. Trend decrease illustrations Vibrant red crayon arrow showing downward motion. This vibrant illustration showcases a bold red arched arrow descending sharply against a clean white textured background. The drawing style mimics a crayon or colored pencil sketch giving it a playful and attention-grabbing aesthetic. Rendered by Ai, this graphic element is perfect for indicating trends direction or highlighting specific information on marketing materials or websites. It
Free with trial Abstract stock market chart with red and green candlesticks illustrating financial data and trading trends. Perfect for representing economic analysis, investment strategies, or business reporting. Trend decrease illustrations Dynamic Stock Market Chart Displaying Fluctuating Trends and Analytics. Abstract stock market chart with red and green candlesticks illustrating financial data and trading trends. Perfect for representing economic analysis, investment strategies, or business reporting
Free with trial Dramatic red arrow shows oil price drop due to an embargo effect on charts and oil barrels Perfect for financial news and global trade articles. Trend decrease illustrations Illustration of an oil embargo against a backdrop of declining market graphs. Dramatic red arrow shows oil price drop due to an embargo effect on charts and oil barrels Perfect for financial news and global trade articles
Free with trial Bar graph displays a colorful representation of business growth and financial success with bars increasing in height and vibrant colors on a reflective surface indicating positive trends. Trend decrease illustrations Colorful bar graph showing growth and success in business and finance on a reflective surface. Bar graph displays a colorful representation of business growth and financial success with bars increasing in height and vibrant colors on a reflective surface indicating positive trends.
Free with trial Three wooden blocks arranged in a row on a white surface. The left block has a green upward arrow, the middle has a black percentage sign, and the right has a red downward arrow. Trend decrease illustrations Three wooden blocks with green up arrow percent sign and red down arrow cube. Three wooden blocks arranged in a row on a white surface. The left block has a green upward arrow, the middle has a black percentage sign, and the right has a red downward arrow
Free with trial A bar chart illustrating a significant decline or failure, marked by a red cross, signifying negative business outcomes and economic setbacks. Trend decrease illustrations Bar chart with red cross indicating failure isolated on white background. A bar chart illustrating a significant decline or failure, marked by a red cross, signifying negative business outcomes and economic setbacks
Free with trial A laptop screen displays financial data, illuminated against a blurry background, suggesting analysis. Trend decrease illustrations Laptop displays dynamic financial data represented in charts and graphs. A laptop screen displays financial data, illuminated against a blurry background, suggesting analysis
Free with trial A golden house miniature sits on a smartphone screen displaying stock market charts, surrounded by stacks of gold coins. This image represents the concept of investing in real estate through mobile apps and online platforms, highlighting the potential for financial growth and digital investment strategies in the property market. Trend decrease illustrations Real Estate Investment on Mobile. A golden house miniature sits on a smartphone screen displaying stock market charts, surrounded by stacks of gold coins. This image represents the concept of investing in real estate through mobile apps and online platforms, highlighting the potential for financial growth and digital investment strategies in the property market.
Free with trial A striking symbol featuring the word LOSS in white, set against a glossy black, starburst-like shape. This design evokes a sense of negative impact or data loss. Trend decrease illustrations Glossy black loss indicator symbol with radial lines. A striking symbol featuring the word LOSS in white, set against a glossy black, starburst-like shape. This design evokes a sense of negative impact or data loss
Free with trial A businessman gestures towards a downward-trending red arrow on a graph, illustrating concepts of financial decline, market downturn, economic recession, investment loss, and business failure. The image is clean, using a white background, and ideal for presentations or articles related to financial crisis and negative trends, generated by AI. Trend decrease illustrations Businessman showing decreasing red graph arrow down. A businessman gestures towards a downward-trending red arrow on a graph, illustrating concepts of financial decline, market downturn, economic recession, investment loss, and business failure. The image is clean, using a white background, and ideal for presentations or articles related to financial crisis and negative trends, generated by AI.
Free with trial A vibrant 3d rendering of a cloud with percentage symbols, ideal for promotions, sales, and discounts. Trend decrease illustrations Eye-catching 3d render featuring golden percentage symbols in a bright design. A vibrant 3d rendering of a cloud with percentage symbols, ideal for promotions, sales, and discounts.
Free with trial A black curved arrow pointing downwards on a plain white background. Clear details and vibrant colors enhance. Trend decrease illustrations Black curved arrow pointing downwards on a white background direction. A black curved arrow pointing downwards on a plain white background. Clear details and vibrant colors enhance
Free with trial A large golden coin with a white dollar sign sits next to a smaller silver coin with an orange down arrow. Two orange arrows point downwards. Trend decrease illustrations Golden dollar coin with white dollar sign and orange down arrows money currency. A large golden coin with a white dollar sign sits next to a smaller silver coin with an orange down arrow. Two orange arrows point downwards
Free with trial White Bar Graph Decreasing on Light Blue Background. Trend decrease illustrations White Bar Graph Decreasing on Light Blue Background
Free with trial Isometric illustration of a woman analyzing a graph with a magnifying glass, laptop, and coins, representing finance and business analysis. Trend decrease vectors Woman analyzes graph with magnifying glass and laptop coin. isometric illustration of a woman analyzing a graph with a magnifying glass, laptop, and coins, representing finance and business analysis.
Free with trial Percent word block on white background. Trend decrease illustrations Percent word block on white
Free with trial Simple line graph illustrating data points and trends. Ideal for presentations, reports, and infographics related to business analysis, market research, or financial reporting. Trend decrease vectors Simple Line Graph, Data Visualization, Business Chart. Simple line graph illustrating data points and trends. Ideal for presentations, reports, and infographics related to business analysis, market research, or financial reporting.
Free with trial Bright, colorful stock chart on dark screen. Fluctuations lines and grid representing data and trends. Stock photo. Trend decrease illustrations Bright, colorful stock chart on dark screen. Fluctuations lines and grid representing data and trends
Free with trial A stacked area chart performance data with distinct colored segments in a rainbow gradient. The vertical axis percentages from 0% to 170%, and the horizontal axis percentage values. Trend decrease illustrations Stacked area chart showing level performance with rainbow colors and percentage axis graph data. A stacked area chart performance data with distinct colored segments in a rainbow gradient. The vertical axis percentages from 0% to 170%, and the horizontal axis percentage values
Free with trial Conceptual financial downturn graphic representing bankruptcy, market volatility, economic recession, investment collapse, negative financial cycles, declining stability uncertain economic conditions. Trend decrease illustrations Conceptual financial downturn graphic representing bankruptcy, market volatility, economic recession, investment collapse
Free with trial Red graph plummeting down, illustrating market crash, downturn, and financial crisis, with percentage and dollar sign. Trend decrease illustrations Market crash showing economic downturn with falling graph and percentage symbol. Red graph plummeting down, illustrating market crash, downturn, and financial crisis, with percentage and dollar sign
Free with trial This image showcases vibrant 3D bar and line charts, generated by AI, offering a dynamic visual representation of business data. The colorful design effectively communicates trends and comparisons across multiple data sets, providing a clear and engaging overview of key performance indicators. Trend decrease illustrations AI-Generated 3D Business Charts. This image showcases vibrant 3D bar and line charts, generated by AI, offering a dynamic visual representation of business data. The colorful design effectively communicates trends and comparisons across multiple data sets, providing a clear and engaging overview of key performance indicators.
Free with trial Hand pushing on a declining graph representing business regression and stock market downturns. Trend decrease illustrations Business regression
Free with trial Hand pushing on a declining graph representing business regression and stock market downturns. Trend decrease illustrations Business regression
Free with trial A vibrant collection of hand-drawn business charts and graphs, rendered in blue tones. The set includes various types of visualizations like bar charts, line graphs, and a pie chart, all with a sketchy, illustrative style. These visuals are ideal for presentations, reports, and infographics related to finance, data analysis, growth, and business performance. Trend decrease illustrations Hand-Drawn Business Charts and Graphs Collection. A vibrant collection of hand-drawn business charts and graphs, rendered in blue tones. The set includes various types of visualizations like bar charts, line graphs, and a pie chart, all with a sketchy, illustrative style. These visuals are ideal for presentations, reports, and infographics related to finance, data analysis, growth, and business performance.
Free with trial A single, vibrant red arrow with a slight sheen curves downwards, presented clearly on a plain white background. Trend decrease illustrations A bright red curved arrow pointing downwards isolated on white background. A single, vibrant red arrow with a slight sheen curves downwards, presented clearly on a plain white background
Free with trial This image features two prominent arrows pointing upwards one green and one red symbolizing contrasting financial performance or progress in different areas. Trend decrease illustrations Two upward arrows green and red showing growth progress and contrasting trends. This image features two prominent arrows pointing upwards one green and one red symbolizing contrasting financial performance or progress in different areas
Free with trial Analyze Data with Graphs on Tablet, Business Growth Concept and Wood Background , subtle gradient. Trend decrease illustrations Analyze Data with Graphs on Tablet, Business Growth Concept and Wood Background
Free with trial This image features a set of up and down arrows in three color variations (black, red, and a gradient from red to blue). Trend decrease vectors Up and Down Arrows in Black, Red, and Blue. This image features a set of up and down arrows in three color variations (black, red, and a gradient from red to blue).
Free with trial Bull and bear animals depicted with upward and downward stock price chart candles. Trend decrease illustrations Bull and Bear Market Symbols with Stock Price Charts. Bull and bear animals depicted with upward and downward stock price chart candles
Free with trial A hand holds arrows pointing up and down, symbolizing business growth, financial success, investment opportunities, and the analysis of market trends. Trend decrease illustrations A hand holding arrows pointing up and down, representing business growth and loss. A hand holds arrows pointing up and down, symbolizing business growth, financial success, investment opportunities, and the analysis of market trends
Free with trial A futuristic visualization depicts data analysis, charts, and graphs within a digital, high-tech environment. Trend decrease illustrations Complex data analysis illustrated within an abstract futuristic environment. A futuristic visualization depicts data analysis, charts, and graphs within a digital, high-tech environment
Free with trial Business performance decline icon vector. Productivity drop and process efficiency loss symbol. Trend decrease vectors Business performance decline icon. Productivity drop and process efficiency loss symbol
Free with trial Red curved arrow pointing downwards on a white background. Trend decrease vectors Red curved arrow pointing downwards
Free with trial Wooden toy houses illustrate real estate market trends. Created with the help of Generative AI tools. Trend decrease illustrations Wooden toy houses illustrate real estate market trends.
Free with trial An abstract digital rendering of a financial market chart with a prominent red line indicating fluctuations in a stock market or trading scenario, set against a background of data streams and numerical information. It can be used for visualizing economic trends or for representing financial analytics. Trend decrease illustrations Abstract financial chart depicting market trends and data analysis interface. An abstract digital rendering of a financial market chart with a prominent red line indicating fluctuations in a stock market or trading scenario, set against a background of data streams and numerical information. It can be used for visualizing economic trends or for representing financial analytics
Free with trial A bar chart showing a steady decline with a red downward arrow, symbolizing financial loss, economic downturn, business decline, or negative performance trends. Trend decrease illustrations Economic Downtrend Bar Chart for Business concept 3d Rendering. A bar chart showing a steady decline with a red downward arrow, symbolizing financial loss, economic downturn, business decline, or negative performance trends
Free with trial A bar chart showing a steady decline with a red downward arrow, symbolizing financial loss, economic downturn, business decline, or negative performance trends. Trend decrease illustrations Economic Downtrend Bar Chart for Business concept 3d Rendering. A bar chart showing a steady decline with a red downward arrow, symbolizing financial loss, economic downturn, business decline, or negative performance trends
Free with trial A bar chart showing a steady decline with a red downward arrow, symbolizing financial loss, economic downturn, business decline, or negative performance trends. Trend decrease illustrations Economic Downtrend Bar Chart for Business concept 3d Rendering. A bar chart showing a steady decline with a red downward arrow, symbolizing financial loss, economic downturn, business decline, or negative performance trends
Free with trial Abstract 3D Bar Chart Showing Data Growth. Trend decrease illustrations Abstract 3D Bar Chart Showing Data Growth
Free with trial 3d bar chart with orange and green bars on a blue grid background isolated on white. Trend decrease illustrations 3d bar chart with orange and green bars on blue grid background graph data. 3d bar chart with orange and green bars on a blue grid background isolated on white
Free with trial An icon representing financial downturn, featuring a stack of coins and a line graph with a downward arrow, indicating a decrease in value or performance. This visual signifies economic hardship or in. Trend decrease vectors Graph showing financial decline with coins isolated on transparent background. An icon representing financial downturn, featuring a stack of coins and a line graph with a downward arrow, indicating a decrease in value or performance. This visual signifies economic hardship or in
Free with trial This whiteboard displays hand-drawn charts illustrating a sharp market decline. The red lines, representing a dramatic downturn, are prominently featured, alongside other less defined financial graphs. This image was generated by AI for illustrative purposes. Trend decrease illustrations Red Ink Market Crash Whiteboard. This whiteboard displays hand-drawn charts illustrating a sharp market decline. The red lines, representing a dramatic downturn, are prominently featured, alongside other less defined financial graphs. This image was generated by AI for illustrative purposes.
Free with trial Modern smartphone displaying financial data generative ai image. Trend decrease illustrations Modern smartphone displaying financial data
Free with trial The image shows a hand holding holographic arrows pointing up and down, representing growth and decline, with percentages shown. It symbolizes business trends. Trend decrease illustrations A hand holding holographic arrows pointing up and down with percentages shown. The image shows a hand holding holographic arrows pointing up and down, representing growth and decline, with percentages shown. It symbolizes business trends
Free with trial Blood sugar tracking concept. Illustration of stress affecting glucose levels with people meditating and expressing concern. Vector illustration. Trend decrease vectors Blood Sugar Tracking. Flat Vector. Blood sugar tracking concept. Illustration of stress affecting glucose levels with people meditating and expressing concern. Vector illustration.
Free with trial A pair of hands holds a sheet of paper displaying a red line graph on a grid pattern the graph illustrates a downward trend, indicating a decline in business, finance or economy the image represents loss, failure, or a recession, generated by AI. Trend decrease illustrations Hands holding paper showing a declining red business graph data. a pair of hands holds a sheet of paper displaying a red line graph on a grid pattern the graph illustrates a downward trend, indicating a decline in business, finance or economy the image represents loss, failure, or a recession, generated by AI.
Free with trial Women in technology concept. Analyzing cryptocurrency trends and market data. Collaboration in digital finance research. Vector illustration. Trend decrease vectors Women In Technology. Flat Vector. Women in technology concept. Analyzing cryptocurrency trends and market data. Collaboration in digital finance research. Vector illustration.
Free with trial This 3D rendering showcases stacks of Bitcoin-like coins alongside a rising bar graph, illustrating cryptocurrency market growth. The image is generated by AI and ideal for illustrating financial concepts related to digital currencies. Trend decrease illustrations Cryptocurrency Growth Chart. This 3D rendering showcases stacks of Bitcoin-like coins alongside a rising bar graph, illustrating cryptocurrency market growth. The image is generated by AI and ideal for illustrating financial concepts related to digital currencies.
Free with trial A conceptual image depicting a factory with a downward trending graph, symbolizing a decline in production or industrial recession. The image uses a paper craft style, showing hands interacting with the elements. Ideal for illustrating economic downturn, manufacturing challenges, or automation impact on jobs. The dark smoke adds a visual element of pollution. Trend decrease illustrations Factory Production Decline: Industrial Recession Concept. A conceptual image depicting a factory with a downward trending graph, symbolizing a decline in production or industrial recession. The image uses a paper craft style, showing hands interacting with the elements. Ideal for illustrating economic downturn, manufacturing challenges, or automation impact on jobs. The dark smoke adds a visual element of pollution.
Free with trial View of Graphs showing declining CO₂ emissions. Trend decrease illustrations Graphs showing declining CO₂ emissions
Free with trial Visual representation of a financial downturn. A bar chart shows a sharp decline, accompanied by a warning sign and a gold dollar coin, symbolizing economic trouble and risk. Trend decrease illustrations Financial crisis alert decreasing bar chart with dollar coin and warning sign. Visual representation of a financial downturn. A bar chart shows a sharp decline, accompanied by a warning sign and a gold dollar coin, symbolizing economic trouble and risk.
Free with trial Three 3D red arrows point downward, each featuring a white percentage sign on the front. The arrows have a glossy, smooth texture and a bold, vibrant red color. They are evenly spaced against a plain white background, symbolizing discounts or reductions. The design conveys a clear message of sales and promotions. Trend decrease vectors Three red downward pointing arrows with percentage signs symbolizing discounts. Three 3D red arrows point downward, each featuring a white percentage sign on the front. The arrows have a glossy, smooth texture and a bold, vibrant red color. They are evenly spaced against a plain white background, symbolizing discounts or reductions. The design conveys a clear message of sales and promotions.
Free with trial A cartoon Bitcoin character is presenting a chart showing cryptocurrency market trends. The image is suitable for illustrating financial news, investment advice, or educational materials about Bitcoin and the crypto market. Trend decrease illustrations Bitcoin Cartoon Character Explaining Crypto Market Trends. A cartoon Bitcoin character is presenting a chart showing cryptocurrency market trends. The image is suitable for illustrating financial news, investment advice, or educational materials about Bitcoin and the crypto market.
Free with trial Doodle style bar chart with a downward trending arrow indicating financial loss. Trend decrease vectors Doodle style bar chart with a downward trending arrow indicating financial loss
Free with trial A man holds a sign displaying a sharply declining graph, symbolizing economic hardship. The image, generated by AI, is a powerful visual representation of market instability and financial distress. It's perfect for illustrating articles or presentations related to recession, financial crisis, or ma. Trend decrease illustrations Declining Graph: Economic Downturn. A man holds a sign displaying a sharply declining graph, symbolizing economic hardship. The image, generated by AI, is a powerful visual representation of market instability and financial distress. It's perfect for illustrating articles or presentations related to recession, financial crisis, or ma
Free with trial A colorful bar graph with a line graph overlayed on a blue background. it shows data trends and market analysis in a simple visual format. Trend decrease vectors Colorful bar graph with a line graph on a blue background. a colorful bar graph with a line graph overlayed on a blue background. it shows data trends and market analysis in a simple visual format
Free with trial A 3D rendering shows a financial graph with four white bars of decreasing height. A red arrow points downwards across the bars, indicating a decline. A stack of gold coins sits in front of the shortest bar on a black rectangular base. The background is white. Trend decrease illustrations White bars chart red arrow gold coins business finance. A 3D rendering shows a financial graph with four white bars of decreasing height. A red arrow points downwards across the bars, indicating a decline. A stack of gold coins sits in front of the shortest bar on a black rectangular base. The background is white
Free with trial Versus prior year on white paper background. Trend decrease illustrations Versus prior year on white paper
Free with trial Decreasing graph icon Business chart with downward arrow Financial loss symbol. Trend decrease vectors Decreasing graph icon Business chart with downward arrow Financial loss symbol
Free with trial This image depicts a house with a rising stock market graph overlay on a green lawn, symbolizing growth and prosperity in the real estate and financial markets. The graph shows a mix of green and red lines, indicating fluctuations in the market, but overall trending upwards. The image conveys a sense of optimism and hope for the future. Trend decrease illustrations A house with a rising stock market graph overlay on a green lawn. This image depicts a house with a rising stock market graph overlay on a green lawn. This image depicts a house with a rising stock market graph overlay on a green lawn, symbolizing growth and prosperity in the real estate and financial markets. The graph shows a mix of green and red lines, indicating fluctuations in the market, but overall trending upwards. The image conveys a sense of optimism and hope for the future.
Free with trial Two purple arrows, one pointing up and one down, each with a pink and white percentage sign, symbolize financial growth and decline. Trend decrease illustrations Purple up and down arrows with percentage signs representing financial change. Two purple arrows, one pointing up and one down, each with a pink and white percentage sign, symbolize financial growth and decline
Free with trial Conceptual image representing financial growth and investment. The scene features a golden percentage coin, stacks of coins, and a money bag against a backdrop of financial charts and graphs. The composition suggests themes of investment opportunities, interest rates, and economic prosperity. Suitable for illustrating financial articles, investment strategies, and economic forecasts. Trend decrease illustrations Financial Growth and Investment Concept. Conceptual image representing financial growth and investment. The scene features a golden percentage coin, stacks of coins, and a money bag against a backdrop of financial charts and graphs. The composition suggests themes of investment opportunities, interest rates, and economic prosperity. Suitable for illustrating financial articles, investment strategies, and economic forecasts.
Free with trial A simple black and white line art illustration of a house with a percentage sign next to it, representing mortgage rates and the cost of home ownership. Trend decrease vectors Illustration of a house with a percentage sign indicating mortgage interest rates. A simple black and white line art illustration of a house with a percentage sign next to it, representing mortgage rates and the cost of home ownership
Free with trial A businesswoman presents data graphs and charts on a whiteboard during a meeting in a modern office setting. The scene is minimalist and uses a dark blue color palette, emphasizing the data visualization. The image depicts a professional work environment. Trend decrease illustrations Businesswoman Giving Presentation. A businesswoman presents data graphs and charts on a whiteboard during a meeting in a modern office setting. The scene is minimalist and uses a dark blue color palette, emphasizing the data visualization. The image depicts a professional work environment.
Free with trial Black outline of descending bar chart with downward arrow, isolated on white background. concept of economic decline, data analysis, financial crisis, statistics. Trend decrease vectors Black outline of descending bar chart with downward arrow, isolated on white background. concept of economic decline, data
Free with trial Bar graph with declining values, percentage on black square, globe in blue square. Ideal for data, statistics, global business, market trends, finance, analysis research flat simple metaphor. Trend decrease vectors Bar chart with decreasing bars alongside percentage and globe icons for data and global analytics. Bar graph with declining values, percentage on black square, globe in blue square. Ideal for data, statistics, global business, market trends, finance, analysis research flat simple metaphor
Free with trial Top view of hands using laptop with symbol of economic crash concept. Trend decrease illustrations Concept of economic crash. Top view of hands using laptop with symbol of economic crash concept
Free with trial Hand-drawn financial charts, graphs, and calculators perfect for business, finance, and accounting illustrations. These vector illustrations depict various tools used for data analysis and financial calculations. Trend decrease vectors Collection of Hand Drawn Financial Charts and Calculators. Hand-drawn financial charts, graphs, and calculators perfect for business, finance, and accounting illustrations. These vector illustrations depict various tools used for data analysis and financial calculations.
Free with trial A neon glowing graph with blue bars and pink zigzag arrow showing fluctuating growth on black background. Generative AI. Trend decrease illustrations Neon glowing graph with blue bars and pink zigzag arrow showing fluctuating growth on black background
Free with trial Graphic element displays contrasting financial indicators featuring a jagged green arrow pointing up signifying growth alongside a similar red arrow pointing sharply down representing decline or market correction. Trend decrease vectors Graphic representation contrasting upward trending market growth with sharp downward trending financial decline. Graphic element displays contrasting financial indicators featuring a jagged green arrow pointing up signifying growth alongside a similar red arrow pointing sharply down representing decline or market correction
Free with trial A visual representation of financial losses or declining market trends, ideal for economic reports and business analysis presentations. Trend decrease illustrations Bar chart showing a significant decline, emphasized by a red arrow pointing downwards and a magnifying glass. A visual representation of financial losses or declining market trends, ideal for economic reports and business analysis presentations
Free with trial Black silhouette of descending bar chart with arrow, isolated on white background. concept of financial decline, statistics, economic downturn, data analysis, business graph. Trend decrease vectors Black silhouette of descending bar chart with arrow, isolated on white background. concept of financial decline, statistics
Free with trial Two three-dimensional arrows pointing downwards are presented against a white background. The arrow on the left is bright green, while the arrow on the right is a vibrant red. Both arrows have a highly polished, glossy surface, reflecting light. The arrows are positioned slightly overlapping, creating a sense of movement or comparison. The overall style is clean and simple, suitable for use as. Trend decrease illustrations 3 D Green and Red Down Arrows Shiny Glossy Icons 3d arrow. Two three-dimensional arrows pointing downwards are presented against a white background. The arrow on the left is bright green, while the arrow on the right is a vibrant red. Both arrows have a highly polished, glossy surface, reflecting light. The arrows are positioned slightly overlapping, creating a sense of movement or comparison. The overall style is clean and simple, suitable for use as
Free with trial Falling bar chart with up and right arrows illustrating declining business trends. Trend decrease vectors Falling bar chart with up and right arrows illustrating declining business trends
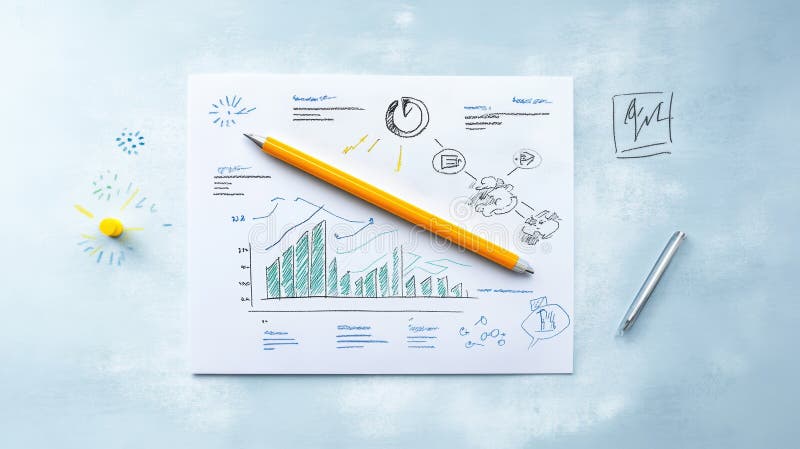
Free with trial Graph depiction on paper with a pencil ,Generative ai. Trend decrease illustrations Pencil and paper, a detailed illustration of graph for data analysis visualization. Graph depiction on paper with a pencil ,Generative ai