Free with trial Displaying green fluctuating data line moving across dashboard grid overlay, with red area graph. Financial, analytics, dashboard, data, technology, investment, digital. Trend decrease illustrations Displaying green fluctuating data line moving across dashboard grid overlay, with red area graph
Free with trial A vibrant red arrow points downwards, symbolizing a significant drop in stock prices, economic recession, or negative financial trends. This image captures the essence of decline and loss. Trend decrease illustrations Red downward arrow signifying financial decline and economic downturn symbol white background. A vibrant red arrow points downwards, symbolizing a significant drop in stock prices, economic recession, or negative financial trends. This image captures the essence of decline and loss
Free with trial Stacks of coins diminish with a red arrow pointing down, overlaid with a world map and financial chart, illustrating economic decline and global market downturn. Trend decrease illustrations Declining Economy: Stacks of Coins with Red Arrow and World Map Overlay. Stacks of coins diminish with a red arrow pointing down, overlaid with a world map and financial chart, illustrating economic decline and global market downturn
Free with trial A light teal-colored baby carriages aligned in falling chart with red arrow pointing down. Trend decrease illustrations A light teal-colored baby carriages aligned in falling chart with red arrow pointing down
Free with trial A cartoon illustration of a man interacting with a bar chart. The man is depicted in a simple, clean style, wearing a blue shirt and brown pants. He is holding a green bar, seemingly adjusting or interacting with the colorful bars displayed on a table. The illustration is suitable for conveying concepts related to data analysis, business, finance, and presentation. Trend decrease illustrations Cartoon Man and Bar Chart. A cartoon illustration of a man interacting with a bar chart. The man is depicted in a simple, clean style, wearing a blue shirt and brown pants. He is holding a green bar, seemingly adjusting or interacting with the colorful bars displayed on a table. The illustration is suitable for conveying concepts related to data analysis, business, finance, and presentation.
Free with trial Business decline and economic recession concept with a falling bar graph and a downward red arrow. Trend decrease vectors Business decline and economic recession concept with a falling bar graph and a downward red arrow
Free with trial Computer screen displaying detailed candlestick charts used for stock market analysis and investment decisions Perfect for illustrating finance and technology concepts. Trend decrease illustrations Analyzing Stock Market Data on Computer Screen with Candlestick Chart. Computer screen displaying detailed candlestick charts used for stock market analysis and investment decisions Perfect for illustrating finance and technology concepts
Free with trial A hand is shown holding a falling graph, symbolizing economic decline. The image is isolated on a white providing a clean, minimalist aesthetic. It is suitable for illustrating financial loss. Trend decrease illustrations Hand holding falling graph isolated on white background. for business and finance use cases. A hand is shown holding a falling graph, symbolizing economic decline. The image is isolated on a white providing a clean, minimalist aesthetic. It is suitable for illustrating financial loss
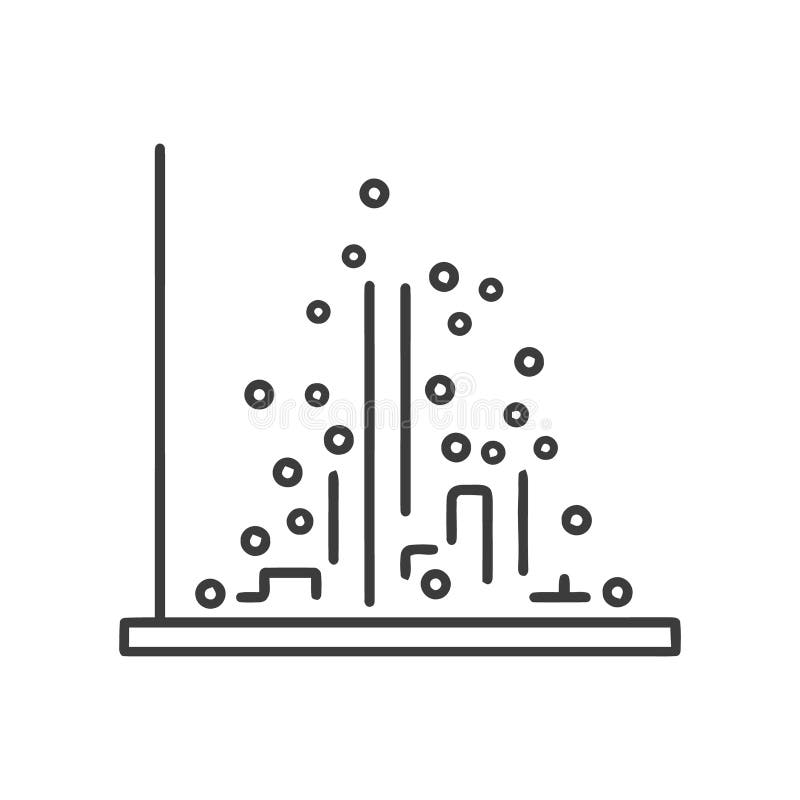
Free with trial Description: Simple line art illustration of a scatter plot graph showing an uneven distribution of data points. Perfect for presentations or reports. Trend decrease vectors Abstract Data Visualization: Scatter Plot Chart with Irregular Data Points. Description: Simple line art illustration of a scatter plot graph showing an uneven distribution of data points. Perfect for presentations or reports.
Free with trial Abstract downward pointing arrow graphic with three layered chevrons in warm gradient colors. Trend decrease vectors Abstract downward pointing arrow graphic with three layered chevrons in warm gradient colors
Free with trial Two percentage symbols with one green upward arrow and one red downward arrow isolated on transparent background. Trend decrease illustrations Percentage symbol with upward and downward arrows indicating growth and decline. Two percentage symbols with one green upward arrow and one red downward arrow isolated on transparent background
Free with trial Photo of handwritten charts illustrating inflation and potential recession. Graphs show rising prices and economic downturn concerns. Financial crisis concept depicted with, business. Trend decrease illustrations Photo of handwritten charts illustrating inflation and potential recession. Graphs show rising prices and economic downturn
Free with trial Business decline icon vector with downward arrow. Loss, failure, or economic crisis symbol with long shadow. Trend decrease vectors Business decline icon with downward arrow. Loss, failure, or economic crisis symbol with long shadow
Free with trial Unemployment rate gauge shows the current economic climate with a red needle pointing towards a high rate indicating potential financial instability market downturn and job insecurity reflecting conc. Trend decrease illustrations Unemployment rate gauge showing economic conditions with a red indicator needle pointing up. Unemployment rate gauge shows the current economic climate with a red needle pointing towards a high rate indicating potential financial instability market downturn and job insecurity reflecting conc
Free with trial Red bar graph with decreasing values. Generative AI. Trend decrease illustrations Red bar graph with decreasing values
Free with trial Arrows percent icons with up and down signs and percentage symbols featuring arrow,. Icon, symbol with up and graphics elements for illustrations. Trend decrease vectors Arrows percent icons with up and down signs and percentage symbols featuring arrow,. Icon, symbol with up and graphics elements for illustrations
Free with trial A burlap sack filled with coins next to stacks of coins with a downward trending red line, symbolizing financial decline or economic downturn. Trend decrease illustrations Financial downturn concept. A burlap sack filled with coins next to stacks of coins with a downward trending red line, symbolizing financial decline or economic downturn
Free with trial This image features a collection of nine icons representing various business and finance concepts. The icons include arrows indicating growth and decline, a checkmark symbolizing success, a balance scale for equality, and various bar graphs depicting data trends. Trend decrease illustrations Business and finance icons. This image features a collection of nine icons representing various business and finance concepts. The icons include arrows indicating growth and decline, a checkmark symbolizing success, a balance scale for equality, and various bar graphs depicting data trends
Free with trial Black filled database icon with minus symbol representing subtraction, reduction, or removal. Trend decrease vectors Database Remove Minus Icon. Black filled database icon with minus symbol representing subtraction, reduction, or removal.
Free with trial Colorful blocks in decreasing order on a blue surface. Represents decline or recession in a vibrant, illustrative manner. Stock photo. Trend decrease illustrations Colorful blocks in decreasing order on a blue surface. Represents decline or recession in a vibrant, illustrative manner
Free with trial A person's hands gently cradle a vibrant, dynamic data visualization generated by AI. The image showcases interconnected nodes and lines, forming a complex yet aesthetically pleasing network. This represents the power of AI in data analysis and presentation. Trend decrease illustrations AI-Generated Data Visualization. A person's hands gently cradle a vibrant, dynamic data visualization generated by AI. The image showcases interconnected nodes and lines, forming a complex yet aesthetically pleasing network. This represents the power of AI in data analysis and presentation.
Free with trial Stylized digital illustration showing a virtual coin with a declining market chart in the background. this image symbolizes financial risks, price fluctuations, and market volatility in the electronic currency sector. Trend decrease vectors Digital illustration of a virtual currency coin with a falling market graph representing financial price volatility. stylized digital illustration showing a virtual coin with a declining market chart in the background. this image symbolizes financial risks, price fluctuations, and market volatility in the electronic currency sector
Free with trial Stacks of coins on laptop with stock market graph. Trend decrease illustrations Stacks of coins on laptop with stock market graph
Free with trial Up and down graph icon on black circle. Outline bar chart with uptrend and downtrend arrow symbol vector. Trend decrease vectors Up and down graph icon on black circle. Outline bar chart with uptrend and downtrend arrow symbol
Free with trial Ai-Generated. a collection of twentyone minimalistic graph chart icons these icons illustrate different types of data trends suitable for representing business information, statistical analysis, and financial reports each icon features a unique line graph, bar chart, or diagram style. Trend decrease vectors Collection of minimalistic graph chart icons presenting different types of business data trends. Ai-Generated. a collection of twentyone minimalistic graph chart icons these icons illustrate different types of data trends suitable for representing business information, statistical analysis, and financial reports each icon features a unique line graph, bar chart, or diagram style
Free with trial This vibrant 3D rendering showcases a bar chart and pie chart, illustrating data growth and proportions. Ideal for presentations, reports, or educational materials. The colorful design makes it visually appealing and easy to understand. Trend decrease illustrations Colorful 3D Bar Chart and Pie Chart Data Presentation. This vibrant 3D rendering showcases a bar chart and pie chart, illustrating data growth and proportions. Ideal for presentations, reports, or educational materials. The colorful design makes it visually appealing and easy to understand.
Free with trial A bold red arrow curves downwards, indicating a negative trend or a directional choice. This simple yet impactful graphic is isolated for clarity. Trend decrease illustrations Red arrow pointing down on. A bold red arrow curves downwards, indicating a negative trend or a directional choice. This simple yet impactful graphic is isolated for clarity
Free with trial 3D icon representing business decline, downturn, and financial loss. Trend decrease illustrations 3D business growth down concept icon. 3D icon representing business decline, downturn, and financial loss
Free with trial Declining birth rates. An empty maternity ward, symbolizing declining birth rates. Trend decrease illustrations Declining birth rates. An empty maternity ward, symbolizing declining birth rates
Free with trial A digital line graph displays a sharp decline in interest rates, highlighting sudden market shifts and economic downturn trends. Trend decrease illustrations A digital line graph displays a sharp decline in interest rates, highlighting sudden market shifts and economic downturn trends
Free with trial Data visualization with red and green chart on a wall display ,Generative ai. Trend decrease illustrations Dynamic data visualization, red and green chart analysis on wall display. Data visualization with red and green chart on a wall display ,Generative ai
Free with trial This image displays a financial growth chart, featuring both a candlestick chart and a bar graph, laid out on a wooden surface. The candlestick chart illustrates stock market fluctuations with red and green candles, while the bar graph shows increasing values over time. The overall composition suggests positive financial trends, investment performance, and economic progress. It's ideal for representing concepts like business growth, market analysis, financial planning, and investment strategies. Trend decrease illustrations Financial Growth Chart with Candlestick and Bar Graph. This image displays a financial growth chart, featuring both a candlestick chart and a bar graph, laid out on a wooden surface. The candlestick chart illustrates stock market fluctuations with red and green candles, while the bar graph shows increasing values over time. The overall composition suggests positive financial trends, investment performance, and economic progress. It's ideal for representing concepts like business growth, market analysis, financial planning, and investment strategies.
Free with trial A dynamic display of market trends with charts and graphs in a cool blue color scheme. Trend decrease illustrations Financial market analysis with data charts and line graphs in blue tone. a dynamic display of market trends with charts and graphs in a cool blue color scheme
Free with trial Abstract 3D render of a descending bar chart made of blue glass rectangles. The bars are reflected on a glossy surface, creating a clean and modern aesthetic. The image can be used to represent data visualization, financial trends, business performance, or concepts like decline, recession, or negative growth. The cool blue color palette adds a sense of calm and professionalism. Trend decrease illustrations Abstract Blue Glass Bar Chart. Abstract 3D render of a descending bar chart made of blue glass rectangles. The bars are reflected on a glossy surface, creating a clean and modern aesthetic. The image can be used to represent data visualization, financial trends, business performance, or concepts like decline, recession, or negative growth. The cool blue color palette adds a sense of calm and professionalism.
Free with trial Two gold coins, one with green upward arrow symbol for growth, other with red downward arrow symbol for decline, white background. Trend decrease vectors Two gold coins, one with green up arrow, other with red down arrow. Two gold coins, one with green upward arrow symbol for growth, other with red downward arrow symbol for decline, white background
Free with trial This image showcases a dynamic graph, generated by AI, illustrating fluctuating data patterns. The abstract, wave-like design creates a visually engaging representation of complex information, perfect for presentations or reports needing a modern aesthetic. Its cool blue tones evoke a sense of calm. Trend decrease illustrations Abstract Data Visualization. This image showcases a dynamic graph, generated by AI, illustrating fluctuating data patterns. The abstract, wave-like design creates a visually engaging representation of complex information, perfect for presentations or reports needing a modern aesthetic. Its cool blue tones evoke a sense of calm
Free with trial An upward trending bar graph displayed on a laptop screen, illuminated against a backdrop of blurred city lights at night. Shows financial success and progress. Trend decrease illustrations Financial Growth Chart on Laptop Screen at Night. An upward trending bar graph displayed on a laptop screen, illuminated against a backdrop of blurred city lights at night. Shows financial success and progress.
Free with trial Analyze Data with Colorful Graph and Notes for Business Planning Strategy , layered depth. Trend decrease illustrations Analyze Data with Colorful Graph and Notes for Business Planning Strategy
Free with trial A bold red zigzag arrow points downwards, symbolizing a sharp decline or loss, isolated on a clean white background. Trend decrease illustrations Red downward zigzag arrow isolated on white background. A bold red zigzag arrow points downwards, symbolizing a sharp decline or loss, isolated on a clean white background
Free with trial Chart icon with descending bar graph, gear with cross, and downward arrow with dollar symbol, minimal black silhouette for finance loss and cost reduction concept. Trend decrease vectors Chart icon with descending bar graph, gear with cross, and downward arrow with dollar symbol
Free with trial Visual representation of financial downturn or economic recession. Stacks of gold coins show a downward trend, emphasized by a prominent red arrow pointing towards a decrease in value or quantity. Trend decrease illustrations Golden coins stacked in ascending order with red downward arrow indicating financial decline. Visual representation of financial downturn or economic recession. Stacks of gold coins show a downward trend, emphasized by a prominent red arrow pointing towards a decrease in value or quantity
Free with trial A blue pencil with a gold ferrule and eraser lies on a black surface, next to a white arrow drawn with white chalk or pa. Trend decrease illustrations Blue Pencil with White Arrow. A blue pencil with a gold ferrule and eraser lies on a black surface, next to a white arrow drawn with white chalk or pa.
Free with trial A powerful 3D render illustrating an impending financial crisis or economic downturn. A black bomb with a lit, sparking fuse stands ominously next to a golden dollar coin, which is accompanied by a prominent green arrow pointing downwards. This visual metaphor represents the urgent danger, risk, and volatility in financial markets, indicating a significant decline in currency value, inflation, or an economic collapse. Ideal for conveying concepts of recession, investment risk, and market instability. Trend decrease illustrations Financial Crisis Bomb: Dollar Decline and Economic Risk. A powerful 3D render illustrating an impending financial crisis or economic downturn. A black bomb with a lit, sparking fuse stands ominously next to a golden dollar coin, which is accompanied by a prominent green arrow pointing downwards. This visual metaphor represents the urgent danger, risk, and volatility in financial markets, indicating a significant decline in currency value, inflation, or an economic collapse. Ideal for conveying concepts of recession, investment risk, and market instability.
Free with trial Pastel-colored bar graph with downward trending arrow illustrates financial decline or loss This image is suitable for business presentations or economic reports. Trend decrease illustrations Declining Bar Graph with Arrow Showing Downtrend, Financial Loss Concept. Pastel-colored bar graph with downward trending arrow illustrates financial decline or loss This image is suitable for business presentations or economic reports
Free with trial A businessman in a suit is interacting with a digital interface, highlighting the balance between increasing quality and decreasing costs. The interface shows 'Quality' with an upward arrow and 'Cost' with a downward arrow, both marked with checkmarks, symbolizing successful optimization. This image represents business strategy, efficiency, and the importance of finding the right balance for success. Trend decrease illustrations Quality vs. Cost Optimization. A businessman in a suit is interacting with a digital interface, highlighting the balance between increasing quality and decreasing costs. The interface shows 'Quality' with an upward arrow and 'Cost' with a downward arrow, both marked with checkmarks, symbolizing successful optimization. This image represents business strategy, efficiency, and the importance of finding the right balance for success.
Free with trial A modern, clean isometric illustration showcasing various data visualizations. Multiple charts and graphs, including bar charts, line graphs, and pie charts, are displayed on floating screens, representing data analysis, business intelligence, or financial reporting. Ideal for presentations, reports, or website banners related to data-driven concepts. Trend decrease illustrations Isometric 3D Data Visualization: Charts and Graphs on Floating Screens. A modern, clean isometric illustration showcasing various data visualizations. Multiple charts and graphs, including bar charts, line graphs, and pie charts, are displayed on floating screens, representing data analysis, business intelligence, or financial reporting. Ideal for presentations, reports, or website banners related to data-driven concepts.
Free with trial A clean and modern vector illustration of a line graph, isolated on a white background. This flat design icon features two distinct lines, one blue and one brown, plotting various data points to show trends and comparisons over time. It's a versatile graphic representing concepts like data analysis, business analytics, financial statistics, market research, and performance tracking. Ideal for use in presentations, infographics, websites, business reports, and marketing materials to visualize progress, growth, or economic fluctuations. Trend decrease vectors Data Analysis Line Graph Icon. A clean and modern vector illustration of a line graph, isolated on a white background. This flat design icon features two distinct lines, one blue and one brown, plotting various data points to show trends and comparisons over time. It's a versatile graphic representing concepts like data analysis, business analytics, financial statistics, market research, and performance tracking. Ideal for use in presentations, infographics, websites, business reports, and marketing materials to visualize progress, growth, or economic fluctuations.
Free with trial Two glossy red arrows point upwards and downwards. This image represents concepts of change, direction, choice, and decision-making in various contexts. Useful for financial charts or conceptual graphics. Trend decrease illustrations Red up and down arrows symbolizing progress growth decline choice direction and decision making. Two glossy red arrows point upwards and downwards. This image represents concepts of change, direction, choice, and decision-making in various contexts. Useful for financial charts or conceptual graphics
Free with trial The image shows a bar graph placed on top of an open financial report book. The bar graph displays data with blue bars of varying heights, and two lines are plotted across the bars, one red and one blue. The graph appears to be indicating trends or comparisons over time. The financial report book underneath has detailed tables and charts, suggesting a thorough analysis of financial data. Trend decrease illustrations Bar graph on financial report. The image shows a bar graph placed on top of an open financial report book. The bar graph displays data with blue bars of varying heights, and two lines are plotted across the bars, one red and one blue. The graph appears to be indicating trends or comparisons over time. The financial report book underneath has detailed tables and charts, suggesting a thorough analysis of financial data
Free with trial Stacks of coins diminish, mirroring a falling stock market chart against a world map backdrop, symbolizing global economic decline and financial loss. Trend decrease illustrations Global Economic Downturn: Coin Stacks Decline with Bearish Stock Chart. Stacks of coins diminish, mirroring a falling stock market chart against a world map backdrop, symbolizing global economic decline and financial loss
Free with trial A visual representation of financial decline. Stacks of coins are overlaid with a red downtrend graph, suggesting economic downturn. The world map background adds a global context. The composition uses a shallow depth of field. Trend decrease illustrations Stacks of Coins with Downtrend Graph Overlay, Financial Crisis Concept. A visual representation of financial decline. Stacks of coins are overlaid with a red downtrend graph, suggesting economic downturn. The world map background adds a global context. The composition uses a shallow depth of field
Free with trial Graph with a green arrow pointing upwards. The graph is labeled with numbers and the numbers are increasing. Trend decrease illustrations Graph with a green arrow pointing upwards
Free with trial Bar graphs with various upward and downward trending arrows and a stylized dollar sign indicating financial growth and decline. Trend decrease vectors Bar graphs with various upward and downward trending arrows and a stylized dollar sign
Free with trial Hand drawing a decreasing bar graph with chalk on a dark chalkboard. Trend decrease illustrations Hand drawing declining bar chart on blackboard. Hand drawing a decreasing bar graph with chalk on a dark chalkboard
Free with trial Bold red zigzag arrow pointing downward with sharp angles. Trend decrease illustrations Red downward zigzag arrow icon. Bold red zigzag arrow pointing downward with sharp angles
Free with trial A 3D rendered icon of a bar chart with four ascending bars. The bars are a deep blue color and are heavily covered in realistic ice and snow, dripping from the tops. The chart is framed by metallic gray and dark gray. The icon is presented on a white background. Trend decrease illustrations 3D Bar Chart Icon With Blue Bars Covered in Ice and Snow. A 3D rendered icon of a bar chart with four ascending bars. The bars are a deep blue color and are heavily covered in realistic ice and snow, dripping from the tops. The chart is framed by metallic gray and dark gray. The icon is presented on a white background
Free with trial A vibrant red neon arrow sign glows brightly against a dark, textured background. The arrow points directly downwards, its illuminated outline sharp and clear. The background features subtle folds and reflections, adding depth and a sense of atmosphere. This image is perfect for concepts related to direction, decline, downward trends, navigation, or warnings. It can be used in designs for websites, presentations, or marketing materials that need a bold visual cue. Trend decrease illustrations Red Neon Arrow Pointing Down on Dark Textured Background. A vibrant red neon arrow sign glows brightly against a dark, textured background. The arrow points directly downwards, its illuminated outline sharp and clear. The background features subtle folds and reflections, adding depth and a sense of atmosphere. This image is perfect for concepts related to direction, decline, downward trends, navigation, or warnings. It can be used in designs for websites, presentations, or marketing materials that need a bold visual cue.
Free with trial Close up shot of a businessman analyzing cost reduction strategies using a laptop and pen highlighting a declining graph representing reduced expenses he is focused on achieving business success through financial analysis and efficiency improvements the image highlights the use of modern digital tools in cost management and financial planning. Trend decrease illustrations Analyzing Cost Reduction Strategies with Digital Tools and Data Analysis for Business Success. Close up shot of a businessman analyzing cost reduction strategies using a laptop and pen highlighting a declining graph representing reduced expenses he is focused on achieving business success through financial analysis and efficiency improvements the image highlights the use of modern digital tools in cost management and financial planning
Free with trial A shattered surface reflects falling financial graphs, while a distant cityscape blurred behind conveys uncertainty and instability in urban markets. Trend decrease illustrations Digital stock market decline over a cracked surface with a blurred city skyline in the background. A shattered surface reflects falling financial graphs, while a distant cityscape blurred behind conveys uncertainty and instability in urban markets
Free with trial An abstract image featuring four cylindrical shapes of varying heights, arranged in a descending order. The cylinders are dark, with the tops illuminated by a warm, golden light. The background gradients from a warm orange to a darker brown, creating a sense of depth and mystery. This image conveys concepts of decline, progress, or stages, and can be used to represent business trends, data visualization, or abstract concepts. Trend decrease illustrations Abstract Cylinders in Dim Light. An abstract image featuring four cylindrical shapes of varying heights, arranged in a descending order. The cylinders are dark, with the tops illuminated by a warm, golden light. The background gradients from a warm orange to a darker brown, creating a sense of depth and mystery. This image conveys concepts of decline, progress, or stages, and can be used to represent business trends, data visualization, or abstract concepts.
Free with trial The image shows two large, solid arrows pointing in opposite directions a pink arrow pointing upwards and a blue arrow pointing downwards. Trend decrease vectors Upward and downward arrows indicating opposite directions. The image shows two large, solid arrows pointing in opposite directions a pink arrow pointing upwards and a blue arrow pointing downwards
Free with trial Red downward arrow icon isolated on white background. Trend decrease illustrations The image features a red downward arrow icon with a zigzag pattern, set against a transparent background. This icon is commonly. Red downward arrow icon isolated on white background
Free with trial Abstract Business Growth Chart with Vintage Texture. Trend decrease illustrations Abstract Business Growth Chart with Vintage Texture
Free with trial A businessman in a suit is pointing at a digital screen displaying a graph. The graph illustrates the concept of quality improvement and cost reduction. An upward-pointing arrow signifies the increas. Trend decrease illustrations Businessman pointing at a graph showing quality improvement and cost reduction on a digital screen. A businessman in a suit is pointing at a digital screen displaying a graph. The graph illustrates the concept of quality improvement and cost reduction. An upward-pointing arrow signifies the increas
Free with trial A dark fuel container featuring a bold red arrow pointing downward, set against a soft-focused graph indicating financial decline and market instability. Trend decrease illustrations Black fuel barrel with red downward arrow symbolizing a significant drop in oil prices against a blurred financial chart. A dark fuel container featuring a bold red arrow pointing downward, set against a soft-focused graph indicating financial decline and market instability
Free with trial A 3D render of a vibrant red arrow pointing downwards, visually representing decline, loss, or a stock market crash. Trend decrease illustrations Red Arrow Down Stock Market Crash. A 3D render of a vibrant red arrow pointing downwards, visually representing decline, loss, or a stock market crash.
Free with trial Mobile phone screen displaying a cryptocurrency trading application for Bitcoin. The interface shows a financial candlestick chart with growth analysis, a Bitcoin coin icon, and a fingerprint scanner for secure transactions. Vector illustration isolated on white background. Trend decrease illustrations Smartphone with Bitcoin cryptocurrency trading app interface on screen showing financial chart and fingerprint security. Mobile phone screen displaying a cryptocurrency trading application for Bitcoin. The interface shows a financial candlestick chart with growth analysis, a Bitcoin coin icon, and a fingerprint scanner for secure transactions. Vector illustration isolated on white background
Free with trial A close-up, shallow depth of field shot of a digital stock market ticker board. The screen displays rows of stock symbols and their corresponding prices in bright red and green LED lights against a dark background. Some numbers are in green, indicating gains, while others are in red, signifying losses or negative trends. The bokeh effect from out-of-focus lights adds a dynamic and professional feel, perfect for illustrating financial concepts. Trend decrease illustrations Stock Market Ticker Display with Red and Green Numbers. A close-up, shallow depth of field shot of a digital stock market ticker board. The screen displays rows of stock symbols and their corresponding prices in bright red and green LED lights against a dark background. Some numbers are in green, indicating gains, while others are in red, signifying losses or negative trends. The bokeh effect from out-of-focus lights adds a dynamic and professional feel, perfect for illustrating financial concepts.
Free with trial A sharp red arrow zigzags downwards, indicating a significant decline or loss in financial markets or business performance. Isolated on a clean white background. Trend decrease illustrations Red downward trending arrow isolated on white background. A sharp red arrow zigzags downwards, indicating a significant decline or loss in financial markets or business performance. Isolated on a clean white background
Free with trial World map with a prominent red downward trend line indicating a global recession or financial market crash. Red arrows pointing downwards are superimposed over different continents, emphasizing a global economic downturn. The map is illuminated in shades of blue and purple against a dark background, enhancing the visual impact of the red elements. The composition suggests widespread economic decline across various regions. Trend decrease illustrations Global recession and financial market crash shown by a declining red graph and arrows over a world map. World map with a prominent red downward trend line indicating a global recession or financial market crash. Red arrows pointing downwards are superimposed over different continents, emphasizing a global economic downturn. The map is illuminated in shades of blue and purple against a dark background, enhancing the visual impact of the red elements. The composition suggests widespread economic decline across various regions.
Free with trial This 3D rendering illustrates economic crisis and financial loss with decreasing coin stacks displayed on a smartphone. The image visualizes recession, bankruptcy, and debt using a minimalist, modern design. Ideal for depicting investment risk, stock market downturns, or negative financial trends in business and digital media. Use this graphic to communicate complex economic concepts effectively. Trend decrease illustrations Economic crisis depicted with decreasing coin stacks on a phone 3d render. This 3D rendering illustrates economic crisis and financial loss with decreasing coin stacks displayed on a smartphone. The image visualizes recession, bankruptcy, and debt using a minimalist, modern design. Ideal for depicting investment risk, stock market downturns, or negative financial trends in business and digital media. Use this graphic to communicate complex economic concepts effectively
Free with trial A visual representation of a steep financial downturn with a red line graph descending sharply, magnified to show a 15% decrease, symbolizing economic decline and losses. Trend decrease illustrations Stock market crash downturn economic recession loss financial crisis downtrend chart magnifying glass zoom 15 percent. A visual representation of a steep financial downturn with a red line graph descending sharply, magnified to show a 15% decrease, symbolizing economic decline and losses
Free with trial A seamless pattern featuring various business and finance-related doodles, including graphs, charts, currencies, and other financial symbols. The doodles are drawn in a simple line style on a white background. This image can be used as a background or texture for presentations, reports, or websites related to business, finance, and economics. Trend decrease vectors Business finance doodle pattern. A seamless pattern featuring various business and finance-related doodles, including graphs, charts, currencies, and other financial symbols. The doodles are drawn in a simple line style on a white background. This image can be used as a background or texture for presentations, reports, or websites related to business, finance, and economics.
Free with trial An open human hand is positioned against a dark background, palm up. Above it, a glowing symbol features the word "COST" in bright white letters, accompanied by a downward-pointing arrow. This visual element is surrounded by small blue lights, suggesting technological or digital themes. The hand appears to be presenting or supporting the symbol, indicating a metaphorical grasp of the concept it represents. Trend decrease illustrations Human hand holding a glowing symbol of cost reduction with a downward arrow. An open human hand is positioned against a dark background, palm up. Above it, a glowing symbol features the word "COST" in bright white letters, accompanied by a downward-pointing arrow. This visual element is surrounded by small blue lights, suggesting technological or digital themes. The hand appears to be presenting or supporting the symbol, indicating a metaphorical grasp of the concept it represents.
Free with trial Red Graph Line Under Magnifying Glass on White Paper. Trend decrease illustrations Red Graph Line Under Magnifying Glass on White Paper
Free with trial A visual representation of real estate market trends, showing arrows indicating price increases and decreases over a suburban home. Trend decrease illustrations Real Estate Market Fluctuations Depicted with Arrows Over a Suburban House. A visual representation of real estate market trends, showing arrows indicating price increases and decreases over a suburban home
Free with trial Colorful bar chart on a red background displaying data ,Generative ai. Trend decrease illustrations Vibrant colorful bar chart on red background, data visualization and analysis colorful. Colorful bar chart on a red background displaying data ,Generative ai
Free with trial A downward trending candlestick chart with gray bars against a dark green background. Generative AI. Trend decrease illustrations A downward trending candlestick chart with gray bars against a dark green background
Free with trial A clean and modern abstract logo featuring three overlapping blue chevrons pointing downwards. The chevrons are layered with subtle shadows, creating a sense of depth and dimension. The design is minimalist and geometric, rendered on a white background. This versatile graphic is ideal for technology companies, financial services, data analysis, or any business emphasizing progress, direction, or efficiency. Trend decrease illustrations Abstract Blue Chevron Layers Logo. A clean and modern abstract logo featuring three overlapping blue chevrons pointing downwards. The chevrons are layered with subtle shadows, creating a sense of depth and dimension. The design is minimalist and geometric, rendered on a white background. This versatile graphic is ideal for technology companies, financial services, data analysis, or any business emphasizing progress, direction, or efficiency.