Free with trial Growth and decline. Business chart icon. Profit loss symbol. Vector illustration. EPS 10. Trend decrease vectors Growth and decline. Business chart icon. Profit loss symbol. Vector illustration.
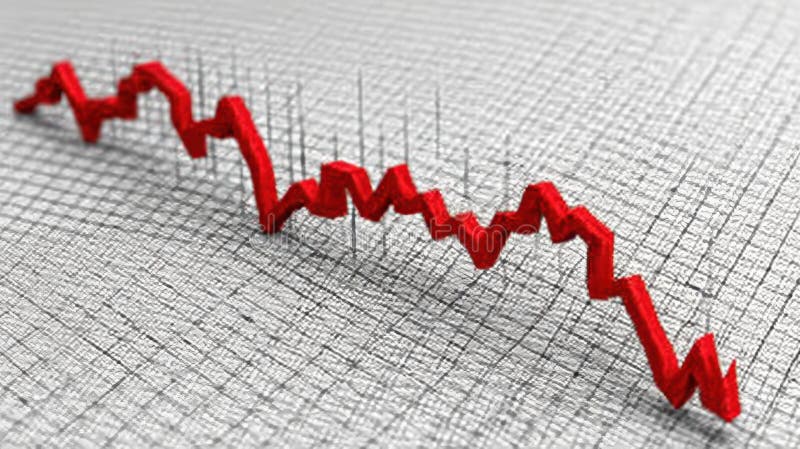
Free with trial Blue zigzag arrow pointing downward, 3D Rendering style, on digital dark grid background. Concept of financial crisis, market crash, and recession. Trend decrease illustrations Blue downward arrow symbolizing economic decline on virtual grid background, representing financial crisis, market crash, and. Blue zigzag arrow pointing downward, 3D Rendering style, on digital dark grid background. Concept of financial crisis, market crash, and recession
Free with trial A businessman's hand points down an arrow on a black background. Business success concept. Generative AI Image. Trend decrease illustrations Businessman hand pointing down arrow on black background. Business success concept. A businessman's hand points down an arrow on a black background. Business success concept. Generative AI Image
Free with trial A striking red downward arrow is positioned against a uniform red background, creating a clean, minimalist look. The simplicity of the design emphasizes the downward movement symbolized by the arrow. Trend decrease illustrations A clear red downward arrow on a solid red background in a minimalist design setting. A striking red downward arrow is positioned against a uniform red background, creating a clean, minimalist look. The simplicity of the design emphasizes the downward movement symbolized by the arrow.
Free with trial Financial downturn concept. A business professional climbs tall blue bars, carrying a briefcase and analyze declining bar graph and chart using magnifying glass. Trend decrease vectors Financial downturn concept, businessman analyze declining bar graph and chart. Financial downturn concept. A business professional climbs tall blue bars, carrying a briefcase and analyze declining bar graph and chart using magnifying glass
Free with trial A simple line drawing of a decreasing chart with an arrow pointing downwards, depicting negative growth or decline. Useful for presentations, infographics, and reports. Trend decrease vectors Minimalist Line Style Decreasing Chart Arrow Down Financial Graphic Element. A simple line drawing of a decreasing chart with an arrow pointing downwards, depicting negative growth or decline. Useful for presentations, infographics, and reports.
Free with trial Vector icons showing business growth and decline trends with arrows and magnifying glass for detailed analysis, representing financial and market data in a clear style. Professional and informative. Generative AI. Trend decrease vectors Business growth and decline infographic icons with arrows and magnifying glass for analysis. Vector icons showing business growth and decline trends with arrows. Vector icons showing business growth and decline trends with arrows and magnifying glass for detailed analysis, representing financial and market data in a clear style. Professional and informative. Generative AI
Free with trial Declining dollar value graph. Vector economic icons. Financial downturn concept. EPS 10. Trend decrease vectors Declining dollar value graph. Vector economic icons. Financial downturn concept.
Free with trial Prohibition sign with declining bar chart and people icons. No decline concept. EPS 10. Trend decrease vectors Prohibition sign with declining bar chart and people icons. No decline concept.
Free with trial High Dollar Symbol Black, Dollar price high, Price increase icon, rising commodity prices, interest rate increase, high inflation, financial growth web design. Trend decrease vectors High Dollar Symbol Black, Dollar price high, Price increase icon, rising commodity prices, interest rate increase, high inflation
Free with trial Bankruptcy concept in flat design business. design vector illustration. Trend decrease vectors Flat vector design bankruptcy concept. bankruptcy concept in flat design business.design vector illustration
Free with trial Uptrend and downtrend arrow line icon in generic style. Rising and falling arrows illustration concept. Trend decrease vectors Uptrend and downtrend arrow line icon in generic style. Rising and falling arrows concept
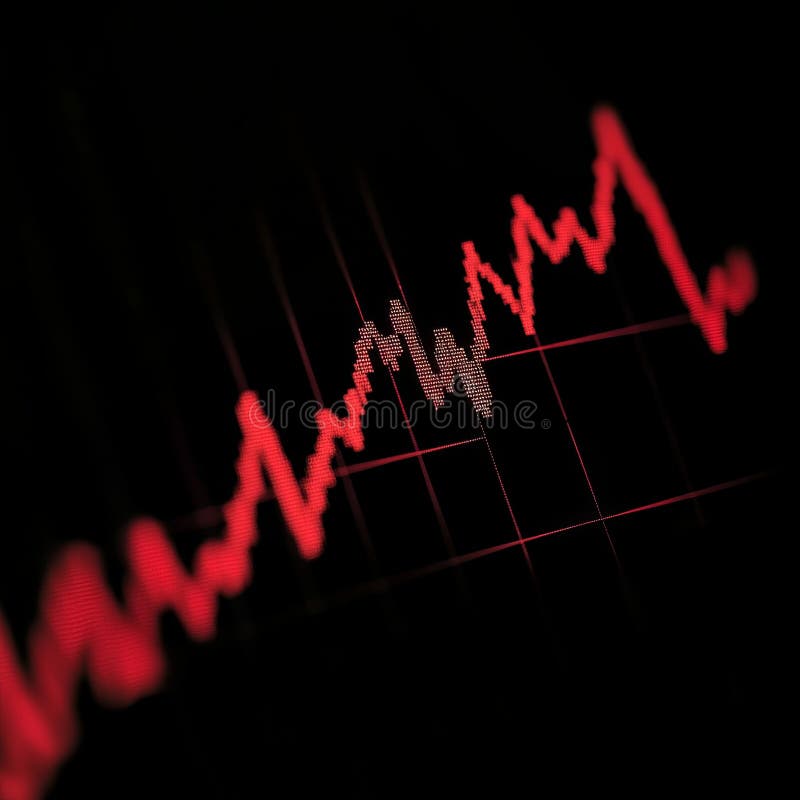
Free with trial Glowing red financial chart with percentage symbols, stock market decline concept. Trend decrease illustrations Glowing red financial chart with percentage symbols, stock market decline concept
Free with trial Decreasing Bar Chart with Downward Arrow Representing Declining Market Sales. Trend decrease vectors Decreasing Bar Chart with Downward Arrow Representing Declining Market Sales
Free with trial Colorful isometric bar chart showing business data and growth with bars of different height, colored blue, yellow and green. Isolated on a transparent background, perfect for business presentations or infographics. Trend decrease vectors Colorful business chart illustration on transparent background AI Generated. Colorful isometric bar chart showing business data and growth with bars of different height, colored blue, yellow and green. Isolated on a transparent background, perfect for business presentations or infographics.
Free with trial Conceptual illustration combining a baby stroller with declining graphs to represent lowering birth rates and family planning changes. Highlights trends in societal demographics and population changes. Trend decrease illustrations Illustration of declining birth rates represented with a baby stroller and graphs. Conceptual illustration combining a baby stroller with declining graphs to represent lowering birth rates and family planning changes. Highlights trends in societal demographics and population changes
Free with trial A 3D rendered gold coin with a thick gold rim and a black circular face. On the black face, a gold bar chart is depicted, showing a downward trend with bars decreasing in height and an arrow pointing downwards. The coin is presented at an angle against a white background, symbolizing financial decline or economic loss. Trend decrease illustrations Gold coin with black background and gold bar chart showing decline money finance. A 3D rendered gold coin with a thick gold rim and a black circular face. On the black face, a gold bar chart is depicted, showing a downward trend with bars decreasing in height and an arrow pointing downwards. The coin is presented at an angle against a white background, symbolizing financial decline or economic loss
Free with trial Uptrend and downtrend business chart icon. Economic growth and decline symbol with green up and red down arrow vector. Trend decrease vectors Uptrend and downtrend business chart icon. Economic growth and decline symbol with green up and red down arrow
Free with trial Stock market chart displaying investment trends with red and blue candlesticks on a dark background. The chart features a timeline labeled by months at the top and numbers at the bottom, illustrating dynamic financial data. Candlesticks show market fluctuations, with red indicating a decrease and blue an increase in value. A faint blue line overlays the candles, representing the moving average. The scene is likely within a financial or trading setting, emphasizing the analysis of market activity. Trend decrease illustrations Dynamic stock market chart with vibrant red and blue candles showing investment trends and financial data. Stock market chart displaying investment trends with red and blue candlesticks on a dark background. The chart features a timeline labeled by months at the top and numbers at the bottom, illustrating dynamic financial data. Candlesticks show market fluctuations, with red indicating a decrease and blue an increase in value. A faint blue line overlays the candles, representing the moving average. The scene is likely within a financial or trading setting, emphasizing the analysis of market activity.
Free with trial Tablet displays a declining graph, reflecting downturns. A dark world map serves as the backdrop, emphasizing global impact. This visualization symbolizes economic changes. The image is. Trend decrease illustrations Global Decline Displayed on Tablet with World Map Background in Dim Lighting. Tablet displays a declining graph, reflecting downturns. A dark world map serves as the backdrop, emphasizing global impact. This visualization symbolizes economic changes. The image is
Free with trial Candlestick chart with buy and sell signals over digital world map and city skyline on dark background, symbolizing global market and forex trading. Trend decrease illustrations Global financial chart with buy and sell indicators over world map and cityscape background, illustrating stock market and forex. Candlestick chart with buy and sell signals over digital world map and city skyline on dark background, symbolizing global market and forex trading
Free with trial Hand drawn bar chart illustration showing data statistics and business growth. Trend decrease vectors Hand drawn bar chart illustration showing data statistics and business growth
Free with trial A hand-drawn sketch of a business chart illustrating a significant decline, with a small, subtle sign of potential recovery at the far right. The chart is simply illustrated in black ink on a white background. Trend decrease illustrations Hand-drawn business chart showing decline followed by a very slight recovery. A hand-drawn sketch of a business chart illustrating a significant decline, with a small, subtle sign of potential recovery at the far right. The chart is simply illustrated in black ink on a white background
Free with trial A pair of hands holds a sheet of paper displaying a red line graph on a grid pattern the graph illustrates a downward trend, indicating a decline in business, finance or economy the image represents loss, failure, or a recession, generated by AI. Trend decrease illustrations Hands holding paper showing a declining red business graph data. a pair of hands holds a sheet of paper displaying a red line graph on a grid pattern the graph illustrates a downward trend, indicating a decline in business, finance or economy the image represents loss, failure, or a recession, generated by AI.
Free with trial Stock market crash downward arrow red chart blurred uncertainty, visual representation of financial instability and risk. Trend decrease illustrations Stock market crash downward arrow red chart blurred uncertainty
Free with trial Stock market crash downward arrow red chart blurred uncertainty, visual representation of financial instability and risk. Trend decrease illustrations Stock market crash downward arrow red chart blurred uncertainty
Free with trial Steeply falling graph arrow pointing down dark background sharp decline ruin Ideal for websites and social media. Trend decrease illustrations Steeply falling graph, arrow pointing down, dark background, sharp decline, ruin. Steeply falling graph arrow pointing down dark background sharp decline ruin Ideal for websites and social media
Free with trial An abstract digital rendering of a financial market chart with a prominent red line indicating fluctuations in a stock market or trading scenario, set against a background of data streams and numerical information. It can be used for visualizing economic trends or for representing financial analytics. Trend decrease illustrations Abstract financial chart depicting market trends and data analysis interface. An abstract digital rendering of a financial market chart with a prominent red line indicating fluctuations in a stock market or trading scenario, set against a background of data streams and numerical information. It can be used for visualizing economic trends or for representing financial analytics
Free with trial A 3D rendering features a bar graph with three vertical bars in blue and yellow. Above the graph, a molecular structure is depicted with a central yellow sphere connected to three blue spheres by white rods. The entire graphic is isolated on a clean white background. Trend decrease illustrations 3D bar graph with molecular structure above on a white background chart data. A 3D rendering features a bar graph with three vertical bars in blue and yellow. Above the graph, a molecular structure is depicted with a central yellow sphere connected to three blue spheres by white rods. The entire graphic is isolated on a clean white background
Free with trial Modern digital illustration showing a glowing neon 'Margin Call' alert over financial charts and data analytics interface, symbolizing trading loss and market downturn. Trend decrease illustrations Margin Call Concept with Stock Market Chart and Financial Data Visualization. Modern digital illustration showing a glowing neon 'Margin Call' alert over financial charts and data analytics interface, symbolizing trading loss and market downturn.
Free with trial Revenue Decline line icon. Universal creative premium symbol. Vector sign icon logo template. Vector illustration. Trend decrease vectors Revenue Decline line icon. Universal creative premium symbol. Vector sign icon logo template. Vector illustration
Free with trial Business performance decline icon in black circle. Productivity drop and process efficiency loss symbol vector. Trend decrease vectors Business performance decline icon in black circle. Productivity drop and process efficiency loss symbol
Free with trial Market Financial chart falling trend. Trend decrease illustrations Market downturn reflected on monitor screen, steaming mug, notepad and pen on desk. Market Financial chart falling trend
Free with trial A graph vividly illustrates two contrasting trends, one declining and the other rising, captured with sharp focus and rich orange tones creating a dynamic visual. Trend decrease illustrations Dynamic Trends Represented Through Contrasting Lines in a Vibrant Orange Graph. A graph vividly illustrates two contrasting trends, one declining and the other rising, captured with sharp focus and rich orange tones creating a dynamic visual
Free with trial Power lines and electricity pylons reflected on wet ground at sunset with a superimposed stock market graph showing decreasing energy prices. Trend decrease illustrations Electricity market graph showing decreasing energy prices at sunset. Power lines and electricity pylons reflected on wet ground at sunset with a superimposed stock market graph showing decreasing energy prices
Free with trial Calculator with purple screen, upward-trending performance graph, and downward arrow. Ideal for finance, accounting, budgeting, data analysis, cost reduction, investment strategy simple flat. Trend decrease vectors Financial calculation with a calculator, performance graph, and downward arrow for data analysis. Calculator with purple screen, upward-trending performance graph, and downward arrow. Ideal for finance, accounting, budgeting, data analysis, cost reduction, investment strategy simple flat
Free with trial Analyzing Dynamic Stock Market Trends with Red Graph Lines on Black Background. Generative AI. Trend decrease illustrations Analyzing Dynamic Stock Market Trends with Red Graph Lines on Black Background
Free with trial Power lines and electricity pylons reflected on wet ground at sunset with a superimposed stock market graph showing decreasing energy prices. Trend decrease illustrations Electricity market graph showing decreasing energy prices at sunset. Power lines and electricity pylons reflected on wet ground at sunset with a superimposed stock market graph showing decreasing energy prices
Free with trial AI generated illustration of coins stacked near an upward-downward graph arrow line. Trend decrease illustrations AI generated illustration of coins stacked near an upward-downward graph arrow line
Free with trial Tools to maximize and minimize, resize and expand, control size and direction thin black outline symbols vector illustration. Arrows for presentation of growth and scaling line icons set. Trend decrease vectors Arrows for presentation of growth and scaling line icons set, tools to control size. Tools to maximize and minimize, resize and expand, control size and direction thin black outline symbols vector illustration. Arrows for presentation of growth and scaling line icons set.
Free with trial A person is holding a cell phone that is displaying a graph. The graph shows a downward trend, which could indicate a decrease in value or a negative outcome. Trend decrease illustrations A person is holding a cell phone that is displaying a graph
Free with trial Modern abstract blue bars illustrating business statistics, trends, and analytics. Trend decrease vectors Digital data analysis bars in blue hues, conceptualizing statistics and trends. Modern abstract blue bars illustrating business statistics, trends, and analytics.
Free with trial A 3D rendered image of a red neon arrow pointing downwards. The arrow is glossy and has a modern design. Trend decrease illustrations 3D Render of a Glossy Red Neon Arrow Pointing Downward, Abstract Design Concept. A 3D rendered image of a red neon arrow pointing downwards. The arrow is glossy and has a modern design
Free with trial This 3D rendering shows a dramatic market downturn, with collapsing bars representing a significant economic decline. The falling graph, generated by AI, visually emphasizes the severity of the drop. The scattered cubes further illustrate instability and potential loss. Trend decrease illustrations AI-Generated Market Crash Visualization. This 3D rendering shows a dramatic market downturn, with collapsing bars representing a significant economic decline. The falling graph, generated by AI, visually emphasizes the severity of the drop. The scattered cubes further illustrate instability and potential loss.
Free with trial A minimalist workspace features a large monitor displaying a dramatic red stock market crash graph, generated by AI. The image emphasizes the visual impact of a market downturn, showcasing the graph against a clean, modern backdrop. The scene is serene yet carries a powerful message about economic. Trend decrease illustrations AI-Generated Market Crash Visualization. A minimalist workspace features a large monitor displaying a dramatic red stock market crash graph, generated by AI. The image emphasizes the visual impact of a market downturn, showcasing the graph against a clean, modern backdrop. The scene is serene yet carries a powerful message about economic
Free with trial Falling red forex candlestick chart on black background. Global economic recession, stock market crash, inflation concept. 3D Rendering. Trend decrease illustrations Falling red forex candlestick chart on black background. Global economic recession, stock market crash, inflation concept. 3D
Free with trial A computer screen displays a sharply declining red graph, indicative of a market crash. This 3D-rendered image, generated by AI, illustrates the dramatic visual representation of financial downturn. The image serves as a powerful symbol of economic instability and risk. Trend decrease illustrations AI-Generated Market Crash Visualization. A computer screen displays a sharply declining red graph, indicative of a market crash. This 3D-rendered image, generated by AI, illustrates the dramatic visual representation of financial downturn. The image serves as a powerful symbol of economic instability and risk.
Free with trial This 3D graph, generated by AI, depicts a sharp market downturn. The red line dramatically falls, illustrating significant financial losses and economic instability. The textured background enhances the visual impact, conveying a sense of crisis. Trend decrease illustrations AI-Generated Market Crash Visualization. This 3D graph, generated by AI, depicts a sharp market downturn. The red line dramatically falls, illustrating significant financial losses and economic instability. The textured background enhances the visual impact, conveying a sense of crisis.
Free with trial A cracked wall reveals a falling stock market graph, generated by AI. This striking image symbolizes market instability and the fragility of financial systems. The red color emphasizes the severity of the downturn, while the broken wall portrays the devastating consequences. Trend decrease illustrations Market Crash: AI-Generated Visualization. A cracked wall reveals a falling stock market graph, generated by AI. This striking image symbolizes market instability and the fragility of financial systems. The red color emphasizes the severity of the downturn, while the broken wall portrays the devastating consequences.
Free with trial A 3d stylized financial chart displays a downward red arrow over blue and orange bars. Two gold coins with dollar signs flank the chart. Trend decrease illustrations 3d stylized financial chart with downward red arrow and gold coins illustration. A 3d stylized financial chart displays a downward red arrow over blue and orange bars. Two gold coins with dollar signs flank the chart
Free with trial Stock market chart with candlestick patterns in red and yellow, digital, on dark background, concept of financial analysis. 3D. Trend decrease illustrations Stock market chart with candlestick patterns in red and yellow, digital, on dark background, concept of financial analysis. 3D
Free with trial A striking red arrow plunges downwards, symbolizing a significant drop in data trends. This representation highlights a negative change in performance or market activity. Trend decrease illustrations A red downward arrow indicating a sharp decline in numbers during market analysis. A striking red arrow plunges downwards, symbolizing a significant drop in data trends. This representation highlights a negative change in performance or market activity.
Free with trial Steeply falling graph arrow pointing down dark background collapse devastation Perfect for blogs, articles, and online content. Trend decrease illustrations Steeply falling graph, arrow pointing down, dark background, collapse, devastation. Steeply falling graph arrow pointing down dark background collapse devastation Perfect for blogs, articles, and online content
Free with trial Up and Down sign with green and red arrows set vector illustration. Set of a Concept of sales bar chart symbol icon with arrow moving down and sales bar chart with arrow moving up. Trend decrease vectors Up and Down sign with green and red arrows set vector illustration. Set of a Concept of sales bar chart symbol icon with arrows. Up and Down sign with green and red arrows set vector illustration. Set of a Concept of sales bar chart symbol icon with arrow moving down and sales bar chart with arrow moving up.
Free with trial Close up of laptop keyboard with bank card and downward red crisis chart grid on blurry concrete wall background. Recession and economic fall concept. Double exposure. Trend decrease illustrations Close up of laptop keyboard with bank card and downward red crisis chart grid on blurry concrete wall background. Recession and
Free with trial Illustration of descending financial chart background for business presentations, Generated by AI. Trend decrease illustrations Illustration of descending financial chart background for business presentations
Free with trial A hand in a suit holds a glowing red bar graph with a downward arrow indicating a decline. The image is lit with red and blue light. Trend decrease illustrations Hand holding glowing red downward trending bar graph with arrow chart business. A hand in a suit holds a glowing red bar graph with a downward arrow indicating a decline. The image is lit with red and blue light
Free with trial A 3D rendering of a vibrant red arrow pointing upwards and a bright green arrow pointing downwards, representing market fluctuations, economic changes, and data trends. Trend decrease illustrations Red up arrow and green down arrow symbolizing financial market trends growth decline. A 3D rendering of a vibrant red arrow pointing upwards and a bright green arrow pointing downwards, representing market fluctuations, economic changes, and data trends
Free with trial Financial Decline Illustrated by Decreasing Coin Stacks and Downward Arrow Graph. Trend decrease vectors Financial Decline Illustrated by Decreasing Coin Stacks and Downward Arrow Graph
Free with trial Businessman pointing at a declining graph, warning of financial trouble. Doodle style with an editable stroke. Trend decrease vectors Businessman pointing at a declining graph, warning of financial trouble. Doodle style with an editable stroke
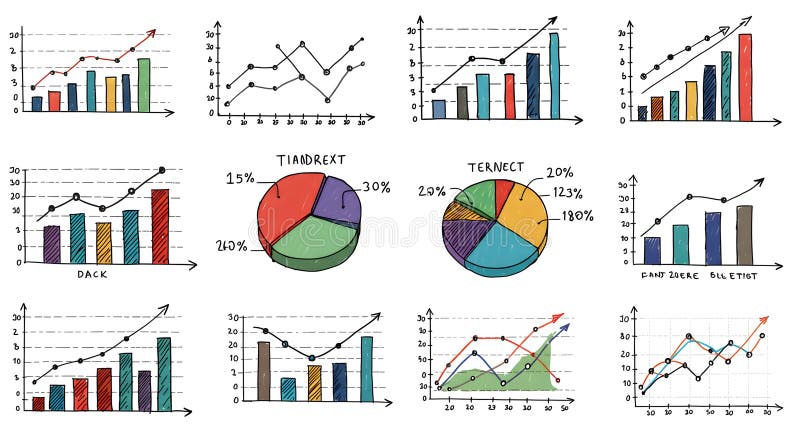
Free with trial A collection of hand-drawn style charts and diagrams that can be used to display data and analyze progress, ideal for business presentations, reports, or data visualizations. Trend decrease illustrations Hand-Drawn Collection of Statistical Charts and Diagrams for Business Analytics. A collection of hand-drawn style charts and diagrams that can be used to display data and analyze progress, ideal for business presentations, reports, or data visualizations
Free with trial Bankruptcy concept in flat design business. design vector illustration. Trend decrease vectors Bankruptcy concept in flat design business
Free with trial Abstract red and yellow candlestick chart on dark background with descending arrow, representing global financial crisis and market crash. 3D Rendering. Trend decrease illustrations Abstract background showing downward yellow arrow and red candlestick chart indicating global financial crisis and stock market. Abstract red and yellow candlestick chart on dark background with descending arrow, representing global financial crisis and market crash. 3D Rendering
Free with trial Digital globe with rising and falling stock market trends, represented by red and blue lines, symbolizing global financial fluctuations and economic uncertainty in a high-tech, futuristic style. Trend decrease illustrations Global Market Fluctuations: A Digital Earth with Rising and Falling Stock Trends. Digital globe with rising and falling stock market trends, represented by red and blue lines, symbolizing global financial fluctuations and economic uncertainty in a high-tech, futuristic style
Free with trial A red zigzag arrow pointing downwards within a white circular frame, presented isolated on a clean white background. Trend decrease illustrations Red downward trending zigzag arrow inside a white circle isolated on white background. A red zigzag arrow pointing downwards within a white circular frame, presented isolated on a clean white background
Free with trial Red market decline graph on desk, glasses, tablet showing losses, office background, detailed background Generative AI. Trend decrease illustrations Red market decline graph on desk, glasses, tablet showing losses, office background
Free with trial Futuristic cityscape rendered with a glowing red network of lines, representing interconnected data and technology, creating a dynamic and energetic scene. High quality photo. Trend decrease vectors Futuristic cityscape rendered with a glowing red network of lines, representing interconnected data and technology
Free with trial Falling profit icon. Decreasing money stack. Downward arrow symbol. Dollar sign focus. EPS 10. Trend decrease vectors Falling profit icon. Decreasing money stack. Downward arrow symbol. Dollar sign focus.
Free with trial This illustration depicts a piggy bank beside a bar chart showing a sharp decline symbolizing decreasing savings and potential economic hardship The design uses simple clean graphics to effectively communicate a message of financial downturn Ideal for articles about recession financial planning or investment risks. Trend decrease illustrations Declining Savings Piggy Bank and Bar Chart Showing Economic Downturn AI generated. This illustration depicts a piggy bank beside a bar chart showing a sharp decline symbolizing decreasing savings and potential economic hardship The design uses simple clean graphics to effectively communicate a message of financial downturn Ideal for articles about recession financial planning or investment risks
Free with trial 3D red zigzag arrow trending downward across white studio backdrop, casting subtle shadow. Graph, finance, analysis, growth, decline, investment, strategy. Trend decrease illustrations 3D red zigzag arrow trending downward across white studio backdrop, casting subtle shadow
Free with trial Downward arrow with decreasing bar graph alongside neutral, happy, and sad emotion faces. Ideal for emotional feedback, metrics, performance, business evaluation, impact loss failure. A simple flat. Trend decrease vectors Decline in Performance Represented by Downward Arrow, Graph Bars, and Varying Emotional Expressions. Downward arrow with decreasing bar graph alongside neutral, happy, and sad emotion faces. Ideal for emotional feedback, metrics, performance, business evaluation, impact loss failure. A simple flat
Free with trial Financial chart with red and yellow candlesticks and a downward yellow arrow, on a dark background, concept of market crash and recession. 3D Rendering. Trend decrease illustrations Abstract financial chart with red and yellow candlesticks showing a downward trend and falling market data on dark background. 3D. Financial chart with red and yellow candlesticks and a downward yellow arrow, on a dark background, concept of market crash and recession. 3D Rendering
Free with trial A minimalist bar chart is displayed on a white background. Three vertical bars of increasing height are depicted with thick black outlines. The interior of each bar features a subtle grey gradient fill, creating a sense of depth. Trend decrease illustrations Simple Black Outline Bar Chart with Gradient Fill on White Background graph bars. A minimalist bar chart is displayed on a white background. Three vertical bars of increasing height are depicted with thick black outlines. The interior of each bar features a subtle grey gradient fill, creating a sense of depth
Free with trial A single, glossy blue 3D arrow is depicted pointing directly downwards. The arrow has a smooth, polished surface that reflects light, giving it a shiny appearance. It is set against a neutral light gray background, making the blue arrow stand out clearly as a directional symbol. Trend decrease illustrations Glossy Blue 3D Arrow Pointing Downward on a Light Gray Background down arrow direction. A single, glossy blue 3D arrow is depicted pointing directly downwards. The arrow has a smooth, polished surface that reflects light, giving it a shiny appearance. It is set against a neutral light gray background, making the blue arrow stand out clearly as a directional symbol
Free with trial A shiny, red, jagged arrow pointing downwards, symbolizing a decline or loss, isolated on a clean white background. Trend decrease illustrations Red jagged downward arrow isolated on white background. A shiny, red, jagged arrow pointing downwards, symbolizing a decline or loss, isolated on a clean white background
Free with trial A graphic display of multiple red arrows pointing downwards, each featuring a percentage symbol. This visual metaphor suggests declining financial markets, price reductions, or negative trends. Trend decrease illustrations Red arrows with percentage symbols indicate market downturn or decreasing prices. A graphic display of multiple red arrows pointing downwards, each featuring a percentage symbol. This visual metaphor suggests declining financial markets, price reductions, or negative trends
Free with trial Close up of laptop at office workplace with falling red forex candlestick chart on blurry backdrop. Global economic recession, stock market crash, inflation concept. 3D Rendering. Trend decrease illustrations Close up of laptop at office workplace with falling red forex candlestick chart on blurry backdrop. Global economic recession
Free with trial Person displays wooden block featuring a chart, emphasizing data visualization ,Generative ai. Trend decrease illustrations Wooden block chart display, data visualization for business analysis and strategic planning. Person displays wooden block featuring a chart, emphasizing data visualization ,Generative ai
Free with trial Smartphone displaying decreasing bar graph with down arrow hand drawn illustration. Trend decrease vectors Smartphone displaying decreasing bar graph with down arrow hand drawn illustration