Free with trial Descending Bar Chart and Downward Arrow Signifying Business Loss and Economic Downturn. Trend decrease vectors Descending Bar Chart and Downward Arrow Signifying Business Loss and Economic Downturn
Free with trial Financial chart arrow up and down icon illustration. Growth and decline graph symbol on black circle. Trend decrease vectors Financial chart arrow up and down icon. Growth and decline graph symbol on black circle
Free with trial A finger holds a white sign representing a decrease in CO2 emissions, symbolized by a downward-trending arrow, against a light blue background, indicating environmental awareness. Trend decrease illustrations Symbol of decreasing CO2 emissions shows commitment to a healthier, greener environment. A finger holds a white sign representing a decrease in CO2 emissions, symbolized by a downward-trending arrow, against a light blue background, indicating environmental awareness
Free with trial A 3D cartoon boy with brown hair, wearing a light blue t-shirt and blue pants, holds a large pink arrow pointing downwards against a white background. Trend decrease illustrations Cartoon boy in blue shirt and pants holding a large pink downward arrow male child. A 3D cartoon boy with brown hair, wearing a light blue t-shirt and blue pants, holds a large pink arrow pointing downwards against a white background
Free with trial A woman contemplates a declining bar graph, symbolizing business challenges and financial analysis. Trend decrease vectors Woman Analyzing Declining Bar Graph - Business and Finance Visualization Illustration. A woman contemplates a declining bar graph, symbolizing business challenges and financial analysis.
Free with trial Financial chart with red candlesticks showing a downtrend, glowing on a dark background. Represents stock market downturn, financial crisis. 3D Rendering. Trend decrease illustrations Financial chart with falling red candlesticks and data on a dark interface backdrop, representing market decline and economic loss. Financial chart with red candlesticks showing a downtrend, glowing on a dark background. Represents stock market downturn, financial crisis. 3D Rendering
Free with trial A pair of striking red arrows, one indicating upward movement and the other downward, presented in a clean 3D render on a white background, symbolizing change and direction. Trend decrease illustrations Two red arrows, one pointing up and one pointing down, isolated on white background. A pair of striking red arrows, one indicating upward movement and the other downward, presented in a clean 3D render on a white background, symbolizing change and direction
Free with trial Five distinct stacks of gold coins are arranged in a descending order of height on a clean white surface. The coins are shiny and metallic, creating a visual representation of a financial graph or a decreasing trend in wealth or value. Trend decrease illustrations Five Stacks of Gold Coins Decreasing in Height on White Background money currency. Five distinct stacks of gold coins are arranged in a descending order of height on a clean white surface. The coins are shiny and metallic, creating a visual representation of a financial graph or a decreasing trend in wealth or value
Free with trial Three distinct 3D icons are presented on a white background. In the center is a yellow coin with a white dollar sign. To the top right is a green circular icon with a white upward-pointing arrow. To the bottom left is a red circular icon with a white downward-pointing arrow. These symbols represent financial concepts like profit, loss, and currency. Trend decrease illustrations 3D icons of a dollar coin, an up arrow, and a down arrow on a white background money currency. Three distinct 3D icons are presented on a white background. In the center is a yellow coin with a white dollar sign. To the top right is a green circular icon with a white upward-pointing arrow. To the bottom left is a red circular icon with a white downward-pointing arrow. These symbols represent financial concepts like profit, loss, and currency
Free with trial A man in a blue suit holds a glowing blue bar graph showing increasing quality and decreasing cost with arrows and text. Trend decrease illustrations Businessman holding glowing bar graph showing cost reduction and quality increase. A man in a blue suit holds a glowing blue bar graph showing increasing quality and decreasing cost with arrows and text
Free with trial A series of red downward-pointing arrows, each featuring a white percent symbol, visually represent falling prices, sales, and economic decline. Trend decrease illustrations Red downward arrows with percent symbols indicate decreasing prices and discounts. A series of red downward-pointing arrows, each featuring a white percent symbol, visually represent falling prices, sales, and economic decline
Free with trial Uptrend and downtrend arrow icon on black circle. Rising and falling arrows illustration concept. Trend decrease vectors Uptrend and downtrend arrow icon on black circle. Rising and falling arrows concept
Free with trial Line graph up and down icon vector. Outline bar chart with arrow symbol. Analytics concept. Trend decrease vectors Line graph up and down icon. Outline bar chart with arrow symbol. Analytics concept
Free with trial A house and dollar symbol balance on a wooden seesaw, representing falling property values and market shifts. Generative AI. Trend decrease illustrations A house and dollar symbol balance on a wooden seesaw, representing falling property values and market shifts
Free with trial Bankruptcy concept in flat design business. design vector illustration. Trend decrease vectors Business and finance concept bankruptcy flat vector design. bankruptcy concept in flat design business.design vector illustration
Free with trial A downward trending candlestick chart with gray bars against a dark green background. Generative AI. Trend decrease illustrations A downward trending candlestick chart with gray bars against a dark green background
Free with trial Red arrows pointing down on a world map with falling stock prices plunge world recession Can be customized to fit various themes and styles. Trend decrease illustrations Red arrows pointing down on a world map with falling stock prices , plunge, world, recession. Red arrows pointing down on a world map with falling stock prices plunge world recession Can be customized to fit various themes and styles
Free with trial Visualize decreasing business performance with this striking image. A pink 3D bar chart graphically represents a decline in financial data, highlighting loss and reduction. The falling graph is juxtaposed with a healthy green plant in a pot, emphasizing the contrast between success and setbacks. Ideal for illustrating economic concepts, investment challenges, or business performance issues, Created AI. Trend decrease illustrations Decreasing business performance represented by pink graphic and potted green plant. Visualize decreasing business performance with this striking image. A pink 3D bar chart graphically represents a decline in financial data, highlighting loss and reduction. The falling graph is juxtaposed with a healthy green plant in a pot, emphasizing the contrast between success and setbacks. Ideal for illustrating economic concepts, investment challenges, or business performance issues, Created AI
Free with trial Downward trending graph with red and black bars on a whiteboard mounted on an easel. Trend decrease illustrations Whiteboard displaying a downward trending graph with red and black bars chart data. Downward trending graph with red and black bars on a whiteboard mounted on an easel
Free with trial A downward trending bar graph in sand symbolizes economic downturn. A dead branch emphasizes decline and crisis. Financial instability concept. Trend decrease illustrations Declining Business Graph Sand Desert Branch Stock Visual: Financial Crisis Metaphor. A downward trending bar graph in sand symbolizes economic downturn. A dead branch emphasizes decline and crisis. Financial instability concept
Free with trial Steep downward trending red line graph with an arrow on a whiteboard mounted on an easel. Trend decrease illustrations Whiteboard showing a steep downward trending red line graph on an easel chart data. Steep downward trending red line graph with an arrow on a whiteboard mounted on an easel
Free with trial Green arrow pointing down, a direction indicator. Curved shape, symbol sign, 3d rendering. Represents decline, reduction, or a downward trend. 161. Trend decrease vectors Green arrow pointing down, curved shape, direction indicator, symbol sign, 3d rendering. Green arrow pointing down, a direction indicator. Curved shape, symbol sign, 3d rendering. Represents decline, reduction, or a downward trend. 161
Free with trial High-detail image showing a dynamic orange graph line representing financial data trends and market fluctuations. Ideal for finance and business themes. Trend decrease illustrations Dynamic Orange Graph Line Representing Financial Data Trends and Market Fluctuations
Free with trial Doodle style illustration of a decreasing bar graph with a downward arrow, economy icon. Trend decrease vectors Doodle style illustration of a decreasing bar graph with a downward arrow, economy icon
Free with trial A comprehensive set of black and white icons for graphs and charts, illustrating various data visualization types and business-related concepts for digital and print media. Trend decrease vectors Diverse collection of graph and chart icons representing data analysis and business growth. A comprehensive set of black and white icons for graphs and charts, illustrating various data visualization types and business-related concepts for digital and print media
Free with trial This image captures the concept of business growth and the importance of cost reduction The image features a person working on a laptop and a tablet with digital arrows indicating profit increasing and cost decreasing It emphasizes the need to balance both factors to achieve overall success in business. Trend decrease illustrations Business growth and cost reduction concept with technology application illustration. This image captures the concept of business growth and the importance of cost reduction The image features a person working on a laptop and a tablet with digital arrows indicating profit increasing and cost decreasing It emphasizes the need to balance both factors to achieve overall success in business
Free with trial This striking image depicts a red arrow, sharply pointed downward against a somber black background. The wooden arrow symbolizes the precipitous decline in the stock market and broader economy. It serves as a stark visual representation of a market crash, business recession, and economic crisis. Falling prices are a clear indicator of instability and uncertainty, creating a sense of loss and. Trend decrease illustrations Visualizing the Downward Spiral A Red Arrow Signals Market Crash and Economic Crisis. This striking image depicts a red arrow, sharply pointed downward against a somber black background. The wooden arrow symbolizes the precipitous decline in the stock market and broader economy. It serves as a stark visual representation of a market crash, business recession, and economic crisis. Falling prices are a clear indicator of instability and uncertainty, creating a sense of loss and
Free with trial Hand in suit holds red zigzag arrow pointing down on white Generative AI. Trend decrease illustrations Hand in suit holds red zigzag arrow pointing down on white
Free with trial Hand in suit holds red zigzag arrow pointing down on white Generative AI. Trend decrease illustrations Hand in suit holds red zigzag arrow pointing down on white
Free with trial Hand in suit holds red zigzag arrow pointing down on white Vertical Mobile Wallpaper. Trend decrease illustrations Hand in suit holds red zigzag arrow pointing down on white
Free with trial A hand draws upward trending arrows on a chalkboard, showing sales, margin, and profitability increasing while costs decrease. Trend decrease illustrations Chalkboard illustrating rising sales margin and profitability with decreasing costs. A hand draws upward trending arrows on a chalkboard, showing sales, margin, and profitability increasing while costs decrease
Free with trial Close-up of a modern computer screen displaying stock market data and financial charts. Trend decrease illustrations Analyzing live stock market data on a computer screen, offering insights into trends. Close-up of a modern computer screen displaying stock market data and financial charts.
Free with trial Purple graph with bar chart visually representing data analysis and growth ,Generative ai. Trend decrease illustrations Purple graph with bar chart, visual representation of data analysis, growth, and business trends. Purple graph with bar chart visually representing data analysis and growth ,Generative ai
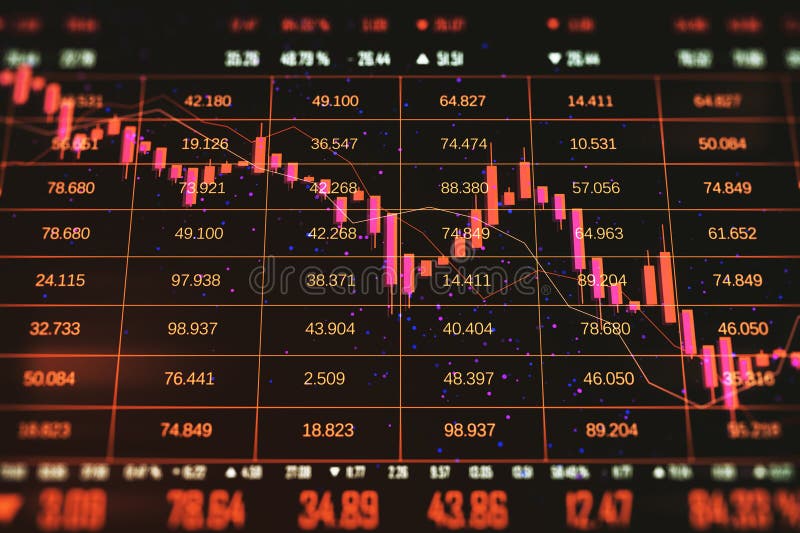
Free with trial Contrasting close-up trading chart, the concept of stock price volatility and stock market instability. High quality photo. Trend decrease illustrations Contrasting close-up trading chart, the concept of stock price volatility and stock market instability
Free with trial Magnifying glass analyzing candlestick chart showing stock market crash, concept of financial crisis, investment and trading. Trend decrease illustrations Magnifying glass analyzing stock market candlestick chart displaying financial crisis. Magnifying glass analyzing candlestick chart showing stock market crash, concept of financial crisis, investment and trading
Free with trial Hand drawn graph chart with arrow pointing downward showing financial decline or loss. Trend decrease vectors Hand drawn graph chart with arrow pointing downward showing financial decline or loss
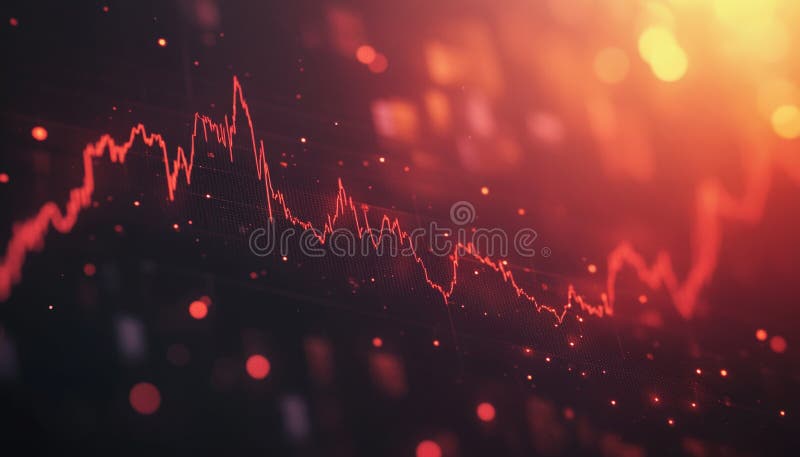
Free with trial Downward Trending Graph On Stock Market Display With Red Data Points And A Fiery Red Glow, Generated by AI. Trend decrease illustrations Downward Trending Graph On Stock Market Display With Red Data Points And A Fiery Red Glow
Free with trial This vibrant image showcases a 3D rendering of colorful cylinders arranged on a pink platform, overlaid with a rising line graph symbolizing upward trends and positive growth. Perfect for illustrating business success, financial progress, or marketing presentations. Trend decrease illustrations Colorful 3D Cylinders and Rising Line Graph on Pink Platform: Business Growth Concept. This vibrant image showcases a 3D rendering of colorful cylinders arranged on a pink platform, overlaid with a rising line graph symbolizing upward trends and positive growth. Perfect for illustrating business success, financial progress, or marketing presentations.
Free with trial Illustration shows a stock market decline with candlestick charts and downward trending arrow. The design features a light blue background and a simple layout. Useful for financial articles, reports, or any material illustrating loss, recession, or negative trends in commercial sector. Trend decrease illustrations Falling stock market chart showing economic downturn and financial loss. Illustration shows a stock market decline with candlestick charts and downward trending arrow. The design features a light blue background and a simple layout. Useful for financial articles, reports, or any material illustrating loss, recession, or negative trends in commercial sector
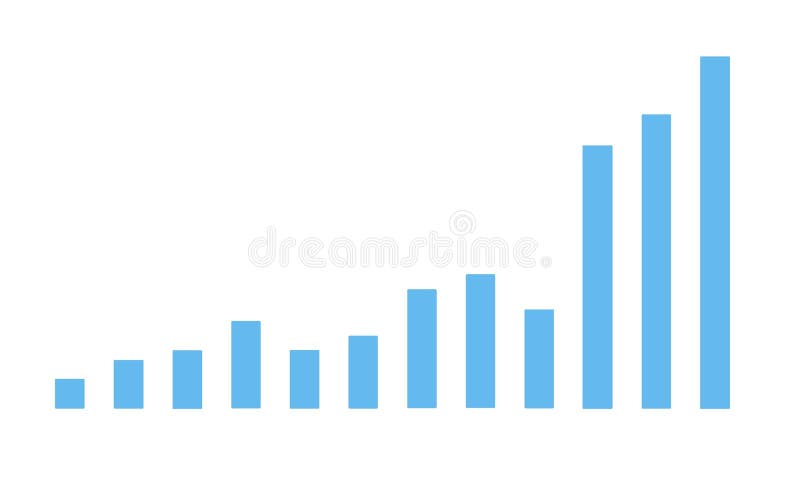
Free with trial Colorful bar chart on a blue background showing data analysis and statistical growth. Generative AI. Trend decrease illustrations Colorful bar chart on a blue background showing data analysis and statistical growth
Free with trial A digital illustration depicting a financial chart with blue and red bars and lines. Neon glows accentuate the data points. The style is abstract and modern. Trend decrease illustrations Abstract Blue Red Financial Data Chart Graph Digital Illustration Neon Glow business. A digital illustration depicting a financial chart with blue and red bars and lines. Neon glows accentuate the data points. The style is abstract and modern
Free with trial A 3D illustration of a bar graph with a blue downward arrow, symbolizing financial decline or loss, isolated on white. Trend decrease illustrations Bar Graph with Blue Arrow Pointing Down 3D Illustration Isolated on White Background. A 3D illustration of a bar graph with a blue downward arrow, symbolizing financial decline or loss, isolated on white.
Free with trial A transparent background sticker of a red downward arrow Stock, rendered in 3D. Trend decrease illustrations A transparent background sticker of a red downward arrow Stock, rendered in 3D.
Free with trial Simple Blue Analytics Diagram Bar Chart Showing Variable Data Trends on White Background � Simple Abstract Business and Analytics Infographic Illustration. Trend decrease illustrations Simple Blue Analytics Diagram Bar Chart Showing Variable Data Trends on White Background
Free with trial Businessman walking with a sad feeling. Fall of the economy, reduction of capital. Declining economy. Economic Recession concept. trend modern vector flat illustration. Trend decrease vectors Businessman walking with a sad feeling. Fall of the economy, reduction of capital. Declining economy.
Free with trial Displaying 3D bar columns on analytics dashboard, with overlaid line graph and numeric labels. Data, visualization, dashboard, analytics, infographic, 3d, abstract. Trend decrease illustrations Displaying 3D bar columns on analytics dashboard, with overlaid line graph and numeric labels
Free with trial Report, 3D Chart, Block diagram and Dot Plot graph linear icons. Design shape elements. Charts and Diagrams line icons. Trend, Pyramid and Pie chart report symbols. Vector. Trend decrease vectors Charts and Diagrams line icons. Set of 3D Chart, Block diagram and Dot Plot graph icons. Design elements. Vector. Report, 3D Chart, Block diagram and Dot Plot graph linear icons. Design shape elements. Charts and Diagrams line icons. Trend, Pyramid and Pie chart report symbols. Vector
Free with trial A 3D bar chart displays four bars in descending order of height: green, purple, blue, and pink, set against a white background. Clear details and vibrant colors enhance visual appeal. Trend decrease illustrations 3D Bar Chart With Green Purple Blue And Pink Bars In Descending Order graph decrease. A 3D bar chart displays four bars in descending order of height: green. A 3D bar chart displays four bars in descending order of height: green, purple, blue, and pink, set against a white background. Clear details and vibrant colors enhance visual appeal
Free with trial Stock market bear market. Downward tread chart on the investment. Bear trader wearing eyeglasses sitting at office monitoring stock market. Generative Ai. Trend decrease illustrations Bull trader wearing eyeglasses sitting at office monitoring stock market. Generative Ai. Stock market bear market. Downward tread chart on the investment. Bear trader wearing eyeglasses sitting at office monitoring stock market. Generative Ai
Free with trial Declining graph showing a financial or business downturn, with bar chart and arrow down. Trend decrease vectors Declining graph showing a financial or business downturn, with bar chart and arrow down
Free with trial Illustration shows a sad woman with a downward trending graph behind her representing loss or decline, conveying a somber and reflective mood. Generative AI. Trend decrease vectors Sad woman standing in front of declining graph showing economic or personal loss vector illustration. Illustration shows a sad woman with a downward trending graph behind her representing loss or decline, conveying a somber and reflective mood. Generative AI
Free with trial Rising thick red arrow filling grid lines in design studio, with blue pink charts, dotted bars. Financial, analytics, data, visualization, digital, technology, infographic. Trend decrease illustrations Rising thick red arrow filling grid lines in design studio, with blue pink charts, dotted bars
Free with trial Digital financial ticker display is showing real‑time market data with arrows in flat design. Finance, technology, analytics, data, stock, investment, digital. Trend decrease illustrations Digital financial ticker display is showing real?time market data with arrows in flat design. Digital financial ticker display is showing real‑time market data with arrows in flat design. Finance, technology, analytics, data, stock, investment, digital
Free with trial A red stock market decline is shown with a bar chart against a dark background. The image conveys a sense of financial crisis and economic downturn, visually representing negative trends. Trend decrease illustrations Red Stock Market Decline Graphic Bar Chart Financial Crisis Concept on Dark Background. A red stock market decline is shown with a bar chart against a dark background. The image conveys a sense of financial crisis and economic downturn, visually representing negative trends
Free with trial A 3D pie chart with three colored segments (pink, blue, and teal) is shown against a solid purple background. A yellow circle with a white upward arrow is positioned to the left of the chart, and a pink circle with a white downward arrow is to the right. Trend decrease illustrations 3D Pie Chart With Up and Down Arrows Indicating Growth and Decline on a Purple Background. A 3D pie chart with three colored segments (pink, blue, and teal) is shown against a solid purple background. A yellow circle with a white upward arrow is positioned to the left of the chart, and a pink circle with a white downward arrow is to the right
Free with trial Cyborg robot in front of digital stock market chart with red downward arrows on dark background, concept of financial crisis and automation. 3D Rendering. Trend decrease illustrations Futuristic robot analyzing falling stock market chart on dark background with red indicators and downward trend line representing. Cyborg robot in front of digital stock market chart with red downward arrows on dark background, concept of financial crisis and automation. 3D Rendering
Free with trial Bar chart graph. Colorful falling arrow. Financial data analysis. Vector business symbol. EPS 10. Trend decrease vectors Bar chart graph. Colorful falling arrow. Financial data analysis. Vector business symbol.
Free with trial Stock market chart featuring a red downtrend line against a black background, fluctuations in financial data. perfect for illustrating concepts in finance, investment analysis, and economic downturns. Generative AI. Trend decrease illustrations Dynamic Stock Market Analysis with Red Downtrend Line on Black Background Generative AI. Stock market chart featuring a red downtrend line against a black background, fluctuations in financial data. perfect for illustrating concepts in finance, investment analysis, and economic downturns. Generative AI
Free with trial Hand drawn bar chart with declining arrow showing economic recession and financial loss. Trend decrease vectors Hand drawn bar chart with declining arrow showing economic recession and financial loss
Free with trial Close-up view of a computer monitor displaying a vibrant bar chart, indicating data analysis and progress tracking ,Generative ai. Trend decrease illustrations Computer monitor displaying a colorful bar chart for data analysis and progress tracking. Close-up view of a computer monitor displaying a vibrant bar chart, indicating data analysis and progress tracking ,Generative ai
Free with trial Bankruptcy concept in flat design business. design vector illustration. Trend decrease vectors Business bankruptcy concept in flat vector design. bankruptcy concept in flat design business.design vector illustration
Free with trial A striking visual representation of two contrasting trends, one rising and the other falling, depicted through elegant gradient colors in sharp focus. Trend decrease illustrations Dynamic Contrast of Trends Illustrated Through a Gradient Wave in a Vibrant Display of Colors. A striking visual representation of two contrasting trends, one rising and the other falling, depicted through elegant gradient colors in sharp focus
Free with trial Image is generated with the use of an AI. Trend decrease illustrations Crisis 19 covid recession financial evaluation negative down showing hand arrow Holding. image is generated with the use of an AI
Free with trial A 3D illustration depicting financial growth. A line graph with blue and red data points ascends across a light blue background. Interspersed are green and red candlestick bars, representing market fluctuations. Stacks of gold coins and individual coins with dollar signs are arranged at the base of the chart, symbolizing wealth and investment. Trend decrease illustrations 3D Financial Growth Chart with Stacks of Gold Coins and Candlestick Bars finance graph. A 3D illustration depicting financial growth. A line graph with blue and red data points ascends across a light blue background. Interspersed are green and red candlestick bars, representing market fluctuations. Stacks of gold coins and individual coins with dollar signs are arranged at the base of the chart, symbolizing wealth and investment
Free with trial Graph icon indicating growth and data analysis, perfect for business presentations and financial reports. visual representation of progress ,Generative ai. Trend decrease illustrations Graph icon, a comprehensive symbol of data analysis, growth, and business trends for effective presentations. Graph icon indicating growth and data analysis, perfect for business presentations and financial reports. visual representation of progress ,Generative ai
Free with trial Red bar chart displays performance metrics on a table ,Generative ai. Trend decrease illustrations Red bar chart illustrating performance metrics on a table, data analysis and visualization. Red bar chart displays performance metrics on a table ,Generative ai
Free with trial A red arrow crashes through a stock market graph displayed on a tablet screen. the scene is set against a dark blue background, symbolizing financial crisis and economic downturn. it represents loss and risk. Trend decrease illustrations Red arrow crashing through stock market graph on tablet screen in a dark blue background. a red arrow crashes through a stock market graph displayed on a tablet screen. the scene is set against a dark blue background, symbolizing financial crisis and economic downturn. it represents loss and risk.
Free with trial Colorful growth chart with red and teal bars showing upward and downward arrows on a light background representing data trends progress decline business performance and financial analytics visual. Trend decrease illustrations Colorful growth chart with red and teal bars and upward and downward arrows on light background. colorful growth chart with red and teal bars showing upward and downward arrows on a light background representing data trends progress decline business performance and financial analytics visual
Free with trial Toy figurines arranged on colorful blocks to create a bar graph, representing population growth, demographic trends, and social statistics. Trend decrease illustrations Toy figurines standing on colorful blocks forming a bar graph, symbolizing population growth, demographic trends, and social. Toy figurines arranged on colorful blocks to create a bar graph, representing population growth, demographic trends, and social statistics
Free with trial This illustration depicts upward and downward trending arrows on a grid, symbolizing market fluctuations, business trends, and financial performance analysis. Trend decrease vectors Illustration of upward and downward trending arrows on a grid isolated on white background. This illustration depicts upward and downward trending arrows on a grid, symbolizing market fluctuations, business trends, and financial performance analysis
Free with trial Two flat design icons depicting the Indian Rupee (? ) symbol in a circular frame with a downward arrow, signifying a declining value. Trend decrease vectors Indian Rupee Symbol Round Icons Displaying in Red and Blue with Long Shadow. Decreasing Rupee Value. Two flat design icons depicting the Indian Rupee (?) symbol in a circular frame with a downward arrow, signifying a declining value.
Free with trial Red graph shows plummeting house prices scattered coins economic crisis risk management Vector illustration for high-quality printing. Trend decrease illustrations Red graph shows plummeting house prices; scattered coins , economic crisis, risk management. Red graph shows plummeting house prices scattered coins economic crisis risk management Vector illustration for high-quality printing
Free with trial A red downward arrow sticker for Stock, 3D rendered with a transparent background. Trend decrease illustrations A red downward arrow sticker for Stock, 3D rendered with a transparent background.
Free with trial Square Format Infographic Poster Bold Typography Charts 1 Upscaled 4X clean composition. Featuring square, format, infographic. Neutral, commercial-friendly, with room for copy. Trend decrease illustrations Square Format Infographic Poster Bold Typography Charts 1 Upscaled 4X clean composition
Free with trial A 3D illustration of a blue line graph on a light blue background. The graph features a wavy blue line connecting several data points represented by small pink and green spheres. The overall shape suggests fluctuating data or trends, with some points indicating upward movement. Trend decrease illustrations 3D Blue Line Graph with Pink and Green Data Points on Light Blue Background chart statistics. A 3D illustration of a blue line graph on a light blue background. The graph features a wavy blue line connecting several data points represented by small pink and green spheres. The overall shape suggests fluctuating data or trends, with some points indicating upward movement
Free with trial A minimalist 3D render displays three rounded rectangular bars representing a bar graph. The tallest bar is a soft blue, followed by a medium green bar, and the shortest is a light pink bar. They are arranged in descending order of height and stand on a plain white background, suggesting data visualization or progress. Trend decrease illustrations Three colorful 3D bar graph elements in blue green and pink on a white background chart. A minimalist 3D render displays three rounded rectangular bars representing a bar graph. The tallest bar is a soft blue, followed by a medium green bar, and the shortest is a light pink bar. They are arranged in descending order of height and stand on a plain white background, suggesting data visualization or progress
Free with trial A golden bitcoin coin with a prominent B symbol is centered within a green circular frame. A red downward-pointing arrow and a green upward-pointing arrow are positioned to the right of the coin, suggesting financial fluctuation. Trend decrease illustrations Golden bitcoin symbol with downward red arrow and green arrow cryptocurrency digital currency. A golden bitcoin coin with a prominent B symbol is centered within a green circular frame. A red downward-pointing arrow and a green upward-pointing arrow are positioned to the right of the coin, suggesting financial fluctuation
Free with trial GDP decline indicated by arrow on digital global map highlight economic indicator across a geographical area. Trend decrease illustrations GDP decline indicated by arrow on digital global map highlight economic indicator across a geographical area
Free with trial Red arrow points downward against a white backdrop representing economic decline financial loss and market downturn suggesting potential investment risks and business challenges ahead. Trend decrease vectors Red arrow downward on a white background indicating financial loss or economic recession. Red arrow points downward against a white backdrop representing economic decline financial loss and market downturn suggesting potential investment risks and business challenges ahead.
Free with trial Economic recession symbol with a sharp jagged arrow pointing down indicating a market crash. Trend decrease vectors Economic recession symbol with a sharp jagged arrow pointing down indicating a market crash