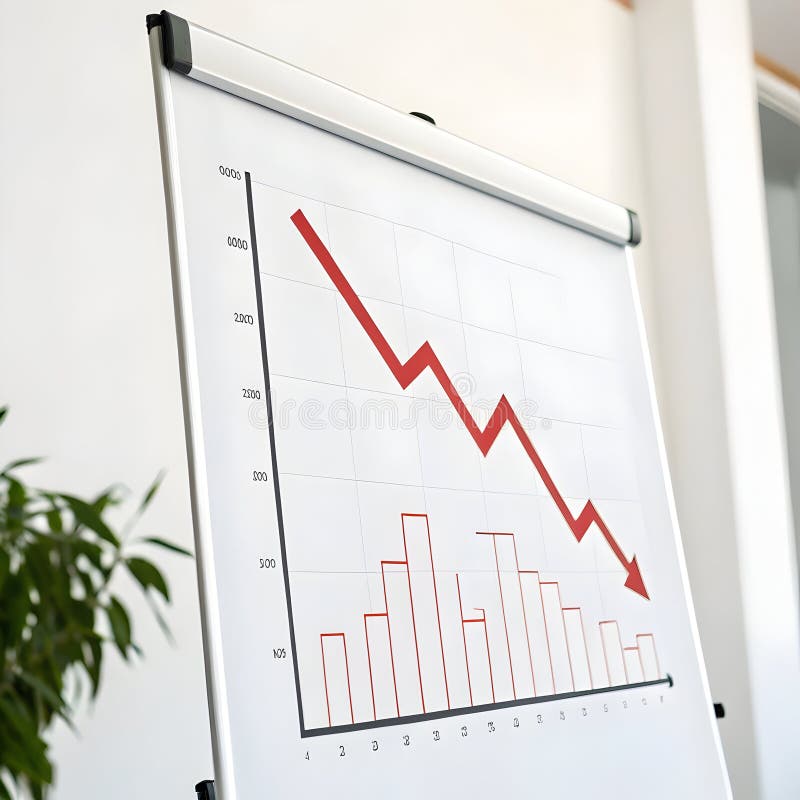
Free with trial The image shows a white easel holding a canvas with a red bar and line graph depicting a declining trend. The graph starts with high bars that gradually decrease in height, transitioning into a downward-sloping line. Beside the easel, there is a small golden trophy, possibly symbolizing achievement or competition. The overall scene suggests a representation of decreasing performance or results. Analysis decrease illustrations A downward trend graph displayed on an easel with a small golden trophy beside it. The image shows a white easel holding a canvas with a red bar and line graph depicting a declining trend. The graph starts with high bars that gradually decrease in height, transitioning into a downward-sloping line. Beside the easel, there is a small golden trophy, possibly symbolizing achievement or competition. The overall scene suggests a representation of decreasing performance or results
Free with trial Hand drawn style up arrow with plus percentage and down arrow with minus percentage. Representing increase and decrease. Analysis decrease vectors Hand-drawn style arrows displaying positive and negative percentages, symbolizing growth and decline. Hand drawn style up arrow with plus percentage and down. Hand drawn style up arrow with plus percentage and down arrow with minus percentage. Representing increase and decrease
Free with trial Flat design illustration showing colorful bar graph combined with a line chart, both displaying data trends against a simple black background. Analysis decrease vectors Colorful Bar Graph and Line Chart on Black Background Illustrating Data Analysis and Trends. Flat design illustration showing colorful bar graph combined with a line chart, both displaying data trends against a simple black background.
Free with trial Percentage symbol displayed on a wooden block represents financial concepts such as discounts sales interest rates and investment returns for business marketing and economic analysis indicating poten. Analysis decrease illustrations Percentage discount sale promotion offer finance interest rate marketing retail shopping investment savings loan growth profit mar. Percentage symbol displayed on a wooden block represents financial concepts such as discounts sales interest rates and investment returns for business marketing and economic analysis indicating poten
Free with trial Cac cost acquisition is represented by wooden blocks and stacks of coins showing decreasing investment and financial return on marketing strategy business planning and customer acquisition for sales. Analysis decrease illustrations Cac cost acquisition marketing business finance investment strategy return growth analysis budget advertising customer sales reven. Cac cost acquisition is represented by wooden blocks and stacks of coins showing decreasing investment and financial return on marketing strategy business planning and customer acquisition for sales
Free with trial The image displays a detailed stock market chart with various lines and data points. The chart shows a significant drop in stock prices, with a prominent red line indicating a decrease of 28. 49%. The background features additional stock data and numbers, highlighting the volatility and dynamic nature of the stock market. Analysis decrease illustrations A close-up view of a stock market chart showing significant fluctuations in stock prices. The image displays a detailed stock market chart with various lines and data points. The chart shows a significant drop in stock prices, with a prominent red line indicating a decrease of 28.49%. The background features additional stock data and numbers, highlighting the volatility and dynamic nature of the stock market
Free with trial Red arrow pointing downward on a light background. Financial graph with falling trend line. Digital stock market data visualization for investment analysis. Analysis decrease illustrations Red arrow pointing downward on a light background. Financial graph with falling trend line
Free with trial This 3D illustration depicts a purple calculator as the central element, set against a clean white background. Various colorful, stylized icons float around it, representing concepts related to business and finance. The icons include a percentage sign, an upward trend graph, a dollar sign, a notification bell, and a message bubble. The composition suggests themes of accounting, financial analysis. Analysis decrease illustrations A purple calculator surrounded by business and financial icons in a 3d cartoon style. This 3D illustration depicts a purple calculator as the central element, set against a clean white background. Various colorful, stylized icons float around it, representing concepts related to business and finance. The icons include a percentage sign, an upward trend graph, a dollar sign, a notification bell, and a message bubble. The composition suggests themes of accounting, financial analysis
Free with trial A stark visual representation of fluctuating interest rates and housing market dynamics. A red arrow points downward, symbolizing a decrease, while a green house features a percentage symbol suggesting a change. Analysis decrease illustrations Red down arrow and green house with percentage symbols indicating financial trends. A stark visual representation of fluctuating interest rates and housing market dynamics. A red arrow points downward, symbolizing a decrease, while a green house features a percentage symbol suggesting a change
Free with trial A conceptual shot of a businessman pointing at a glowing green arrow that indicates risk reduction the arrow has the word risk written on it to further emphasize the concept of risk management strategy planning success investment return profitability market analysis and economic factors for sustainable business growth and development highlighting the importance of careful planning and strategic. Analysis decrease illustrations Risk Management Strategy for Business Growth and Success with Green Arrow Pointing Downwards Showing Reduced Risk. A conceptual shot of a businessman pointing at a glowing green arrow that indicates risk reduction the arrow has the word risk written on it to further emphasize the concept of risk management strategy planning success investment return profitability market analysis and economic factors for sustainable business growth and development highlighting the importance of careful planning and strategic
Free with trial A 3D rendered bar chart illustrates a downward trend. Two tall green bars are followed by two shorter pink bars, representing a decrease in value. A bright yellow arrow sharply descends from right to left, crossing over the bars and emphasizing the decline. The composition is set against a solid light blue background. Analysis decrease illustrations 3D Bar Chart with Falling Yellow Arrow Indicating Decline on Blue Background graph. A 3D rendered bar chart illustrates a downward trend. Two tall green bars are followed by two shorter pink bars, representing a decrease in value. A bright yellow arrow sharply descends from right to left, crossing over the bars and emphasizing the decline. The composition is set against a solid light blue background
Free with trial The image shows a wooden easel holding a whiteboard with a declining trend chart. The chart features a combination of red vertical bars and a downward-sloping red line, indicating a decrease in values over time. The easel stands on a light gray surface, and the chart appears to be used for visual presentations or data analysis. Analysis decrease illustrations Declining trend chart displayed on an easel with red bar and line graph elements. The image shows a wooden easel holding a whiteboard with a declining trend chart. The chart features a combination of red vertical bars and a downward-sloping red line, indicating a decrease in values over time. The easel stands on a light gray surface, and the chart appears to be used for visual presentations or data analysis
Free with trial A small house model is placed next to a red percentage symbol and a bar graph showing a downward trend, indicating a decrease in value or growth. Analysis decrease illustrations A small house model with a red percentage symbol and bar graph showing a downward trend. A small house model is placed next to a red percentage symbol and a bar graph showing a downward trend, indicating a decrease in value or growth
Free with trial The image depicts a bar chart with a superimposed red line showing a clear downward trend. Each bar represents a progressively smaller value, indicating a consistent decrease in data over time. The chart uses a gradient from taller to shorter bars, suggesting a significant drop in the measured quantity, which is reinforced by the downward-sloping line connecting the tops of the bars. Analysis decrease illustrations Declining bar chart graph illustrating a downward trend in data values over time. The image depicts a bar chart with a superimposed red line showing a clear downward trend. Each bar represents a progressively smaller value, indicating a consistent decrease in data over time. The chart uses a gradient from taller to shorter bars, suggesting a significant drop in the measured quantity, which is reinforced by the downward-sloping line connecting the tops of the bars
Free with trial A downward graph chart showing a decrease, isolated on a white background, perfect for business and financial presentations. Analysis decrease illustrations Downward graph chart isolated on white background. A downward graph chart showing a decrease, isolated on a white background, perfect for business and financial presentations
Free with trial A downward graph chart showing a decrease, isolated on a white background, perfect for business and financial presentations. Analysis decrease illustrations Downward graph chart isolated on white background. A downward graph chart showing a decrease, isolated on a white background, perfect for business and financial presentations
Free with trial This image displays a series of vertical bars arranged in a gradient color spectrum from green to red. Each bar varies in height, suggesting a comparison of different values or quantities. The bars start tall on the left in green, gradually decrease in height towards the center, and then increase again towards the right, ending with the tallest bar on the far right in red. The gradient color. Analysis decrease illustrations Colorful bar chart showing varying heights in a gradient spectrum from green to red. This image displays a series of vertical bars arranged in a gradient color spectrum from green to red. Each bar varies in height, suggesting a comparison of different values or quantities. The bars start tall on the left in green, gradually decrease in height towards the center, and then increase again towards the right, ending with the tallest bar on the far right in red. The gradient color
Free with trial A 3D bar chart shows a significant downward trend with a prominent red arrow indicating a steep financial decline and market drop. Analysis decrease illustrations Financial downturn declining bar chart with red arrow symbolizing loss and decrease. A 3D bar chart shows a significant downward trend with a prominent red arrow indicating a steep financial decline and market drop
Free with trial A 3D rendering shows a bar graph of five columns in pink, blue, and yellow hues illustrating decrease or loss, set against a transparent background. Analysis decrease vectors Colorful bar graph illustration presenting downward trend on transparent background. A 3D rendering shows a bar graph of five columns in pink, blue, and yellow hues illustrating decrease or loss, set against a transparent background.
Free with trial A bar graph depicting a significant decrease in value or performance, highlighted by a prominent red arrow pointing downwards, indicating a negative trend. Analysis decrease illustrations Bar graph illustrating a downward trend with a red arrow isolated on white background. A bar graph depicting a significant decrease in value or performance, highlighted by a prominent red arrow pointing downwards, indicating a negative trend
Free with trial The image shows a bar graph with green bars decreasing in height from left to right. A red arrow is superimposed over the bars, pointing downward, indicating a decline in value or performance. Analysis decrease illustrations A downward trending bar graph with a red arrow indicating a decrease in value. The image shows a bar graph with green bars decreasing in height from left to right. A red arrow is superimposed over the bars, pointing downward, indicating a decline in value or performance
Free with trial The image depicts a combination of bar and line charts. The bar chart shows three descending bars in orange, yellow, and a lighter shade, indicating a decline in values. Overlaid on this is a downward-sloping line chart, reinforcing the trend of decrease. The overall design suggests a visual representation of a downward market trend or decline in performance metrics over time. Analysis decrease illustrations Graphic illustration of declining market trends with bar and line chart combination. The image depicts a combination of bar and line charts. The bar chart shows three descending bars in orange, yellow, and a lighter shade, indicating a decline in values. Overlaid on this is a downward-sloping line chart, reinforcing the trend of decrease. The overall design suggests a visual representation of a downward market trend or decline in performance metrics over time
Free with trial Declining Bar Graph With Cursor Solid Icon. Business Performance, Financial Loss, And Market Downturn Silhouette Symbol. Economic Analysis. Isolated Vector Illustration. Analysis decrease vectors Declining Bar Graph With Cursor Solid Icon. Business Performance, Financial Loss, And Market Downturn Silhouette Symbol
Free with trial Minimalist bar chart created with natural wooden blocks, symbolizing data, financial trends, market fluctuations, and business analysis on a white surface. Analysis decrease illustrations Wooden blocks bar chart illustrating business data progression on a white background. Minimalist bar chart created with natural wooden blocks, symbolizing data, financial trends, market fluctuations, and business analysis on a white surface.
Free with trial Line art bar graph icon set featuring upward and downward trend arrows for business analysis. Analysis decrease vectors Line art bar graph icon set featuring upward and downward trend arrows for business analysis
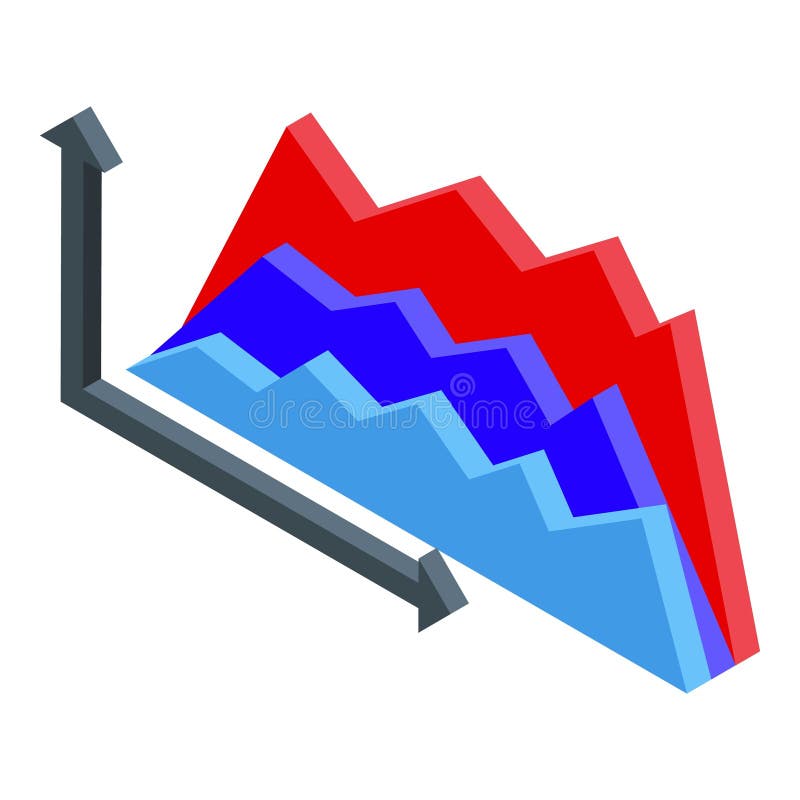
Free with trial Isometric graph showing different trends with ups and downs, concept of trading and business analysis. Analysis decrease illustrations Isometric graph showing different trends with ups and downs
Free with trial A 3D bar chart and a partial pie chart illustrating data and growth, with percentage labels, on a white background. Analysis decrease illustrations 3D Bar Chart and Pie Chart Showing Growth and Data Analysis on White Background graph statistics. A 3D bar chart and a partial pie chart illustrating data and growth, with percentage labels, on a white background
Free with trial A downward trending graph with a red arrow pointing to the decline, set against a blue background with grid lines and various colored bars at the bottom. Analysis decrease illustrations Downward trend analysis showing significant decline over time with various data points. A downward trending graph with a red arrow pointing to the decline, set against a blue background with grid lines and various colored bars at the bottom
Free with trial Four wooden blocks spelling "RISK" are stacked on piles of coins. Each block has a decreasing percentage value above it, starting with +0. 75% and ending with +0. 25%, accompanied by a downward-sloping arrow. This visual represents a reduction in risk or a decrease in financial exposure. Analysis decrease illustrations Wooden blocks spelling RISK stacked on coins with decreasing percentage values risk finance. Four wooden blocks spelling "RISK" are stacked on piles of coins. Each block has a decreasing percentage value above it, starting with +0.75% and ending with +0.25%, accompanied by a downward-sloping arrow. This visual represents a reduction in risk or a decrease in financial exposure
Free with trial This image depicts a bar chart transitioning from green to red bars, representing a shift from positive growth to decline. Overlaid green and red line graphs emphasize the upward trend followed by a downward trend, symbolizing financial success turning into loss, often seen in market analysis or business performance evaluations. Analysis decrease vectors Graphic illustration of financial growth and subsequent decline using bar and line charts. This image depicts a bar chart transitioning from green to red bars, representing a shift from positive growth to decline. Overlaid green and red line graphs emphasize the upward trend followed by a downward trend, symbolizing financial success turning into loss, often seen in market analysis or business performance evaluations
Free with trial The image displays two sets of vertical bars, one in green and one in red, each accompanied by arrows indicating trends. The green bars show an initial decrease followed by an increase, while the red bars show an initial increase followed by a decrease. The visual is labeled 'Word 100' at the bottom right, potentially indicating a specific data point or category. Analysis decrease illustrations Comparison of increasing and decreasing bar trends in a visual chart labeled word 100. The image displays two sets of vertical bars, one in green and one in red, each accompanied by arrows indicating trends. The green bars show an initial decrease followed by an increase, while the red bars show an initial increase followed by a decrease. The visual is labeled 'Word 100' at the bottom right, potentially indicating a specific data point or category
Free with trial The image shows a person holding a tablet displaying a bar chart with two distinct data sets, one in red and one in blue, indicating a comparison of metrics or trends. The person appears to be in an office environment, possibly analyzing financial or business data, suggesting a focus on performance metrics or market analysis. Analysis decrease illustrations Professional analyzing financial growth trends on a digital tablet in an office setting. The image shows a person holding a tablet displaying a bar chart with two distinct data sets, one in red and one in blue, indicating a comparison of metrics or trends. The person appears to be in an office environment, possibly analyzing financial or business data, suggesting a focus on performance metrics or market analysis
Free with trial The image features a small house model with a large percent sign on it, symbolizing interest rates or property values. Next to the house is a red bar graph with a downward trend, indicating a decrease in whatever the graph is measuring. Analysis decrease illustrations A small house model with a percent sign on it next to a red bar graph showing a downward trend. The image features a small house model with a large percent sign on it, symbolizing interest rates or property values. Next to the house is a red bar graph with a downward trend, indicating a decrease in whatever the graph is measuring
Free with trial This is an detailed collection of financial icons depicting various stock market trends, growth curves, and data analysis patterns. Analysis decrease vectors Financial data and stock market trend line icons set showing growth and volatility curves. This is an detailed collection of financial icons depicting various stock market trends, growth curves, and data analysis patterns
Free with trial Man pointing at declining chart in office symbolizing loss and economic downturn in business strategy a man pointing at a declining chart ,Generative ai. Analysis decrease illustrations Businessman Pointing at Declining Chart Showing Negative Growth in Financial Analysis Presentation Businessman. Man pointing at declining chart in office symbolizing loss and economic downturn in business strategy a man pointing at a declining chart ,Generative ai
Free with trial Negative growth graph with white 3d pillars on grid floor against blue background for market trend analysis. Analysis decrease illustrations Business bar chart with declining red arrow showing financial loss and economic recession. Negative growth graph with white 3d pillars on grid floor against blue background for market trend analysis
Free with trial The image shows a series of red bars of varying heights, each with an arrow pointing downwards, illustrating a decline in values. The bars represent data points that decrease over time, with the arrows emphasizing the downward trend. Analysis decrease illustrations A visual representation of fluctuating data trends with arrows indicating changes. The image shows a series of red bars of varying heights, each with an arrow pointing downwards, illustrating a decline in values. The bars represent data points that decrease over time, with the arrows emphasizing the downward trend
Free with trial A hand displays a green bar graph illustrating a downward trend in CO2 levels, symbolizing environmental protection and carbon reduction. Analysis decrease illustrations Hand holding a bar graph showing a decrease in CO2 emissions against a green leafy background. A hand displays a green bar graph illustrating a downward trend in CO2 levels, symbolizing environmental protection and carbon reduction
Free with trial A single yellow coin with the prominent Bitcoin symbol is centrally placed on a white background. To its left is a green circular icon with an upward-pointing arrow, signifying an increase or positive trend. To its right is a red circular icon with a downward-pointing arrow, representing a decrease or negative trend. The composition visually represents the fluctuating nature of cryptocurrency. Analysis decrease illustrations Bitcoin symbol coin with green up arrow and red down arrow on a white background cryptocurrency. A single yellow coin with the prominent Bitcoin symbol is centrally placed on a white background. To its left is a green circular icon with an upward-pointing arrow, signifying an increase or positive trend. To its right is a red circular icon with a downward-pointing arrow, representing a decrease or negative trend. The composition visually represents the fluctuating nature of cryptocurrency
Free with trial The image depicts a red bar graph on a transparent background with a downward trend, indicating a decrease in values. The graph features a series of red bars of varying heights, with a red arrow pointing downwards to emphasize the decline. Analysis decrease illustrations A red bar graph showing a significant decline in values over time with a downward trend arrow. The image depicts a red bar graph on a transparent background with a downward trend, indicating a decrease in values. The graph features a series of red bars of varying heights, with a red arrow pointing downwards to emphasize the decline
Free with trial A bar graph depicting a downward trend with a red arrow overlay, indicating a substantial decrease. Analysis decrease illustrations Graph showing a significant decline in values over time with a red arrow pointing downwards. A bar graph depicting a downward trend with a red arrow overlay, indicating a substantial decrease
Free with trial Financial market analysis document with diamond icon, representing a stock investment value increasing or decreasing. Analysis decrease illustrations Diamond value stock market investment report with percentage sign. Financial market analysis document with diamond icon, representing a stock investment value increasing or decreasing
Free with trial Isolated showing simple line graph showing a downward trend on white background keywords: graph, chart, line, trend, data, decline, decrease. Analysis decrease illustrations Simple line graph showing a downward trend on white background Keywords: graph, chart, line, trend, data, decline
Free with trial Magnifying glass focuses on a blue bar graph with a visible downward trend line, set against a dark, blurred financial backdrop. Bars decrease in height from left to right, emphasizing a decline. The atmosphere is enhanced by subtle ambient reflections and lighting that highlight the graph's detail, symbolizing analysis of negative financial or economic trends. Analysis decrease illustrations Magnifying glass focused on a declining bar graph with a downward trend line on a dark background. Magnifying glass focuses on a blue bar graph with a visible downward trend line, set against a dark, blurred financial backdrop. Bars decrease in height from left to right, emphasizing a decline. The atmosphere is enhanced by subtle ambient reflections and lighting that highlight the graph's detail, symbolizing analysis of negative financial or economic trends.
Free with trial A 3D illustration depicts a bar chart with bars of varying colors (blue, grey, yellow) showing a downward trend. Above the chart, a red triangular warning sign with a white exclamation mark signifies an alert or danger. The composition is set against a soft pink background, conveying a message of financial or business decline and risk. Analysis decrease illustrations 3D Bar Chart Showing Decline with a Red Exclamation Mark Warning Sign Above graph decrease. A 3D illustration depicts a bar chart with bars of varying colors (blue, grey, yellow) showing a downward trend. Above the chart, a red triangular warning sign with a white exclamation mark signifies an alert or danger. The composition is set against a soft pink background, conveying a message of financial or business decline and risk
Free with trial Negative red line graph chart going down from left to right. Medicine concept, cardiogram on medical monitor. Stock market analysis, business crisis, investment fall, economic recession budget. Analysis decrease illustrations Negative red line graph chart going down from left to right. Medicine concept, cardiogram on medical monitor. Stock market
Free with trial A visual representation of deflation, showing a decrease in the general pricing and economic activity , high resolution. Analysis decrease illustrations Economic Downturn. Deflation concept. A visual representation of deflation, showing a decrease in the general pricing and economic activity , high resolution
Free with trial Green line graph on a pink background with a downward arrow. Business trend showing decline and fall. Financial analysis and performance concept. Analysis decrease illustrations Green line graph on a pink background with a downward arrow. Business trend showing decline and fall
Free with trial This image features a bar chart with orange bars representing performance metrics that steadily decrease over time, accompanied by a downward-sloping line graph that tracks the same trend against a blurred office background. Analysis decrease illustrations A bar chart showing a steady decline in performance metrics over a series of sequential periods. This image features a bar chart with orange bars representing performance metrics that steadily decrease over time, accompanied by a downward-sloping line graph that tracks the same trend against a blurred office background
Free with trial The image displays a 3D bar chart comparing performance metrics between two distinct time periods labeled as 'Time Period 1' and 'Time Period 2'. The chart shows a significant decline in the metrics from Time Period 1 to Time Period 2, with an initial high value in Time Period 1 that progressively reduces across the categories. The bars are color-coded, with Time Period 1 having taller bars in. Analysis decrease illustrations Comparison of performance metrics between two different time periods for project analysis. The image displays a 3D bar chart comparing performance metrics between two distinct time periods labeled as 'Time Period 1' and 'Time Period 2'. The chart shows a significant decline in the metrics from Time Period 1 to Time Period 2, with an initial high value in Time Period 1 that progressively reduces across the categories. The bars are color-coded, with Time Period 1 having taller bars in
Free with trial The image depicts a bar graph with blue bars that increase in height initially, then gradually decrease, symbolizing growth followed by decline. An upward-pointing arrow overlays the graph, indicating an overall upward trend or potential future growth despite the current decline in the bars' heights. This visual is often used in business, finance, and analytics to illustrate performance trends. Analysis decrease illustrations Growth trend represented by increasing and then decreasing blue bar graph with upward arrow. The image depicts a bar graph with blue bars that increase in height initially, then gradually decrease, symbolizing growth followed by decline. An upward-pointing arrow overlays the graph, indicating an overall upward trend or potential future growth despite the current decline in the bars' heights. This visual is often used in business, finance, and analytics to illustrate performance trends
Free with trial The image shows two arrows, one red with a downward direction and a percentage symbol indicating a decrease, and another green with an upward direction and a percentage symbol indicating an increase. These visuals are commonly used to represent opposing trends, such as declines and rises in data like stock prices, economic indicators, or performance metrics. Analysis decrease illustrations Opposing trends represented by percentage change indicators with upward and downward arrows. The image shows two arrows, one red with a downward direction and a percentage symbol indicating a decrease, and another green with an upward direction and a percentage symbol indicating an increase. These visuals are commonly used to represent opposing trends, such as declines and rises in data like stock prices, economic indicators, or performance metrics
Free with trial A set of nine minimalist vector icons depicting various types of charts and graphs including bar charts, progress bars, and trend lines for data visualization and analytics. Analysis decrease vectors Collection of simple black glyph icons representing business charts graphs and data analysis. A set of nine minimalist vector icons depicting various types of charts and graphs including bar charts, progress bars, and trend lines for data visualization and analytics
Free with trial A 3D rendered red arrow points downward across a white grid background with blue bar graph elements. The bars decrease in height from left to right, indicating a downward trend. Analysis decrease illustrations Red arrow graph chart showing decline on white grid background with blue bars downward trend. A 3D rendered red arrow points downward across a white grid background with blue bar graph elements. The bars decrease in height from left to right, indicating a downward trend
Free with trial Clean vector icon illustrating a declining line graph with push pins, symbolizing data analysis. Analysis decrease illustrations Line graph decline chart icon. Clean vector icon illustrating a declining line graph with push pins, symbolizing data analysis
Free with trial The image shows a three-dimensional bar chart with alternating red and green bars, each varying in height. The bars are arranged on a green circular base, suggesting a comparison of data points, possibly financial metrics like stock prices, market performance, or growth analysis. The red bars indicate a decline or negative value, while the green bars suggest an increase or positive value. Analysis decrease illustrations Colorful 3d bar chart illustration depicting financial market trends or growth metrics. The image shows a three-dimensional bar chart with alternating red and green bars, each varying in height. The bars are arranged on a green circular base, suggesting a comparison of data points, possibly financial metrics like stock prices, market performance, or growth analysis. The red bars indicate a decline or negative value, while the green bars suggest an increase or positive value
Free with trial This is a minimalist, high-contrast black icon depicting a bar chart with an overlaying arrow pointing downwards, symbolizing a decline, recession, loss, or negative financial performance. Analysis decrease vectors A black and white icon representing a downward trend in a financial bar chart or business analysis. This is a minimalist, high-contrast black icon depicting a bar chart with an overlaying arrow pointing downwards, symbolizing a decline, recession, loss, or negative financial performance
Free with trial Downward glowing arrow over planet earth. Concept showing global economic crisis or financial downturn. Digital data visualization for business analysis. Analysis decrease illustrations Downward glowing arrow over planet earth. Concept showing global economic crisis or financial downturn
Free with trial The image shows a 3D bar graph with blue bars of varying heights. Two large red arrows cross over the graph: one pointing upward to the right, symbolizing growth or increase, and the other pointing downward to the right, symbolizing decline or decrease. This visual metaphor emphasizes conflicting trends or mixed signals in data. Analysis decrease illustrations Contradictory growth and decline indicators represented by a bar graph with crossed arrows. The image shows a 3D bar graph with blue bars of varying heights. Two large red arrows cross over the graph: one pointing upward to the right, symbolizing growth or increase, and the other pointing downward to the right, symbolizing decline or decrease. This visual metaphor emphasizes conflicting trends or mixed signals in data
Free with trial Abstract illustration of financial crisis, economic downturn. Falling red forex chart on grid. Concept of market crash, stock exchange rate decrease, bankrupt business falling price. Analysis decrease illustrations Abstract illustration of financial crisis, economic downturn. Falling red forex chart on grid. Concept of market crash, stock
Free with trial A close-up of a stock market graph displayed on a screen, illustrating a substantial decrease in value, highlighted by a prominent red arrow pointing downwards, indicating a sharp decline in the market. Analysis decrease illustrations Stock market graph showing a significant downward trend with a large red arrow indicating decline. A close-up of a stock market graph displayed on a screen, illustrating a substantial decrease in value, highlighted by a prominent red arrow pointing downwards, indicating a sharp decline in the market
Free with trial This image depicts a canvas with an easel showing a bar and line graph combination illustrating a downward trend. The bars start high and gradually decline, while the line graph also trends downward, indicating a decrease in values. Such visuals are often used in business to represent declining sales, market performance, or economic downturns over time. Analysis decrease illustrations Visual Representation Of Declining Trends In Business Performance And Market Analysis. This image depicts a canvas with an easel showing a bar and line graph combination illustrating a downward trend. The bars start high and gradually decline, while the line graph also trends downward, indicating a decrease in values. Such visuals are often used in business to represent declining sales, market performance, or economic downturns over time
Free with trial A hand in a suit holds a magnifying glass over a financial graph showing a downward trend. The graph blue and white bars and a black line indicating a decline in values. The magnifying glass highlights the graph's data points, emphasizing analysis and cost reduction. The background is a dark blue gradient, and the overall style is a clean, flat. Analysis decrease illustrations Hand holding magnifying glass over downward trending financial graph with cost reduction concept. A hand in a suit holds a magnifying glass over a financial graph showing a downward trend. The graph blue and white bars and a black line indicating a decline in values. The magnifying glass highlights the graph's data points, emphasizing analysis and cost reduction. The background is a dark blue gradient, and the overall style is a clean, flat
Free with trial This image features a series of black oil barrels in the foreground with the word oil clearly displayed on their ends, set against a dark background featuring a downward-trending bar chart and a sharp red arrow indicating a major decrease in value or production, symbolizing an economic crisis or market downturn in the petroleum energy sector. Analysis decrease illustrations A visual representation of the significant decline in global oil prices and market demand trends. This image features a series of black oil barrels in the foreground with the word oil clearly displayed on their ends, set against a dark background featuring a downward-trending bar chart and a sharp red arrow indicating a major decrease in value or production, symbolizing an economic crisis or market downturn in the petroleum energy sector
Free with trial Vibrant abstract visualization of a trendline against a gradient background, ideal for business reports, financial analysis, and creative projects. Analysis decrease illustrations Abstract Data Visualization of a Trendline with Blue and Pink Background for Business Use. Vibrant abstract visualization of a trendline against a gradient background, ideal for business reports, financial analysis, and creative projects
Free with trial Bar graph descends on blue background 3d render. Visualizes negative trend, economic downfall, failure, crisis, statistics, market analysis, budget deficit, bankruptcy. Perfect for marketing finance. Analysis decrease illustrations Bar graph descends on blue background 3d render. Visualizes negative trend, economic downfall, failure, crisis, statistics, market
Free with trial The image depicts a downward trend using a combination of bar and line chart elements. The yellow bars gradually decrease in height from left to right, indicating a consistent decline. A red line overlays the bars, further emphasizing the downward trajectory, ending with a large red arrow pointing downwards to signify a significant drop. This visual representation is often used to show reductions. Analysis decrease illustrations Declining trend illustrated through bar and line chart visualization isolated on white background. The image depicts a downward trend using a combination of bar and line chart elements. The yellow bars gradually decrease in height from left to right, indicating a consistent decline. A red line overlays the bars, further emphasizing the downward trajectory, ending with a large red arrow pointing downwards to signify a significant drop. This visual representation is often used to show reductions
Free with trial Illustration of dynamic stock market chart with red fluctuations in dark trading environment. Economic financial volatility, digital data analysis, business concept. Charts reflect. Analysis decrease illustrations Illustration of dynamic stock market chart with red fluctuations in dark trading environment. Economic financial volatility
Free with trial White robot kneeling and examining a stack of plates forming a descending graph on a green background, representing economic decline or market analysis in a futuristic and conceptual way. Analysis decrease illustrations Robotic figure analyzing stacked plates forming descending graph pattern, symbolizing economic downturn against green. White robot kneeling and examining a stack of plates forming a descending graph on a green background, representing economic decline or market analysis in a futuristic and conceptual way
Free with trial Financial difficulties, decrease in value of business or company shares, stock market crash, economic crisis, business failure, loss of cash, lose investments, a man is shackled in crisis. Analysis decrease vectors Man is shackled in crisis
Free with trial A stylized icon depicting a global economic downturn with a gradient color scheme, set against a black background in a flat design. Analysis decrease vectors Global economic downturn icon with gradient design representing financial market decrease and loss. A stylized icon depicting a global economic downturn with a gradient color scheme, set against a black background in a flat design.
Free with trial This image depicts various financial concepts using graphical icons on mobile devices. It includes illustrations of rising and falling trends, balanced scales, growth, and investment themes, possibly representing market analysis, stock performance, investment growth, and financial balance. Analysis decrease illustrations Financial trends and investment concepts illustrated with modern icons isolated on white background. This image depicts various financial concepts using graphical icons on mobile devices. It includes illustrations of rising and falling trends, balanced scales, growth, and investment themes, possibly representing market analysis, stock performance, investment growth, and financial balance
Free with trial A collection of colorful isometric bar charts and line graphs are displayed on a white background, representing data visualization and analysis. Analysis decrease illustrations Isometric colorful bar charts and line graphs displayed on a white background for data visualization. a collection of colorful isometric bar charts and line graphs are displayed on a white background, representing data visualization and analysis
Free with trial A magnifying glass hovers over a grid paper background displaying two line graphs, one red and one blue. The red graph a general upward trend with several peaks and valleys, while the blue graph a downward trend. The magnifying glass focuses on a prominent red upward arrow within the red graph, highlighting an increase. Analysis decrease illustrations Magnifying glass over red and blue upward and downward trending graphs on grid paper chart data analysis. A magnifying glass hovers over a grid paper background displaying two line graphs, one red and one blue. The red graph a general upward trend with several peaks and valleys, while the blue graph a downward trend. The magnifying glass focuses on a prominent red upward arrow within the red graph, highlighting an increase
Free with trial A high-tech visualization of financial data, showing a glowing blue bar chart and line graphs representing stock market trends, business analytics, and economic growth. Analysis decrease illustrations Futuristic digital stock market chart with glowing blue graphs and data analysis on a dark background. A high-tech visualization of financial data, showing a glowing blue bar chart and line graphs representing stock market trends, business analytics, and economic growth
Free with trial Vibrant financial chart with colorful bars stands out against a soft focus background of city lights, embodying modern analytics and market trends. Analysis decrease illustrations Abstract Financial Analysis with Colorful Chart Bars Overlaid on Blurred City Lights in Night Setting. Vibrant financial chart with colorful bars stands out against a soft focus background of city lights, embodying modern analytics and market trends
Free with trial This image depicts a simple yet effective graphic representation of contrasting trends, featuring a green up arrow and a red down arrow accompanied by percentage signs. The visual metaphor is commonly used in financial and economic contexts to illustrate growth and decline, making it a versatile and recognizable symbol in business and market analysis. Analysis decrease illustrations A graphic illustration of a green up arrow and a red down arrow with percentage signs, symbolizing growth and decline. This image depicts a simple yet effective graphic representation of contrasting trends, featuring a green up arrow and a red down arrow accompanied by percentage signs. The visual metaphor is commonly used in financial and economic contexts to illustrate growth and decline, making it a versatile and recognizable symbol in business and market analysis.