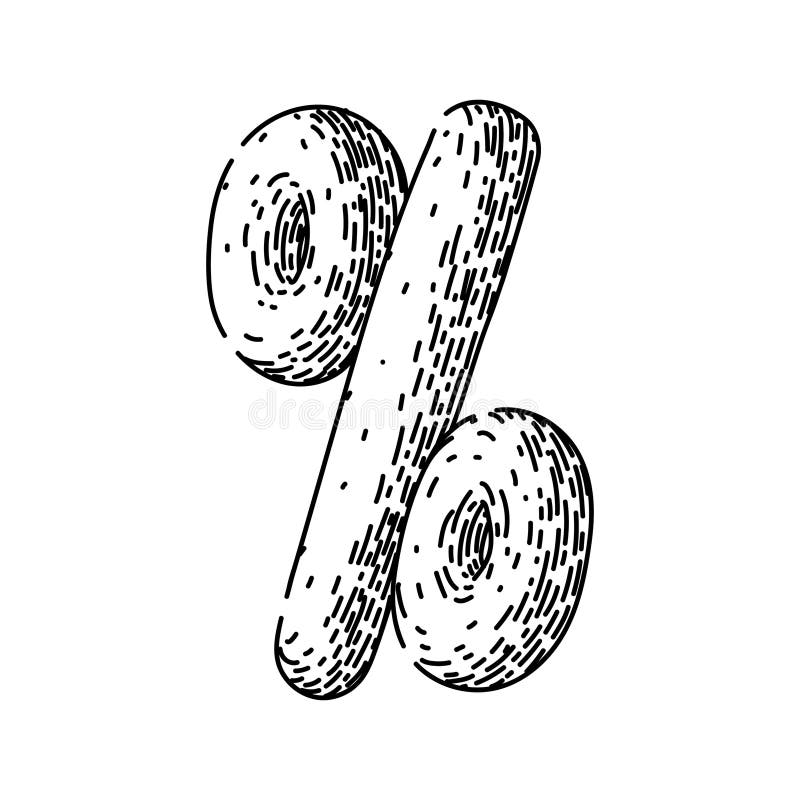
Free with trial Calculation percentage sign hand drawn. finance statistics, increase decrease, ratio proportion calculation percentage sign vector sketch. isolated black illustration. Analysis decrease illustrations Calculation percentage sign sketch hand drawn vector. calculation percentage sign hand drawn. finance statistics, increase decrease, ratio proportion calculation percentage sign vector sketch. isolated black illustration
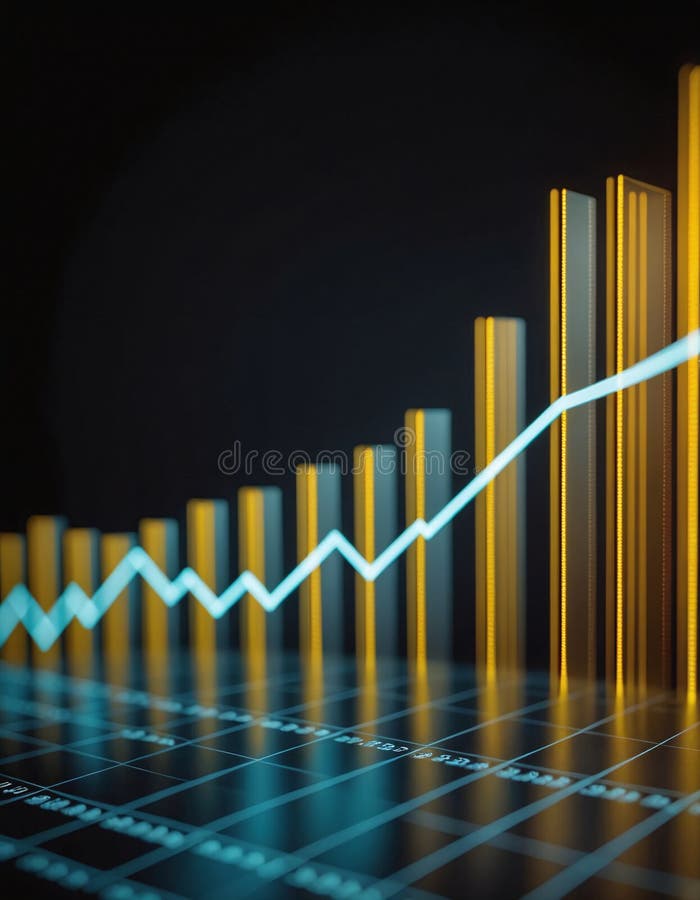
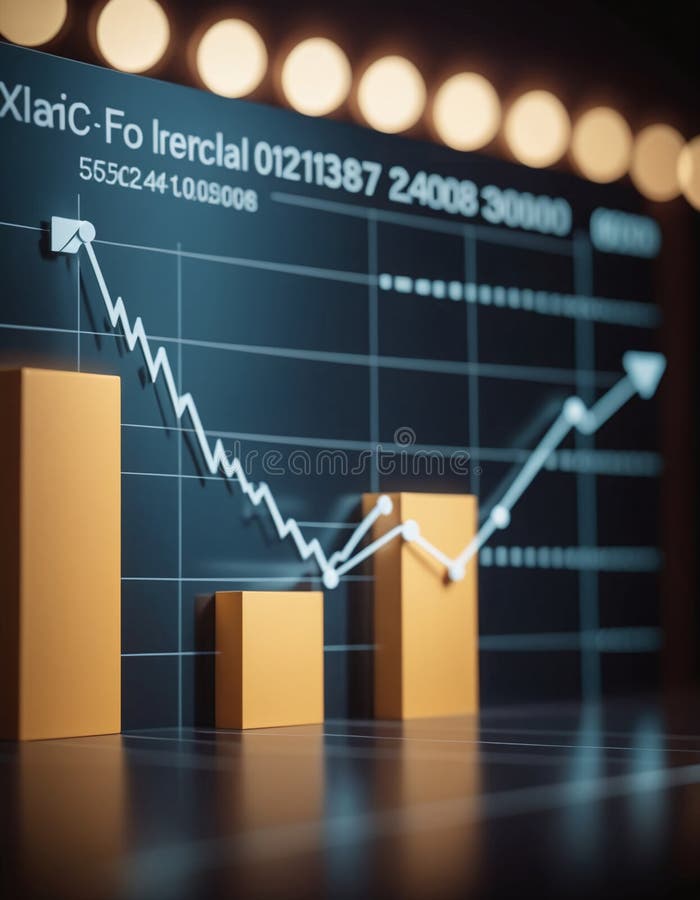
Free with trial Graph or block diagram shows the increase or decrease of shares, which means financial loss or gain -. Analysis decrease illustrations Graph or block diagram shows the increase or decrease of shares, which means financial loss or gain
Free with trial Graph or block diagram shows the increase or decrease of shares, which means financial loss or gain -. Analysis decrease illustrations Graph or block diagram shows the increase or decrease of shares, which means financial loss or gain
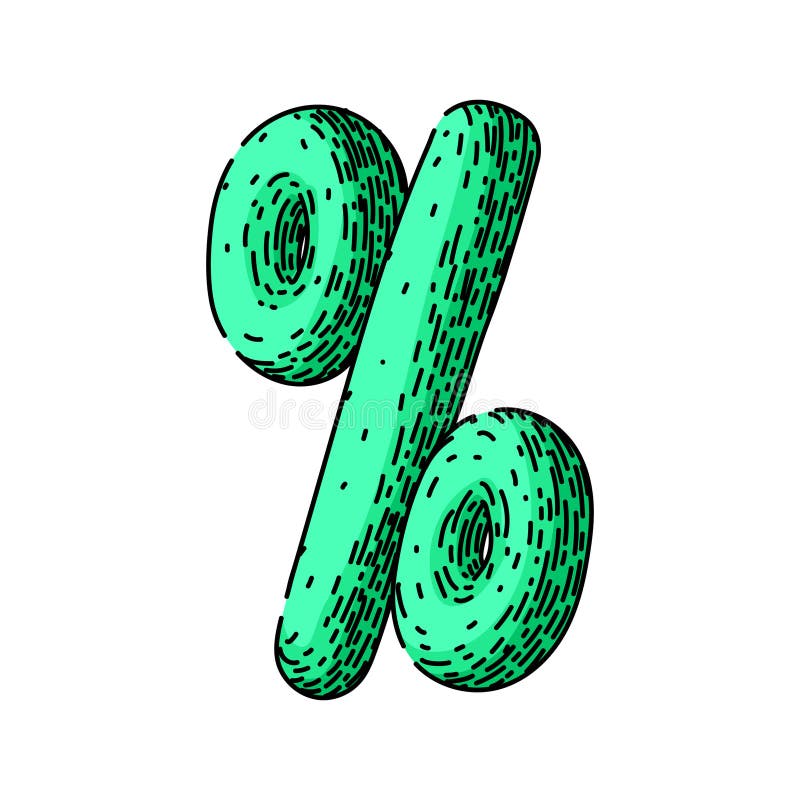
Free with trial Calculation percentage sign hand drawn. finance statistics, increase decrease, ratio proportion calculation percentage sign vector sketch. isolated color illustration. Analysis decrease illustrations Calculation percentage sign sketch hand drawn vector. calculation percentage sign hand drawn. finance statistics, increase decrease, ratio proportion calculation percentage sign vector sketch. isolated color illustration
Free with trial Finance economy crisis, financial decrease, rate business fall, money failure, inflation or devaluation, investment loss. Generative Ai. Analysis decrease illustrations Finance economy crisis, financial decrease, rate business fall, money failure, inflation or devaluation, investment loss
Free with trial Finance economy crisis, financial decrease, rate business fall, money failure, inflation or devaluation, investment loss. Generative Ai. Analysis decrease illustrations Finance economy crisis, financial decrease, rate business fall, money failure, inflation or devaluation, investment loss
Free with trial Finance economy crisis, financial decrease, rate business fall, money failure, inflation or devaluation, investment loss. Generative Ai. Analysis decrease illustrations Finance economy crisis, financial decrease, rate business fall, money failure, inflation or devaluation, investment loss
Free with trial Finance economy crisis, financial decrease, rate business fall, money failure, inflation or devaluation, investment loss. Generative Ai. Analysis decrease illustrations Finance economy crisis, financial decrease, rate business fall, money failure, inflation or devaluation, investment loss
Free with trial Finance economy crisis, financial decrease, rate business fall, money failure, inflation or devaluation, investment loss. Generative Ai. Analysis decrease illustrations Finance economy crisis, financial decrease, rate business fall, money failure, inflation or devaluation, investment loss
Free with trial Finance economy crisis, financial decrease, rate business fall, money failure, inflation or devaluation, investment loss. Generative Ai. Analysis decrease illustrations Finance economy crisis, financial decrease, rate business fall, money failure, inflation or devaluation, investment loss
Free with trial Finance economy crisis, financial decrease, rate business fall, money failure, inflation or devaluation, investment loss. Generative Ai. Analysis decrease illustrations Finance economy crisis, financial decrease, rate business fall, money failure, inflation or devaluation, investment loss
Free with trial Finance economy crisis, financial decrease, rate business fall, money failure, inflation or devaluation, investment loss. Generative Ai. Analysis decrease illustrations Finance economy crisis, financial decrease, rate business fall, money failure, inflation or devaluation, investment loss
Free with trial Finance economy crisis, financial decrease, rate business fall, money failure, inflation or devaluation, investment loss. Generative Ai. Analysis decrease illustrations Finance economy crisis, financial decrease, rate business fall, money failure, inflation or devaluation, investment loss
Free with trial Finance economy crisis, financial decrease, rate business fall, money failure, inflation or devaluation, investment loss. Generative Ai. Analysis decrease illustrations Finance economy crisis, financial decrease, rate business fall, money failure, inflation or devaluation, investment loss
Free with trial Finance economy crisis, financial decrease, rate business fall, money failure, inflation or devaluation, investment loss. Generative Ai. Analysis decrease illustrations Finance economy crisis, financial decrease, rate business fall, money failure, inflation or devaluation, investment loss
Free with trial Finance economy crisis, financial decrease, rate business fall, money failure, inflation or devaluation, investment loss. Generative Ai. Analysis decrease illustrations Finance economy crisis, financial decrease, rate business fall, money failure, inflation or devaluation, investment loss
Free with trial Finance economy crisis, financial decrease, rate business fall, money failure, inflation or devaluation, investment loss. Generative Ai. Analysis decrease illustrations Finance economy crisis, financial decrease, rate business fall, money failure, inflation or devaluation, investment loss
Free with trial Finance economy crisis, financial decrease, rate business fall, money failure, inflation or devaluation, investment loss. Generative Ai. Analysis decrease illustrations Finance economy crisis, financial decrease, rate business fall, money failure, inflation or devaluation, investment loss
Free with trial 3D rendered graph showing decreasing stock prices against a circuit board background. Illustrates market downturn in technology sector. Analysis decrease illustrations Market Trend Analysis: 3D Render of Decreasing Stock Prices and Circuit Board Background Illustrating Technological Market. 3D rendered graph showing decreasing stock prices against a circuit board background. Illustrates market downturn in technology sector
Free with trial Magnifying glass is focusing on a dollar sign as an arrow points down indicating a decrease in money or value. Analysis decrease vectors Magnifying glass showing dollar sign with downward arrow indicating economic downturn. Magnifying glass is focusing on a dollar sign as an arrow points down indicating a decrease in money or value
Free with trial Businessman analyzes financial data on digital tablet. Graphs, charts display performance, cost reduction. Modern business strategy project management concepts in focus. Data analysis. Analysis decrease illustrations Businessman analyzes financial data on digital tablet. Graphs, charts display performance, cost reduction. Modern business
Free with trial Magnifying glass focuses on downward trend in financial spreadsheet during recession. Spreadsheet data shows, significant decline. Economic downturn evident. Detailed financial analysis. Analysis decrease illustrations Magnifying glass focuses on downward trend in financial spreadsheet during recession. Spreadsheet data shows significant decline. Magnifying glass focuses on downward trend in financial spreadsheet during recession. Spreadsheet data shows, significant decline. Economic downturn evident. Detailed financial analysis.
Free with trial This graphic illustrates stable bank withdrawals alongside a rising financial trend with coins and bars, Bank withdrawals are currently stable and not showing any significant increase or decrease. Analysis decrease vectors This graphic illustrates stable bank withdrawals alongside a rising financial trend with coins and bars, Bank withdrawals are
Free with trial Financial decline highlighted by magnifying glass over spreadsheet. Red arrow chart trend downward on document during recession. Analysis of negative market indicator, with business. Analysis decrease illustrations Financial decline highlighted by magnifying glass over spreadsheet. Red arrow chart trend downward on document during recession.
Free with trial Anxious Trader Female Character Panics As Ethereum Cryptocurrency Price Decrease, Fearing Financial Loss And Uncertainty In Market, Exacerbating The Downward Trend. Cartoon People Vector Illustration. Analysis decrease vectors Anxious Trader Female Character Panics As Cryptocurrency Prices Decrease, Fearing Financial Loss And Uncertainty. Anxious Trader Female Character Panics As Ethereum Cryptocurrency Price Decrease, Fearing Financial Loss And Uncertainty In Market, Exacerbating The Downward Trend. Cartoon People Vector Illustration
Free with trial A close-up of a magnifying glass focusing on vibrant financial charts, illustrating trends and market analysis, Generative AI. Analysis decrease illustrations Magnifying glass over a falling interest rate chart, detailed analysis of economic trends. A close-up of a magnifying glass focusing on vibrant financial charts, illustrating trends and market analysis, Generative AI.
Free with trial Reduction chart icon Vector symbol or sign set collection in black and white outline. Analysis decrease vectors Decline Chart Icon Illustrating Decrease in Performance, Economic Downturn, and Analytical Data. Reduction chart icon Vector symbol or sign set collection in black and white outline
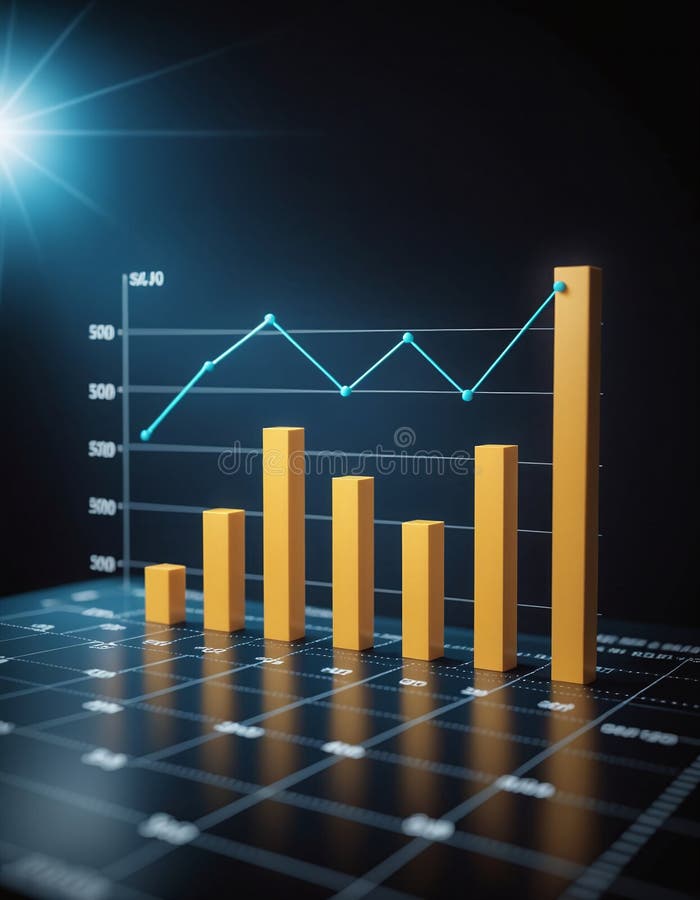
Free with trial Graph or block diagram shows the increase or decrease of shares, which means financial loss or gain -. Analysis decrease illustrations Graph or block diagram shows the increase or decrease of shares, which means financial loss or gain
Free with trial Declining bar graph with trend line symbolizing financial loss or business decrease. Analysis decrease illustrations Declining Bar Chart with Downward Trend Line Illustration. Declining bar graph with trend line symbolizing financial loss or business decrease. Declining bar graph with trend line symbolizing financial loss or business decrease.
Free with trial 3D render icon Line graph tracking energy consumption with a playful narrative icon 3d analysis. Generative AI. Analysis decrease illustrations 3D render icon Line graph tracking energy consumption with a playful narrative icon 3d analysis
Free with trial 3D render icon Line graph tracking energy consumption with a playful narrative icon 3d analysis. Generative AI. Analysis decrease illustrations 3D render icon Line graph tracking energy consumption with a playful narrative icon 3d analysis
Free with trial 3D render icon Line graph tracking energy consumption with a playful narrative icon 3d analysis. Generative AI. Analysis decrease illustrations 3D render icon Line graph tracking energy consumption with a playful narrative icon 3d analysis
Free with trial 3D render icon Line graph tracking energy consumption with a playful narrative icon 3d analysis. Generative AI. Analysis decrease illustrations 3D render icon Line graph tracking energy consumption with a playful narrative icon 3d analysis
Free with trial 3D render icon Line graph tracking energy consumption with a playful narrative icon 3d analysis. Generative AI. Analysis decrease illustrations 3D render icon Line graph tracking energy consumption with a playful narrative icon 3d analysis
Free with trial A simple line chart illustrates a decreasing trend with distinct dot markers representing data points. The design emphasizes the shift in values over time and aids in visualizing performance. Analysis decrease vectors Chart Displaying a Downward Trend in Data Analysis. A simple line chart illustrates a decreasing trend with distinct dot markers representing data points. The design emphasizes the shift in values over time and aids in visualizing performance.
Free with trial A polygon bull charges forward against a backdrop of a stock market chart symbolizing finance This image can be used for financial promotions and market analysis. Analysis decrease illustrations Bull Market Concept with Polygon Bull and Stock Market Chart. A polygon bull charges forward against a backdrop of a stock market chart symbolizing finance This image can be used for financial promotions and market analysis
Free with trial Unsuccessful investments cause negative emotions in woman standing among declining charts. Girl had bad luck and lost income or investments due to crisis and lack of financial analysis. Analysis decrease vectors Unsuccessful investments cause negative emotions in woman standing among declining charts
Free with trial Open laptop displaying colorful bar graphs and data analysis on screen, representing growth and business analytics ,Generative AI. Analysis decrease illustrations Open laptop displaying colorful bar graphs and data analysis on screen, representing growth and business analytics
Free with trial Reduce labor costs icon vector logo set collection for web app ui. Analysis decrease vectors Reduce labor costs icon. reduction in worker pay salary or wage income set. loss or decrease in employee payment in dollar symbol. Reduce labor costs icon vector logo set collection for web app ui
Free with trial Statistics and analysis concept with bottom view on graphs and stats indicators on dark squared background. 3D rendering. Analysis decrease illustrations Statistics and analysis concept
Free with trial Graph or block diagram shows the increase or decrease of shares, which means financial loss or gain -. Analysis decrease illustrations Graph or block diagram shows the increase or decrease of shares, which means financial loss or gain
Free with trial Graph or block diagram shows the increase or decrease of shares, which means financial loss or gain -. Analysis decrease illustrations Graph or block diagram shows the increase or decrease of shares, which means financial loss or gain
Free with trial Graph or block diagram shows the increase or decrease of shares, which means financial loss or gain -. Analysis decrease illustrations Graph or block diagram shows the increase or decrease of shares, which means financial loss or gain
Free with trial Graph or block diagram shows the increase or decrease of shares, which means financial loss or gain -. Analysis decrease illustrations Graph or block diagram shows the increase or decrease of shares, which means financial loss or gain
Free with trial Graph or block diagram shows the increase or decrease of shares, which means financial loss or gain -. Analysis decrease illustrations Graph or block diagram shows the increase or decrease of shares, which means financial loss or gain
Free with trial Graph or block diagram shows the increase or decrease of shares, which means financial loss or gain -. Analysis decrease illustrations Graph or block diagram shows the increase or decrease of shares, which means financial loss or gain
Free with trial Graph or block diagram shows the increase or decrease of shares, which means financial loss or gain -. Analysis decrease illustrations Graph or block diagram shows the increase or decrease of shares, which means financial loss or gain
Free with trial Graph or block diagram shows the increase or decrease of shares, which means financial loss or gain -. Analysis decrease illustrations Graph or block diagram shows the increase or decrease of shares, which means financial loss or gain
Free with trial Graph or block diagram shows the increase or decrease of shares, which means financial loss or gain -. Analysis decrease illustrations Graph or block diagram shows the increase or decrease of shares, which means financial loss or gain
Free with trial Graph or block diagram shows the increase or decrease of shares, which means financial loss or gain -. Analysis decrease illustrations Graph or block diagram shows the increase or decrease of shares, which means financial loss or gain
Free with trial Graph or block diagram shows the increase or decrease of shares, which means financial loss or gain -. Analysis decrease illustrations Graph or block diagram shows the increase or decrease of shares, which means financial loss or gain
Free with trial Graph or block diagram shows the increase or decrease of shares, which means financial loss or gain -. Analysis decrease illustrations Graph or block diagram shows the increase or decrease of shares, which means financial loss or gain
Free with trial Graph or block diagram shows the increase or decrease of shares, which means financial loss or gain -. Analysis decrease illustrations Graph or block diagram shows the increase or decrease of shares, which means financial loss or gain
Free with trial Graph or block diagram shows the increase or decrease of shares, which means financial loss or gain -. Analysis decrease illustrations Graph or block diagram shows the increase or decrease of shares, which means financial loss or gain
Free with trial Graph or block diagram shows the increase or decrease of shares, which means financial loss or gain -. Analysis decrease illustrations Graph or block diagram shows the increase or decrease of shares, which means financial loss or gain
Free with trial Graph or block diagram shows the increase or decrease of shares, which means financial loss or gain -. Analysis decrease illustrations Graph or block diagram shows the increase or decrease of shares, which means financial loss or gain
Free with trial Graph or block diagram shows the increase or decrease of shares, which means financial loss or gain -. Analysis decrease illustrations Graph or block diagram shows the increase or decrease of shares, which means financial loss or gain
Free with trial Graph or block diagram shows the increase or decrease of shares, which means financial loss or gain -. Analysis decrease illustrations Graph or block diagram shows the increase or decrease of shares, which means financial loss or gain
Free with trial Graph or block diagram shows the increase or decrease of shares, which means financial loss or gain -. Analysis decrease illustrations Graph or block diagram shows the increase or decrease of shares, which means financial loss or gain
Free with trial Graph or block diagram shows the increase or decrease of shares, which means financial loss or gain -. Analysis decrease illustrations Graph or block diagram shows the increase or decrease of shares, which means financial loss or gain
Free with trial Graph or block diagram shows the increase or decrease of shares, which means financial loss or gain -. Analysis decrease illustrations Graph or block diagram shows the increase or decrease of shares, which means financial loss or gain
Free with trial Graph or block diagram shows the increase or decrease of shares, which means financial loss or gain -. Analysis decrease illustrations Graph or block diagram shows the increase or decrease of shares, which means financial loss or gain
Free with trial Graph or block diagram shows the increase or decrease of shares, which means financial loss or gain -. Analysis decrease illustrations Graph or block diagram shows the increase or decrease of shares, which means financial loss or gain
Free with trial Graph or block diagram shows the increase or decrease of shares, which means financial loss or gain -. Analysis decrease illustrations Graph or block diagram shows the increase or decrease of shares, which means financial loss or gain
Free with trial Graph or block diagram shows the increase or decrease of shares, which means financial loss or gain -. Analysis decrease illustrations Graph or block diagram shows the increase or decrease of shares, which means financial loss or gain
Free with trial Graph or block diagram shows the increase or decrease of shares, which means financial loss or gain -. Analysis decrease illustrations Graph or block diagram shows the increase or decrease of shares, which means financial loss or gain
Free with trial Graph or block diagram shows the increase or decrease of shares, which means financial loss or gain -. Analysis decrease illustrations Graph or block diagram shows the increase or decrease of shares, which means financial loss or gain
Free with trial Graph or block diagram shows the increase or decrease of shares, which means financial loss or gain -. Analysis decrease illustrations Graph or block diagram shows the increase or decrease of shares, which means financial loss or gain
Free with trial Graph or block diagram shows the increase or decrease of shares, which means financial loss or gain -. Analysis decrease illustrations Graph or block diagram shows the increase or decrease of shares, which means financial loss or gain
Free with trial Graph or block diagram shows the increase or decrease of shares, which means financial loss or gain -. Analysis decrease illustrations Graph or block diagram shows the increase or decrease of shares, which means financial loss or gain
Free with trial Graph or block diagram shows the increase or decrease of shares, which means financial loss or gain -. Analysis decrease illustrations Graph or block diagram shows the increase or decrease of shares, which means financial loss or gain
Free with trial Graph or block diagram shows the increase or decrease of shares, which means financial loss or gain -. Analysis decrease illustrations Graph or block diagram shows the increase or decrease of shares, which means financial loss or gain
Free with trial Graph or block diagram shows the increase or decrease of shares, which means financial loss or gain -. Analysis decrease illustrations Graph or block diagram shows the increase or decrease of shares, which means financial loss or gain
Free with trial Graph or block diagram shows the increase or decrease of shares, which means financial loss or gain -. Analysis decrease illustrations Graph or block diagram shows the increase or decrease of shares, which means financial loss or gain
Free with trial Graph or block diagram shows the increase or decrease of shares, which means financial loss or gain -. Analysis decrease illustrations Graph or block diagram shows the increase or decrease of shares, which means financial loss or gain
Free with trial Graph or block diagram shows the increase or decrease of shares, which means financial loss or gain -. Analysis decrease illustrations Graph or block diagram shows the increase or decrease of shares, which means financial loss or gain
Free with trial Graph or block diagram shows the increase or decrease of shares, which means financial loss or gain -. Analysis decrease illustrations Graph or block diagram shows the increase or decrease of shares, which means financial loss or gain
Free with trial Graph or block diagram shows the increase or decrease of shares, which means financial loss or gain -. Analysis decrease illustrations Graph or block diagram shows the increase or decrease of shares, which means financial loss or gain
Free with trial Graph or block diagram shows the increase or decrease of shares, which means financial loss or gain -. Analysis decrease illustrations Graph or block diagram shows the increase or decrease of shares, which means financial loss or gain
Free with trial Graph or block diagram shows the increase or decrease of shares, which means financial loss or gain -. Analysis decrease illustrations Graph or block diagram shows the increase or decrease of shares, which means financial loss or gain