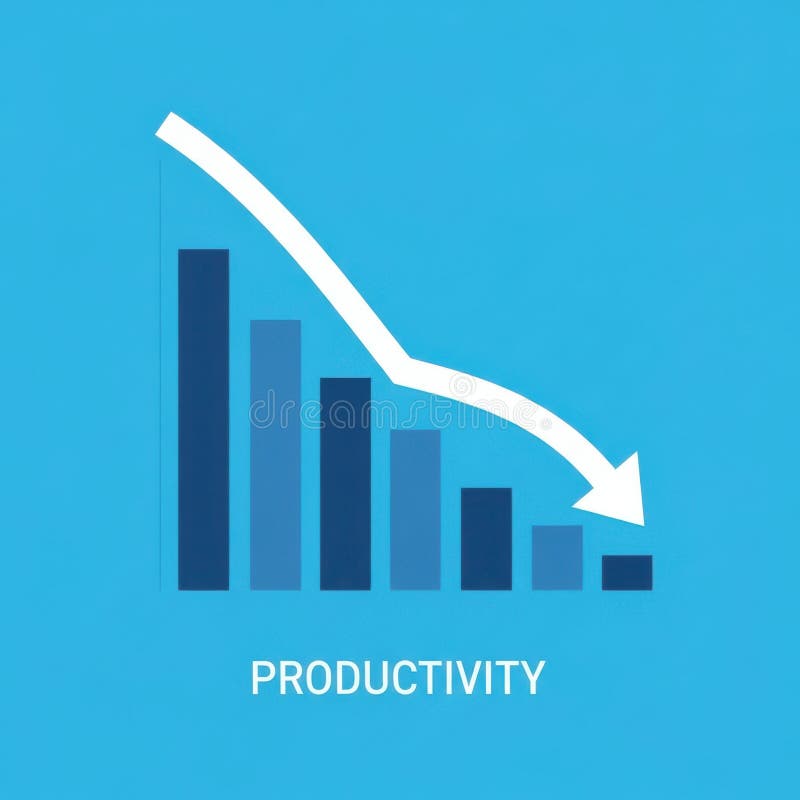
Free with trial A bar graph visually represents a downward trend in productivity over time, indicating a decline in efficiency or output. Analysis decrease illustrations Decreasing Productivity Graph Showing Decline. A bar graph visually represents a downward trend in productivity over time, indicating a decline in efficiency or output
Free with trial Displaying purple world map with rising red bars, red line graph on slide with green grid. Infographic, analytics, digital, technology, finance, strategic, modern. Analysis decrease illustrations Displaying purple world map with rising red bars, red line graph on slide with green grid
Free with trial Displaying dashboard grid showing fluctuating blue and red line graphs with metallic green sphere. Analytics, investment, data visualization, technology, finance, bar chart, dashboard. Analysis decrease illustrations Displaying dashboard grid showing fluctuating blue and red line graphs with metallic green sphere
Free with trial Pink Searching for food in trash can on streets outdoors icon isolated on pink background. Homelessness and poverty concept. Minimalism concept. 3D render illustration. Analysis decrease illustrations Pink Searching for food in trash can on streets outdoors icon isolated on pink background. Homelessness and poverty
Free with trial Golden jewelry with a down and growth arrows. Price of gold. Analysis decrease illustrations Golden jewelry with a down and growth arrows. Price of gold
Free with trial A close-up shot of a smartphone displaying a stock market chart, showing fluctuating prices. The dark theme enhances the visual impact of the pink graph line, generated by AI for a modern and sleek aesthetic. This image is perfect for illustrating financial technology, mobile trading, and investmen. Analysis decrease illustrations Mobile Stock Market Chart. A close-up shot of a smartphone displaying a stock market chart, showing fluctuating prices. The dark theme enhances the visual impact of the pink graph line, generated by AI for a modern and sleek aesthetic. This image is perfect for illustrating financial technology, mobile trading, and investmen
Free with trial Two bar graphs, one green showing growth and one red showing decline, with trend lines indicating opposite directions. Analysis decrease illustrations Bar graphs showing upward and downward trends. Two bar graphs, one green showing growth and one red showing decline, with trend lines indicating opposite directions
Free with trial This image features three bold, three-dimensional arrows pointing sharply downward, each rendered in distinct vibrant colors�'blue, yellow, and red�'symbolizing a significant market downturn, financial loss, or economic decline, set against a clean, minimalist white background that enhances their striking visual impact and conveys urgency and negative momentum in business, trading, or investment. Analysis decrease illustrations Colorful downward trending financial arrows in blue yellow and red illustrating market decline and economic downturn concepts. This image features three bold, three-dimensional arrows pointing sharply downward, each rendered in distinct vibrant colors�'blue, yellow, and red�'symbolizing a significant market downturn, financial loss, or economic decline, set against a clean, minimalist white background that enhances their striking visual impact and conveys urgency and negative momentum in business, trading, or investment
Free with trial This image features a minimalist and modern vector icon of a jagged downward trending line graph, sharply declining from left to right, symbolizing financial loss, economic downturn, or market decline, set against a clean and uncluttered white background suitable for use in presentations, reports, infographics, or digital media to visually communicate negative trends or decreasing performance. Analysis decrease illustrations Sharp downward trending line graph icon isolated on white background representing financial loss or market decline vector. This image features a minimalist and modern vector icon of a jagged downward trending line graph, sharply declining from left to right, symbolizing financial loss, economic downturn, or market decline, set against a clean and uncluttered white background suitable for use in presentations, reports, infographics, or digital media to visually communicate negative trends or decreasing performance
Free with trial Futuristic Robot Hand Displaying Download Icon for Cost Reduction Strategy in Digital Business Environment Quark. Analysis decrease illustrations Futuristic Robot Hand Displaying Download Icon for Cost Reduction Strategy in Digital Business Environment Quark
Free with trial Inflation pictogram group. Set of growth and fall signs, income and profit signs. Dollar sign. Charts, notifications, messages. Analysis decrease vectors Inflation pictogram group. Set of growth and fall signs, income and profit signs. Dollar sign. Charts, notifications, messages.
Free with trial A vibrant red arrow graph sharply declining against a dark, textured background, symbolizing a significant financial downturn or economic crisis. Analysis decrease illustrations Red downward arrow graph on dark background showing financial crisis. A vibrant red arrow graph sharply declining against a dark, textured background, symbolizing a significant financial downturn or economic crisis
Free with trial A bold outline illustration of a computer screen displaying a downward trending line, representing financial loss or negative growth. Analysis decrease vectors Bold Outline Computer Screen with Falling Trend Line Icon Illustration. A bold outline illustration of a computer screen displaying a downward trending line, representing financial loss or negative growth.
Free with trial Two sets of simple flat design charts showing bar graphs with line graphs and three-segment pie charts in red, green, and blue. Analysis decrease vectors Two bar charts with line graphs and two pie charts data visualization statistics. Two sets of simple flat design charts showing bar graphs with line graphs and three-segment pie charts in red, green, and blue
Free with trial 3d illustration of red decreasing graph on stand, financial presentation representing negative results or economic downturn. Analysis decrease vectors 3d illustration of red decreasing graph on stand, financial presentation representing negative results
Free with trial A black upward arrow merges into a downward curving line graph on a white background. Analysis decrease illustrations Black upward arrow and downward curve graph on white background chart. A black upward arrow merges into a downward curving line graph on a white background
Free with trial Line art icon featuring a magnifying glass positioned over a vertical bar chart. The design is simple and minimalistic, using grey lines. The bar chart consists of three bars of varying heights, and the magnifying glass is centered over the middle bar, suggesting examination or analysis of data. This icon is likely used to symbolize data analysis, inspection, or detailed observation in a graphical representation. Analysis decrease vectors Line art icon of magnifying glass over bar chart. Line art icon featuring a magnifying glass positioned over a vertical bar chart. The design is simple and minimalistic, using grey lines. The bar chart consists of three bars of varying heights, and the magnifying glass is centered over the middle bar, suggesting examination or analysis of data. This icon is likely used to symbolize data analysis, inspection, or detailed observation in a graphical representation.
Free with trial A green line graph illustrating data points over time, with the y-axis labeled 'Value' and the x-axis labeled 'Time', showcasing significant ups and downs in the data. Analysis decrease illustrations Line graph showing fluctuating values over time. A green line graph illustrating data points over time, with the y-axis labeled 'Value' and the x-axis labeled 'Time', showcasing significant ups and downs in the data
Free with trial A clean and modern graphic featuring the number '5%' prominently displayed on a soft, golden gradient background. A bright, circular spotlight effect emanates from the right side, creating a sense of illumination and focus. This versatile image is ideal for representing discounts, sales, special offers, promotions, or any concept related to a five percent value. The minimalist design and ample negative space make it perfect for adding text overlays or integrating into various marketing materials. Analysis decrease illustrations Five Percent Discount - Clean Gradient Background with Spotlight Effect. A clean and modern graphic featuring the number '5%' prominently displayed on a soft, golden gradient background. A bright, circular spotlight effect emanates from the right side, creating a sense of illumination and focus. This versatile image is ideal for representing discounts, sales, special offers, promotions, or any concept related to a five percent value. The minimalist design and ample negative space make it perfect for adding text overlays or integrating into various marketing materials.
Free with trial This 3D rendering showcases gold bars and coins against a backdrop of a dynamic stock market graph, generated by AI. The image evokes themes of wealth, investment, and market fluctuations. The high-quality rendering emphasizes the precious nature of gold. Analysis decrease illustrations Gold Bullion & Market Graph. This 3D rendering showcases gold bars and coins against a backdrop of a dynamic stock market graph, generated by AI. The image evokes themes of wealth, investment, and market fluctuations. The high-quality rendering emphasizes the precious nature of gold.
Free with trial A comprehensive collection of hand-drawn business and data visualization icons. This doodle-style set features a variety of essential elements, including different types of arrows, bar graphs, line charts, and pie charts. The sketchy, black and white illustrations are perfect for infographics, presentations, financial reports, and marketing materials. Each icon is isolated on a white background, representing concepts like growth, statistics, process flow, and direction. This versatile vector set is ideal for adding a creative, hand-made touch to any project related to analytics, finance, or strategy. Analysis decrease illustrations Hand Drawn Business and Finance Doodle Icon Set. A comprehensive collection of hand-drawn business and data visualization icons. This doodle-style set features a variety of essential elements, including different types of arrows, bar graphs, line charts, and pie charts. The sketchy, black and white illustrations are perfect for infographics, presentations, financial reports, and marketing materials. Each icon is isolated on a white background, representing concepts like growth, statistics, process flow, and direction. This versatile vector set is ideal for adding a creative, hand-made touch to any project related to analytics, finance, or strategy.
Free with trial A striking 3D render illustrating a significant financial or business decline. The image features a minimalist bar chart with three decreasing blue-grey bars, symbolizing a negative trend or falling performance. A prominent, jagged red arrow sharply points downwards across the chart, emphatically conveying concepts of loss, recession, crisis, or market downturn. Set against a vibrant yellow background, this clean and modern graphic is ideal for presentations, reports, articles, or educational materials discussing economic challenges, poor statistics, or business risks. Analysis decrease illustrations Financial Decline Bar Chart with Red Down Arrow. A striking 3D render illustrating a significant financial or business decline. The image features a minimalist bar chart with three decreasing blue-grey bars, symbolizing a negative trend or falling performance. A prominent, jagged red arrow sharply points downwards across the chart, emphatically conveying concepts of loss, recession, crisis, or market downturn. Set against a vibrant yellow background, this clean and modern graphic is ideal for presentations, reports, articles, or educational materials discussing economic challenges, poor statistics, or business risks.
Free with trial An isometric 3D bar chart with four descending bars, made of a clear glass with a modern, holographic, and iridescent finish in pink and blue. Concept of financial decline or decreasing data trends. Analysis decrease vectors Isometric Bar Chart Showing Decline with Iridescent Bars. An isometric 3D bar chart with four descending bars, made of a clear glass with a modern, holographic, and iridescent finish in pink and blue. Concept of financial decline or decreasing data trends
Free with trial Modern Technology and Home Finance Concept with House Icon and Percentage Symbols on Laptop Keyboard in Soft Focus Background Sigmoid. Analysis decrease illustrations A person interacts with a laptop, showcasing a digital house icon and percentage symbols, representing concepts in home. Modern Technology and Home Finance Concept with House Icon and Percentage Symbols on Laptop Keyboard in Soft Focus Background Sigmoid
Free with trial Robotic Hand Interacting with Digital Cost Reduction Interface in a Futuristic Cityscape with Data Graphs and Business Icons Quark. Analysis decrease illustrations Robotic Hand Interacting with Digital Cost Reduction Interface in a Futuristic Cityscape with Data Graphs and Business
Free with trial A hand interacts with vibrant financial charts, showcasing data trends through modern technology and digital interfaces, ideal for conveying analytics and growth. Scalp. Analysis decrease illustrations Hand Interacting with Financial Growth Chart Displaying Data Trends and Indicators Through Interactive Technology and. A hand interacts with vibrant financial. A hand interacts with vibrant financial charts, showcasing data trends through modern technology and digital interfaces, ideal for conveying analytics and growth. Scalp
Free with trial A stark red arrow dramatically descends across a series of blue bars, illustrating a significant downward trend. Analysis decrease illustrations Red arrow shows sharp decline on blue bar graph. A stark red arrow dramatically descends across a series of blue bars, illustrating a significant downward trend
Free with trial Businessman in suit drawing a downward trending graph with the word RISK Clear details and vibrant colors enha. Analysis decrease illustrations Businessman drawing a downward trending graph with the word RISK risk chart. Businessman in suit drawing a downward trending graph with the word RISK Clear details and vibrant colors enha
Free with trial Black and white line graph comparing nominal and real return over time with axes labeled. Analysis decrease illustrations Black and white line graph showing nominal and real return over time chart nominal return. Black and white line graph comparing nominal and real return over time with axes labeled
Free with trial Black icon of a fluctuating graph with a downward trend arrow on a white background. Analysis decrease illustrations Black icon of a fluctuating graph with downward trend arrow chart data. Black icon of a fluctuating graph with a downward trend arrow on a white background
Free with trial This abstract image features a vibrant candlestick chart, common in financial trading visualizations. The chart is overlaid on a blurred background of colorful circles, adding to its abstract aesthetic. Below the chart are vertical bars of varying heights and colors. This image was generated by AI. Analysis decrease illustrations Candlestick Chart Abstract. This abstract image features a vibrant candlestick chart, common in financial trading visualizations. The chart is overlaid on a blurred background of colorful circles, adding to its abstract aesthetic. Below the chart are vertical bars of varying heights and colors. This image was generated by AI.
Free with trial A comprehensive collection of cartoon-style vector icons illustrating key financial and economic concepts. This set includes symbols for market decline, payment processing, bull and bear market dynamics, investment analysis, global currencies, financial balance, and rising interest rates. Ideal for use in business presentations, financial reports, banking websites, educational materials, or any project related to economics and investment. Analysis decrease vectors Financial and Economic Icons Set. A comprehensive collection of cartoon-style vector icons illustrating key financial and economic concepts. This set includes symbols for market decline, payment processing, bull and bear market dynamics, investment analysis, global currencies, financial balance, and rising interest rates. Ideal for use in business presentations, financial reports, banking websites, educational materials, or any project related to economics and investment.
Free with trial A 3D rendered bar chart with bars in red, yellow, green, and blue, arranged in descending order of height. A thick black arrow curves downwards from the top left, crossing over the bars and pointing towards the bottom right, indicating a downward trend or decline. The image is set against a clean, white background. Analysis decrease illustrations Colorful Bar Chart Showing Downward Trend with Black Arrow on White Background graph. A 3D rendered bar chart with bars in red, yellow, green, and blue, arranged in descending order of height. A thick black arrow curves downwards from the top left, crossing over the bars and pointing towards the bottom right, indicating a downward trend or decline. The image is set against a clean, white background
Free with trial Analyze the crash in the stock market crash. Learn from investment failure mistakes. Assess the damage from the business sector. Experts find the cause of the stock chart fall. Analysis decrease vectors Analyze the crash in the stock market crash. Learn from investment failure mistakes. Assess the damage from the business
Free with trial A minimalist and clean line art illustration of a graph depicting a downward trend, symbolizing economic decline, failure, or a recession in business. Analysis decrease vectors Simple Outline Falling Graph Line Chart Economic Recession Business Icon. A minimalist and clean line art illustration of a graph depicting a downward trend, symbolizing economic decline, failure, or a recession in business.
Free with trial A stark red arrow graphically depicts a significant downward trend on a white chart, symbolizing financial loss or market crash. Analysis decrease illustrations Red arrow graph showing sharp financial decline. A stark red arrow graphically depicts a significant downward trend on a white chart, symbolizing financial loss or market crash
Free with trial Dynamic teal graph visually represents financial data. Professional design elements provide an ideal visual for business reports and presentations , dreamy concept. Analysis decrease illustrations Abstract Digital Financial Graph with Teal Data. Dynamic teal graph visually represents financial data. Professional design elements provide an ideal visual for business reports and presentations , dreamy concept
Free with trial Year data charts illustration color coded, categories month, total representation year data charts. Analysis decrease illustrations Year data charts
Free with trial Economic critical crisis concept. The bar garph with red drop down arrow on red background. Recession financial, cryptocurrency, gold, and the stock market. Losing money and cash. Bearish. Analysis decrease vectors Economic critical crisis concept. The bar garph with red drop down arrow on red background. Recession financial, cryptocurrency
Free with trial Black bar graph with downward arrows indicating a decline or loss on a white background. Analysis decrease illustrations Falling bar graph with downward arrows indicating decline or loss chart. Black bar graph with downward arrows indicating a decline or loss on a white background
Free with trial Satisfaction meter offset shadow line icon. Customer experience, commerce. Measurement indicator. Sad, happy. Bold outline symbol with solid red fill. Modern flat illustration. Editable stroke. Analysis decrease vectors Satisfaction meter offset shadow line icon
Free with trial Business Team Analyzing Cost Management Strategies Using Digital Technology in a Modern Workspace Environment Quark. Analysis decrease illustrations Business Team Analyzing Cost Management Strategies Using Digital Technology in a Modern Workspace Environment Quark
Free with trial Volatility of financial market pleases or upsets man standing near chart with sharp fluctuations. Problems of volatility in trading and influence of emotional background on investor. Analysis decrease vectors Volatility of financial market pleases or upsets man standing near chart with sharp fluctuations
Free with trial A close-up view of black financial and business chart icons arranged in a grid on a light background. Analysis decrease illustrations Close-up of financial and business chart icons on a grid finance charts. A close-up view of black financial and business chart icons arranged in a grid on a light background
Free with trial Stylized data illustrates financial increase using dollar signs, bar graphs, and arrows. Some data trends down while other data trends up, showing potential profits and losses. Analysis decrease illustrations Stock Market Data Shows Economic Growth and Potential Loss in the Future. Stylized data illustrates financial increase using dollar signs, bar graphs, and arrows. Some data trends down while other data trends up, showing potential profits and losses.
Free with trial Economic critical crisis concept. The bar garph on red background. Recession financial, cryptocurrency, gold, and the stock market. Losing money and cash. Bearish. Analysis decrease vectors Economic critical crisis concept. The bar garph on red background. Recession financial, cryptocurrency, gold, and the stock market
Free with trial Business graph with up arrow down arrow logo template. Analysis decrease vectors Business graph with up arrow down arrow logo template
Free with trial Stock market. The rise and fall of securities. Successful trading. Market trend up green and red down arrows, financial graphs. Business investment growth and loss arrow. Graph going up and down symbol vector illustration. Analysis decrease vectors Stock market. The rise and fall of securities. Successful trading. Market trend up green and red down arrows, financial graphs.
Free with trial Stock market. The rise and fall of securities. Successful trading. Market trend up green and red down arrows, financial graphs. Business investment growth and loss arrow. Graph going up and down symbol vector illustration. Analysis decrease vectors Stock market. The rise and fall of securities. Successful trading. Market trend up green and red down arrows, financial graphs.
Free with trial Stock market. The rise and fall of securities. Successful trading. Market trend up green and red down arrows, financial graphs. Business investment growth and loss arrow. Graph going up and down symbol vector illustration. Analysis decrease vectors Stock market. The rise and fall of securities. Successful trading. Market trend up green and red down arrows, financial graphs.
Free with trial Stock market. The rise and fall of securities. Successful trading. Market trend up green and red down arrows, financial graphs. Business investment growth and loss arrow. Graph going up and down symbol vector illustration. Analysis decrease vectors Stock market. The rise and fall of securities. Successful trading. Market trend up green and red down arrows, financial graphs.
Free with trial Stock market. The rise and fall of securities. Successful trading. Market trend up green and red down arrows, financial graphs. Business investment growth and loss arrow. Graph going up and down symbol vector illustration. Analysis decrease vectors Stock market. The rise and fall of securities. Successful trading. Market trend up green and red down arrows, financial graphs.
Free with trial Stock market. The rise and fall of securities. Successful trading. Market trend up green and red down arrows, financial graphs. Business investment growth and loss arrow. Graph going up and down symbol vector illustration. Analysis decrease vectors Stock market. The rise and fall of securities. Successful trading. Market trend up green and red down arrows, financial graphs.
Free with trial Black icon of a falling graph with a downward arrow on a white background. Clear details and vibrant colors en. Analysis decrease illustrations Falling Graph with Downward Arrow Icon on White Background downward trend decline. Black icon of a falling graph with a downward arrow on a white background. Clear details and vibrant colors en
Free with trial Green up and red down 3d arrow graph showing rising, descending trend, business result, profit or loss symbol symbol. Business arrow, goals concept. 3d world money symbols. Financial growth vector isolated. Analysis decrease vectors Green up and red down 3d arrow graph showing rising, descending trend, business result, profit. world money symbols. Green up and red down 3d arrow graph showing rising, descending trend, business result, profit or loss symbol symbol. Business arrow, goals concept. 3d world money symbols. Financial growth vector isolated
Free with trial Green up and red down 3d arrow graph showing rising, descending trend, business result, profit or loss symbol symbol. Business arrow, goals concept. 3d world money symbols. Financial growth vector isolated. Analysis decrease vectors Green up and red down 3d arrow graph showing rising, descending trend, business result, profit. world money symbols. Green up and red down 3d arrow graph showing rising, descending trend, business result, profit or loss symbol symbol. Business arrow, goals concept. 3d world money symbols. Financial growth vector isolated
Free with trial Green up and red down 3d arrow graph showing rising, descending trend, business result, profit or loss symbol symbol. Business arrow, goals concept. 3d world money symbols. Financial growth vector isolated. Analysis decrease vectors Green up and red down 3d arrow graph showing rising, descending trend, business result, profit. world money symbols. Green up and red down 3d arrow graph showing rising, descending trend, business result, profit or loss symbol symbol. Business arrow, goals concept. 3d world money symbols. Financial growth vector isolated
Free with trial Green up and red down 3d arrow graph showing rising, descending trend, business result, profit or loss symbol symbol. Business arrow, goals concept. 3d world money symbols. Financial growth vector isolated. Analysis decrease vectors Green up and red down 3d arrow graph showing rising, descending trend, business result, profit. world money symbols. Green up and red down 3d arrow graph showing rising, descending trend, business result, profit or loss symbol symbol. Business arrow, goals concept. 3d world money symbols. Financial growth vector isolated
Free with trial Green up and red down 3d arrow graph showing rising, descending trend, business result, profit or loss symbol symbol. Business arrow, goals concept. 3d world money symbols. Financial growth vector isolated. Analysis decrease vectors Green up and red down 3d arrow graph showing rising, descending trend, business result, profit. world money symbols. Green up and red down 3d arrow graph showing rising, descending trend, business result, profit or loss symbol symbol. Business arrow, goals concept. 3d world money symbols. Financial growth vector isolated
Free with trial This image showcases three gold bars resting on a screen displaying a dynamic stock market chart, generated by AI. The scene is visually striking, suggesting the relationship between gold as an investment and market trends. The high-resolution image is perfect for illustrating financial articles o. Analysis decrease illustrations Gold Bars & Stock Market Chart. This image showcases three gold bars resting on a screen displaying a dynamic stock market chart, generated by AI. The scene is visually striking, suggesting the relationship between gold as an investment and market trends. The high-resolution image is perfect for illustrating financial articles o
Free with trial Business professional analyzing cost reduction strategies with digital interface, graphic icons, and keyboard input in modern office environment Quark. Analysis decrease illustrations Business professional analyzing cost reduction strategies with digital interface, graphic icons, and keyboard input in
Free with trial Hands Collaborating to Represent Efficiency in Artificial Intelligence with Rising Quality and Falling Cost Graphs in a Modern Business Concept Gluon. Analysis decrease illustrations Hands Collaborating to Represent Efficiency in Artificial Intelligence with Rising Quality and Falling Cost Graphs in a
Free with trial Downward arrow, swirling line with blue concentric circles, and percentage symbol suggest falling rates. Ideal for finance, economy, interest, discount, marketing statistics cost management. Flat. Analysis decrease vectors Declining Percentage Rate Represented by Downward Arrow and Percentage Symbol. Downward arrow, swirling line with blue concentric circles, and percentage symbol suggest falling rates. Ideal for finance, economy, interest, discount, marketing statistics cost management. Flat
Free with trial This image showcases colorful 3D charts and graphs, representing financial data, generated by AI. It includes bar graphs, pie charts, and other visual representations of financial performance, displayed on a tablet and printed reports. The image suggests growth and positive financial trends. Analysis decrease illustrations AI-Generated Financial Charts. This image showcases colorful 3D charts and graphs, representing financial data, generated by AI. It includes bar graphs, pie charts, and other visual representations of financial performance, displayed on a tablet and printed reports. The image suggests growth and positive financial trends.
Free with trial Up and down directional arrows in vector format for versatile use. Perfect for business infographics and data visualization. EPS 10. Analysis decrease vectors Up and down directional arrows in vector format for versatile use. Perfect for business infographics and data visualization.
Free with trial Smartphone screen with password protection icon, downward sale arrow, and a chart depicting analytics. Ideal for cybersecurity, digital sales, ecommerce metrics, data protection, online safety. Analysis decrease vectors Mobile Security Features and Analytics Highlighting Sales Performance with Trend Insights. Smartphone screen with password protection icon, downward sale arrow, and a chart depicting analytics. Ideal for cybersecurity, digital sales, ecommerce metrics, data protection, online safety
Free with trial Illustration of a business activities. Analysis decrease vectors Illustration of a business activities
Free with trial Illustration of a business activities. Analysis decrease vectors Illustration of a business activities
Free with trial Illustration of a business activities. Analysis decrease vectors Illustration of a business activities
Free with trial Illustration of a business activities. Analysis decrease vectors Illustration of a business activities
Free with trial Illustration of a business activities. Analysis decrease vectors Illustration of a business activities
Free with trial A black curve graph depicts a revenue slowdown on a white background. Clear details and vibrant colors enhance. Analysis decrease illustrations Black curve graph showing revenue slowdown on white background chart line. A black curve graph depicts a revenue slowdown on a white background. Clear details and vibrant colors enhance
Free with trial Three black bars with downward arrows indicating decline on white background Clear details and vibrant colors. Analysis decrease illustrations Three black bars with downward arrows on white background bar chart graph. Three black bars with downward arrows indicating decline on white background Clear details and vibrant colors
Free with trial Downward arrow next to a small storefront under a cloud. Ideal for business decline, e-commerce, economic downturn, retail impact, cloud-based solutions, analytics, simple flat metaphor. Analysis decrease vectors Downward Arrow Beside Small Storefront Under Cloud Highlighting Business or Economic Trends. Downward arrow next to a small storefront under a cloud. Ideal for business decline, e-commerce, economic downturn, retail impact, cloud-based solutions, analytics, simple flat metaphor
Free with trial Illustration of a business activities. Analysis decrease vectors Illustration of a business activities
Free with trial Three wooden blocks arranged in a step-like formation on a wooden surface, with an upward-pointing arrow on the middle block and a downward-pointing arrow on the top block, representing concepts of growth, decline, and change in business or finance. Analysis decrease illustrations Wooden blocks with up and down arrows symbolizing business growth and decline. Three wooden blocks arranged in a step-like formation on a wooden surface, with an upward-pointing arrow on the middle block and a downward-pointing arrow on the top block, representing concepts of growth, decline, and change in business or finance
Free with trial Three stacks of coins, each topped with a wooden block featuring a downward-pointing arrow, illustrating a concept of financial loss, economic downturn, or decreasing value against a blue background. Analysis decrease illustrations Decreasing stacks of coins with down arrows symbolizing financial decline. Three stacks of coins, each topped with a wooden block featuring a downward-pointing arrow, illustrating a concept of financial loss, economic downturn, or decreasing value against a blue background
Free with trial Business Professional Highlighting Cost Management Strategies on a Digital Tablet with Visual Diagram and Infographic Elements Quark. Analysis decrease illustrations Business Professional Highlighting Cost Management Strategies on a Digital Tablet with Visual Diagram and Infographic
Free with trial A simple and modern silhouette illustration depicting a bull and a bear, representing the financial markets. Perfect for use in articles, presentations, or designs related to finance, investment, and the stock market. Analysis decrease vectors Minimalist Silhouette Bull and Bear Symbol Illustration for Finance Concept. A simple and modern silhouette illustration depicting a bull and a bear, representing the financial markets. Perfect for use in articles, presentations, or designs related to finance, investment, and the stock market.
Free with trial A robotic hand extends toward dynamic financial graphs and data in a cosmic setting. This image symbolizes the intersection of technology and finance, showcasing innovation. Scalp. Analysis decrease illustrations Futuristic robotic hand reaching towards digital financial graphs and data visualizations in a cosmic background with. A robotic hand extends toward dynamic financial graphs and data in a cosmic setting. This image symbolizes the intersection of technology and finance, showcasing innovation. Scalp