Free with trial A black graph showing an upward trend with a curved arrow indicating a reversal on a white background. Analysis decrease illustrations Upward trending graph with a curved arrow indicating a reversal on white background. A black graph showing an upward trend with a curved arrow indicating a reversal on a white background
Free with trial A 3D rendered bar chart illustrates a decreasing trend. The bars, colored in a gradient from yellow to purple, represent data points that are diminishing in value. Placed on a simple gray base, the chart is isolated against a white background. This image is suitable for illustrating concepts related to business, finance, statistics, and economic downturns. Analysis decrease illustrations 3D Bar Chart Decreasing Trend. A 3D rendered bar chart illustrates a decreasing trend. The bars, colored in a gradient from yellow to purple, represent data points that are diminishing in value. Placed on a simple gray base, the chart is isolated against a white background. This image is suitable for illustrating concepts related to business, finance, statistics, and economic downturns.
Free with trial A clean and modern digital illustration of a financial candlestick chart, displaying market trends and stock performance. The graph features blue candlesticks indicating price movements over time, accompanied by a solid blue line graph and subtle dashed trend lines. Set against a crisp white background with a clear grid, this visualization is ideal for illustrating concepts related to finance, investment, business analytics, economic forecasts, and data reporting. It conveys growth, volatility, and strategic decision-making in the stock market. Analysis decrease illustrations Financial Candlestick Chart with Trend Line on White Background. A clean and modern digital illustration of a financial candlestick chart, displaying market trends and stock performance. The graph features blue candlesticks indicating price movements over time, accompanied by a solid blue line graph and subtle dashed trend lines. Set against a crisp white background with a clear grid, this visualization is ideal for illustrating concepts related to finance, investment, business analytics, economic forecasts, and data reporting. It conveys growth, volatility, and strategic decision-making in the stock market.
Free with trial A visual representation of data trends, highlighting both positive progress and areas of concern with distinct markers for clarity and decision-making. Analysis decrease illustrations Bar chart showing growth with red crosses indicating issues. A visual representation of data trends, highlighting both positive progress and areas of concern with distinct markers for clarity and decision-making
Free with trial Dollar Currency Up Down Icons. Redus and high costs line with dollar icons.. eps. Analysis decrease vectors Circular dollar icons showing rising and falling currency values. Dollar Currency Up Down Icons. Redus and high costs line with dollar icons..eps
Free with trial Global Downturn Visualized: A striking graphic representation of economic decline, featuring a world map as the backdrop for a visual depiction of market fluctuations. Analysis decrease illustrations Global Downturn Visualized: A striking graphic representation
Free with trial A 3D render of a white bar chart with a red arrow graph descending across it. The background is a white grid. The chart is isolated on a white surface with reflections. Analysis decrease illustrations Red arrow graph chart showing downward trend on white grid background bar chart financial. A 3D render of a white bar chart with a red arrow graph descending across it. The background is a white grid. The chart is isolated on a white surface with reflections
Free with trial A downward arrow made of smoke indicates economic loss in a dark setting, symbolizing market decline. Analysis decrease illustrations Smoke arrow pointing down showing economic loss in a dark background Generative AI. A downward arrow made of smoke indicates economic loss in a dark setting, symbolizing market decline
Free with trial Illustration showing financial data analysis with charts, idea lightbulb, and location pins, perfect for finance and business concepts. Analysis decrease illustrations Analyzing Financial Data and Performance Charts Illustration. Illustration showing financial data analysis with charts, idea lightbulb, and location pins, perfect for finance and business concepts
Free with trial Cpi word block on white background. Analysis decrease illustrations Cpi word block on white
Free with trial Two bar graphs, one green showing upward growth and one red showing downward decline, against a white background. Analysis decrease illustrations Rising and falling bar graphs illustrating financial trends. Two bar graphs, one green showing upward growth and one red showing downward decline, against a white background
Free with trial Declining graph indicating financial loss, sad face representing disappointment, coin symbolizing money, and cloud metaphor for challenges. Ideal for finance, business troubles, economic downturn. Analysis decrease vectors Financial Loss Concept with Declining Graph, Sad Face, Coin and Cloud Symbol. Declining graph indicating financial loss, sad face representing disappointment, coin symbolizing money, and cloud metaphor for challenges. Ideal for finance, business troubles, economic downturn
Free with trial A red line graph showing a downward trend. Generative AI. Analysis decrease illustrations A red line graph showing a downward trend
Free with trial A black line graph depicting a downward trend with an arrow on a white background Clear details and vibrant co. Analysis decrease illustrations Black line graph showing a downward trend with an arrow chart decline. A black line graph depicting a downward trend with an arrow on a white background Clear details and vibrant co
Free with trial A black line graph with two curves showing a downward trend on a white background. Analysis decrease illustrations Black line graph showing a downward trend with two lines on white background chart. A black line graph with two curves showing a downward trend on a white background
Free with trial Large icon group, inflation sign set, Profit, loss, purchasing power, successful and unsuccessful investments. Vector illustration. Analysis decrease vectors Large icon group, inflation sign set. Profit, loss, purchasing power, successful and unsuccessful investments. Vector illustration
Free with trial An abstract digital financial chart features multiple vibrant, fluctuating neon lines in blue, green, pink, and white, set against a dark grid background. Prominent red upward and downward arrows, along with a green downward arrow, clearly indicate market trends, growth, and decline. Interspersed geometric shapes connected by lines suggest complex data points and network connections. This dynamic visualization is ideal for illustrating concepts of stock market data, cryptocurrency trends, business analytics, investment volatility, big data, AI, and financial technology, suitable for modern business and tech-related projects. Analysis decrease illustrations Digital Financial Data Chart with Fluctuating Lines and Arrows. An abstract digital financial chart features multiple vibrant, fluctuating neon lines in blue, green, pink, and white, set against a dark grid background. Prominent red upward and downward arrows, along with a green downward arrow, clearly indicate market trends, growth, and decline. Interspersed geometric shapes connected by lines suggest complex data points and network connections. This dynamic visualization is ideal for illustrating concepts of stock market data, cryptocurrency trends, business analytics, investment volatility, big data, AI, and financial technology, suitable for modern business and tech-related projects.
Free with trial A collection of colorful flat icons representing marketing and business concepts like growth, analytics, and strategy. Analysis decrease illustrations Marketing and Business Growth Icons Set for Digital Strategy and Analytics image photo. A collection of colorful flat icons representing marketing and business concepts like growth, analytics, and strategy
Free with trial A black bar graph showing a decline with the word disinflation below it on a white background. Analysis decrease illustrations Declining bar graph with the word disinflation on a white background economy price. A black bar graph showing a decline with the word disinflation below it on a white background
Free with trial Green up and red down 3d arrow graph showing rising, descending trend, business result, profit or loss symbol symbol. Business arrow, goals concept. 3d world money symbols. Financial growth. Analysis decrease illustrations Green up and red down 3d arrow graph showing rising, descending trend, business result, 3d world money symbols. Financial growth. Green up and red down 3d arrow graph showing rising, descending trend, business result, profit or loss symbol symbol. Business arrow, goals concept. 3d world money symbols. Financial growth
Free with trial Green up and red down 3d arrow graph showing rising, descending trend, business result, profit or loss symbol symbol. Business arrow, goals concept. 3d world money symbols. Financial growth. Analysis decrease illustrations Green up and red down 3d arrow graph showing rising, descending trend, business result, 3d world money symbols. Financial growth. Green up and red down 3d arrow graph showing rising, descending trend, business result, profit or loss symbol symbol. Business arrow, goals concept. 3d world money symbols. Financial growth
Free with trial Green up and red down 3d arrow graph showing rising, descending trend, business result, profit or loss symbol symbol. Business arrow, goals concept. 3d world money symbols. Financial growth. Analysis decrease illustrations Green up and red down 3d arrow graph showing rising, descending trend, business result, 3d world money symbols. Financial growth. Green up and red down 3d arrow graph showing rising, descending trend, business result, profit or loss symbol symbol. Business arrow, goals concept. 3d world money symbols. Financial growth
Free with trial Green up and red down 3d arrow graph showing rising, descending trend, business result, profit or loss symbol symbol. Business arrow, goals concept. 3d world money symbols. Financial growth. Analysis decrease illustrations Green up and red down 3d arrow graph showing rising, descending trend, business result, 3d world money symbols. Financial growth. Green up and red down 3d arrow graph showing rising, descending trend, business result, profit or loss symbol symbol. Business arrow, goals concept. 3d world money symbols. Financial growth
Free with trial Green up and red down 3d arrow graph showing rising, descending trend, business result, profit or loss symbol symbol. Business arrow, goals concept. 3d world money symbols. Financial growth. Analysis decrease illustrations Green up and red down 3d arrow graph showing rising, descending trend, business result, 3d world money symbols. Financial growth. Green up and red down 3d arrow graph showing rising, descending trend, business result, profit or loss symbol symbol. Business arrow, goals concept. 3d world money symbols. Financial growth
Free with trial Green up and red down 3d arrow graph showing rising, descending trend, business result, profit or loss symbol symbol. Business arrow, goals concept. 3d world money symbols. Financial growth. Analysis decrease illustrations Green up and red down 3d arrow graph showing rising, descending trend, business result, 3d world money symbols. Financial growth. Green up and red down 3d arrow graph showing rising, descending trend, business result, profit or loss symbol symbol. Business arrow, goals concept. 3d world money symbols. Financial growth
Free with trial A man in a dark suit touches a glowing blue digital interface overlaid on a downward trending bar graph. Analysis decrease illustrations Businessman touching glowing digital interface with downward trend graph technology. A man in a dark suit touches a glowing blue digital interface overlaid on a downward trending bar graph
Free with trial Illustration shows a stressed businessman with falling arrows and a sad face beside coins and a happy businessman with rising arrows and graphs. Positive financial mood. Generative AI. Analysis decrease vectors Businessman stressed and happy financial growth comparison vector illustration with coins and charts. Illustration shows a stressed businessman with falling arrows and a sad face beside coins and a happy businessman with rising arrows and graphs. Positive financial mood. Generative AI
Free with trial Data Stats Board Display Icon Downward Down Trend Statistic Performance Market Decline Economy Downturn Bar Graph Progress Sign Symbol Presentation. Analysis decrease vectors Data Stats Board Display Icon Downward Down Trend Statistic Performance Market Decline Economy Downturn Bar Graph Progress
Free with trial A modern boardroom scene features a large table surrounded by white chairs, but the focus is on a chart displaying a sharp downward trend, generated by AI for illustrative purposes. This image could represent various financial or business challenges. Analysis decrease illustrations Boardroom Crisis. A modern boardroom scene features a large table surrounded by white chairs, but the focus is on a chart displaying a sharp downward trend, generated by AI for illustrative purposes. This image could represent various financial or business challenges.
Free with trial This futuristic dashboard, generated by AI, displays a comprehensive set of dynamic graphs and charts, ideal for visualizing complex datasets. The vibrant color scheme enhances readability, while the sleek design emphasizes efficiency and modern aesthetics. This is a perfect example of how AI can. Analysis decrease illustrations AI-Generated Data Visualization Dashboard. This futuristic dashboard, generated by AI, displays a comprehensive set of dynamic graphs and charts, ideal for visualizing complex datasets. The vibrant color scheme enhances readability, while the sleek design emphasizes efficiency and modern aesthetics. This is a perfect example of how AI can
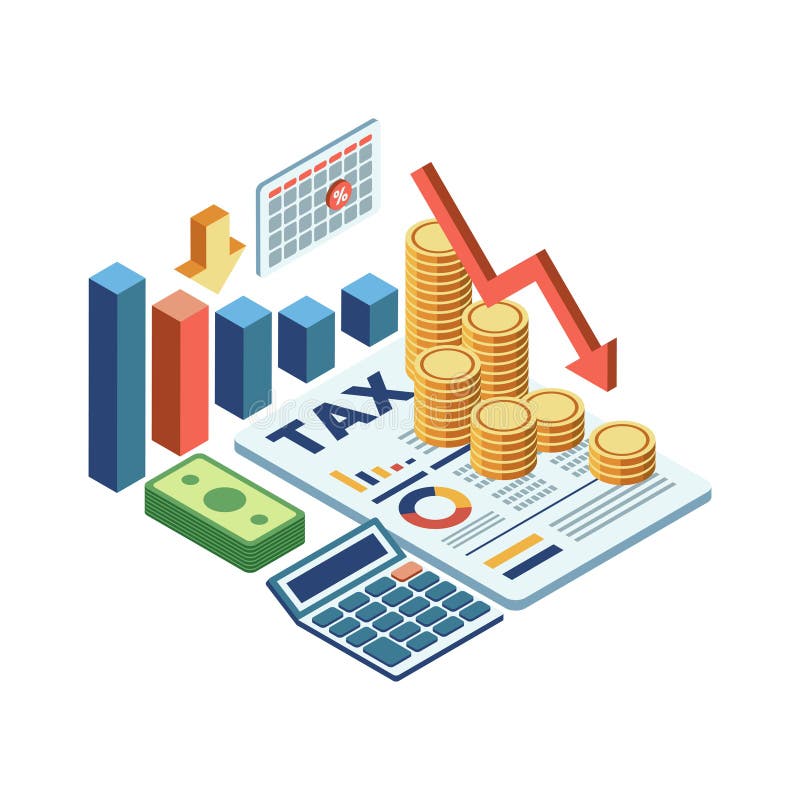
Free with trial Isometric Tax Deduction Concept with Financial Elements. Tax Deduction and Financial Management Concept. Analysis decrease vectors Isometric Tax Deduction Concept with Financial Elements
Free with trial A neon sign shaped like a downward trending graph is mounted on a tile wall in a dark tunnel, symbolizing financial loss or market crash for business illustration. Analysis decrease illustrations Downward Trend Neon Sign in Dark Tunnel. A neon sign shaped like a downward trending graph is mounted on a tile wall in a dark tunnel, symbolizing financial loss or market crash for business illustration
Free with trial The background features blurred lights, creating a dramatic effect. financial markets. Analysis decrease illustrations A red downward arrow symbolizes a decline in financial markets. The background features blurred lights, creating a dramatic effect. financial markets
Free with trial A visual representation of financial risk, showing declining profits, investment concerns, and the need for careful decision-making in business and finance. Analysis decrease illustrations Financial Risk Alert - Declining Profits and Investment Concerns. A visual representation of financial risk, showing declining profits, investment concerns, and the need for careful decision-making in business and finance
Free with trial Pyramid chart line icon. Halftone dotted pattern. Gradient icon with grain shadow. Analytics graph sign. Market analytics symbol. Line pyramid chart icon. Various designs. Vector. Analysis decrease vectors Pyramid chart line icon. Analytics graph sign. Halftone dotted pattern. Vector. Pyramid chart line icon. Halftone dotted pattern. Gradient icon with grain shadow. Analytics graph sign. Market analytics symbol. Line pyramid chart icon. Various designs. Vector
Free with trial A single, glossy green arrow pointing downwards, captured in a studio setting against a stark white background. This isolated object emphasizes concepts of reduction, decrease, or negative movement wi. Analysis decrease illustrations Green arrow pointing downwards, isolated on white background. A single, glossy green arrow pointing downwards, captured in a studio setting against a stark white background. This isolated object emphasizes concepts of reduction, decrease, or negative movement wi
Free with trial Black line graph showing a downward trend on a white background with grid lines chart. Analysis decrease illustrations Black line graph showing a downward trend on a white background with grid lines chart
Free with trial A simple line graph with an orange shaded area showing inflow and outflow dynamics with labeled axes and curves. Analysis decrease illustrations Upward and Downward Sloping Curves Illustrating Inflow and Outflow Dynamics graph chart. A simple line graph with an orange shaded area showing inflow and outflow dynamics with labeled axes and curves
Free with trial The image displays a financial stock market chart with various colored candlesticks and multiple technical indicators overlaid on a grid background. Analysis decrease illustrations Detailed financial stock market chart with technical indicators and price movements. The image displays a financial stock market chart with various colored candlesticks and multiple technical indicators overlaid on a grid background
Free with trial Downward arrow, British pound coin, hand with thumbs-up in blue circle. Ideal for cost reduction, value, savings, finances, success, economic changes and simple landing page. Analysis decrease illustrations Declining Costs Illustrated with Down Arrow, Pound Icon, and Positive Gesture. Downward arrow, British pound coin, hand with thumbs-up in blue circle. Ideal for cost reduction, value, savings, finances, success, economic changes and simple landing page
Free with trial Black icon of a rising line graph with arrow pointing down on white background chart. Analysis decrease illustrations Black icon of a rising line graph with arrow pointing down on white background chart
Free with trial Simple black bar graph icon with bars of varying heights on a white background Clear details and vibrant color. Analysis decrease illustrations Simple black bar graph icon showing varying heights on a white background chart data. Simple black bar graph icon with bars of varying heights on a white background Clear details and vibrant color
Free with trial A simple bar chart illustrating data trends with predominantly green bars indicating positive performance and one red bar suggesting a negative outcome, isolated on white. Analysis decrease illustrations Bar chart with green and red bars isolated on white background. A simple bar chart illustrating data trends with predominantly green bars indicating positive performance and one red bar suggesting a negative outcome, isolated on white
Free with trial A flat design illustration of two bar charts, one green and one red, both showing a downward trend with arrows, representing financial or business decline. Analysis decrease illustrations Bar chart showing declining trend isolated on white background. A flat design illustration of two bar charts, one green and one red, both showing a downward trend with arrows, representing financial or business decline
Free with trial A bar chart showing a steady decline with a red downward arrow, symbolizing financial loss, economic downturn, business decline, or negative performance trends. Analysis decrease illustrations Economic Downtrend Bar Chart for Business concept 3d Rendering. A bar chart showing a steady decline with a red downward arrow, symbolizing financial loss, economic downturn, business decline, or negative performance trends
Free with trial Consultancy company logo suggesting scaling and expansion --chaos 25 --stylize 0 --v 6. 1 Job ID: 645f5170-6b28-4c73-b608-f90141dcd45c. Analysis decrease illustrations Business Growth Icon. consultancy company logo suggesting scaling and expansion --chaos 25 --stylize 0 --v 6.1 Job ID: 645f5170-6b28-4c73-b608-f90141dcd45c
Free with trial The percentage symbol is placed on a soft light background creating a clear focus on the subject. Analysis decrease illustrations Percentage symbol standing on a soft light background in a simple setting Generative AI. The percentage symbol is placed on a soft light background creating a clear focus on the subject
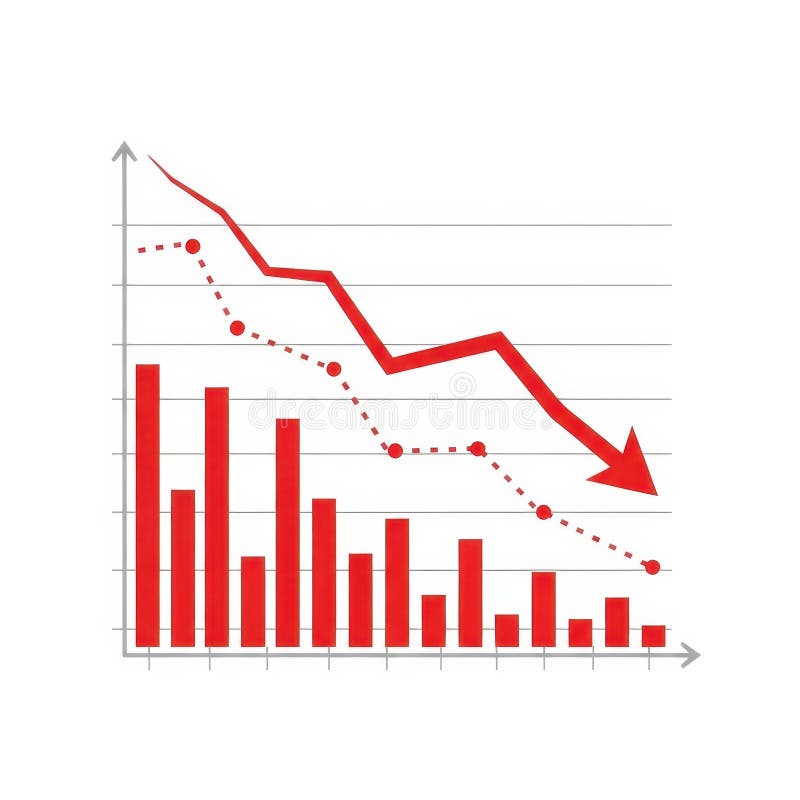
Free with trial Declining Bar Chart Shows Economic Downturn Illustration Red Arrow Signifies Loss Trend. Analysis decrease vectors Declining Bar Chart Shows Economic Downturn Illustration Red Arrow Signifies Loss Trend
Free with trial This image features a candlestick chart isolated on a white background. The chart displays price movements with green and red candlesticks, where green indicates an increase in price and red indicates a decrease. The candlesticks are arranged in a sequence, showing fluctuations in price over a period of time. The white background provides a clear contrast, making the chart easy to read and analyze. Analysis decrease illustrations Candlestick chart isolated on white background. This image features a candlestick chart isolated on a white background. The chart displays price movements with green and red candlesticks, where green indicates an increase in price and red indicates a decrease. The candlesticks are arranged in a sequence, showing fluctuations in price over a period of time. The white background provides a clear contrast, making the chart easy to read and analyze
Free with trial This image features a candlestick chart isolated on a white background. The chart displays price movements over time with green and red candlesticks, where green indicates an increase in price and red indicates a decrease. The candlesticks are arranged in a horizontal sequence, with each candlestick showing the open, close, high, and low prices for a specific time period. The white background. Analysis decrease illustrations Candlestick chart isolated on white background. This image features a candlestick chart isolated on a white background. The chart displays price movements over time with green and red candlesticks, where green indicates an increase in price and red indicates a decrease. The candlesticks are arranged in a horizontal sequence, with each candlestick showing the open, close, high, and low prices for a specific time period. The white background
Free with trial An abstract 3D illustration shows intertwined upward and downward arrows with stacks of coins, symbolizing financial fluctuations and market trends. Analysis decrease illustrations Abstract 3D visualization of upward and downward arrows intertwined with stacks of coins. An abstract 3D illustration shows intertwined upward and downward arrows with stacks of coins, symbolizing financial fluctuations and market trends
Free with trial A black shopping basket icon displays various financial charts and graphs in blue and green, indicating business analytics. Analysis decrease illustrations Shopping basket icon with financial charts and graphs on white background cart retail. A black shopping basket icon displays various financial charts and graphs in blue and green, indicating business analytics
Free with trial A visual representation of negative financial performance, illustrating a significant downward trend with a red arrow pointing downwards, indicating a loss or decline in value. Analysis decrease illustrations Red graph showing a downward trend isolated on white background. A visual representation of negative financial performance, illustrating a significant downward trend with a red arrow pointing downwards, indicating a loss or decline in value
Free with trial Black and white clipboard icon featuring a checklist. The design includes an "X" and three dots in a vertical line, symbolizing tasks or points, followed by a downward-curving arrow. The arrow suggests a downward trend or progression. The icon is simple, with thick lines, and is typically used to represent concepts in planning, business analysis, or project management. The background is plain, emphasizing the clipboard graphic. Analysis decrease vectors Clipboard checklist with downward trend. Black and white clipboard icon featuring a checklist. The design includes an "X" and three dots in a vertical line, symbolizing tasks or points, followed by a downward-curving arrow. The arrow suggests a downward trend or progression. The icon is simple, with thick lines, and is typically used to represent concepts in planning, business analysis, or project management. The background is plain, emphasizing the clipboard graphic.
Free with trial Estrogen and testosterone level measuring using indicator with different male and female silhouettes showing hormone increasing and decreasing, healthcare and medical concept. Analysis decrease vectors Indicator is showing estrogen and testosterone level increasing and decreasing. Estrogen and testosterone level measuring using indicator with different male and female silhouettes showing hormone increasing and decreasing, healthcare and medical concept
Free with trial Declining business graph chart showing downward trend in finances. Analysis decrease vectors Declining business graph chart showing downward trend in finances
Free with trial A minimalist dark gray bar chart on a white background displays varying heights, illustrating data fluctuations and trends. Analysis decrease illustrations Simple bar chart showing increasing and decreasing data trends. A minimalist dark gray bar chart on a white background displays varying heights, illustrating data fluctuations and trends
Free with trial A spreadsheet shows a significant -5% GDP figure highlighted in red. Blurred hands of an analyst type on a keyboard while working at an office desk, set in a neutral background. Analysis decrease illustrations Close-up of highlighted GDP decrease in spreadsheet with analyst typing at office desk. A spreadsheet shows a significant -5% GDP figure highlighted in red. Blurred hands of an analyst type on a keyboard while working at an office desk, set in a neutral background
Free with trial Showing helix graph tracking market data in dotted grid display, with bars and arrowed markers. Financial, technology, innovation, data, analytics, digital, futuristic. Analysis decrease illustrations Showing helix graph tracking market data in dotted grid display, with bars and arrowed markers
Free with trial Displaying chart showing downward trend on gray hexagon grid, with gradient bars and red arrow. Data analytics, infographics, minimalist, technology, finance, business intelligence, dashboard. Analysis decrease illustrations Displaying chart showing downward trend on gray hexagon grid, with gradient bars and red arrow
Free with trial A close-up shot of a hand placing a wooden block with the letter C on top of other blocks spelling COST, with a green downward arrow indicating a decrease or reduction in expenses. Analysis decrease illustrations Hand arranging wooden blocks spelling COST with a downward arrow, symbolizing cost reduction. A close-up shot of a hand placing a wooden block with the letter C on top of other blocks spelling COST, with a green downward arrow indicating a decrease or reduction in expenses
Free with trial Stock Market Loss 3D Icon, Isolated on White Background. Analysis decrease illustrations Stock Market Loss 3D Icon
Free with trial Flat 3d Isometric Falling Arrow Piercing Through Businessman Hand. Investment Risk and Downtrend Stock Market Concept. Analysis decrease vectors Isometric Falling Arrow Piercing Through Businessman Hand
Free with trial Downward arrow pointing alongside a falling dollar coin with a cloud above. Ideal for finance, economics, loss, investment, risk, business, savings, simple flat metaphor. Analysis decrease vectors Downward Arrow and Dollar Coin Representing Financial Decline or Economic Loss. Downward arrow pointing alongside a falling dollar coin with a cloud above. Ideal for finance, economics, loss, investment, risk, business, savings, simple flat metaphor
Free with trial Blue Glass 3D Bar Chart Showing Data Decline. Analysis decrease illustrations Blue Glass 3D Bar Chart Showing Data Decline
Free with trial A descending line graph illustrates a negative financial trend against a backdrop of a dimly lit room with a window, symbolizing economic downturns. Analysis decrease illustrations Downward Financial Trend Graph in Dark Room. A descending line graph illustrates a negative financial trend against a backdrop of a dimly lit room with a window, symbolizing economic downturns
Free with trial Businessman hand holding digital graph with cost reduction concept showing financial growth saving strategy economic efficiency and business success in modern finance. Analysis decrease illustrations Businessman hand holding digital graph with cost reduction concept showing financial growth saving strategy economic efficiency
Free with trial Woman's hands using a stylus on a tablet with a cost reduction graphic showing dollar coins descending. Analysis decrease illustrations Person using tablet and laptop with cost reduction graphic business finance. Woman's hands using a stylus on a tablet with a cost reduction graphic showing dollar coins descending
Free with trial A globe with a map of the world on it, sitting next to a set of orange bar graphs. Analysis decrease illustrations A globe sitting on top of a table next to a bar chart. A globe with a map of the world on it, sitting next to a set of orange bar graphs
Free with trial A paper cutout illustration of two arrows, one red, one green, indicating upward & downward trends. Analysis decrease illustrations Stock market growth red arrow outpacing. A paper cutout illustration of two arrows, one red, one green, indicating upward & downward trends
Free with trial A businessman in a suit holds a digital display showing arrows and percentages, representing the concept of reducing costs while improving quality. The image portrays business strategy and efficiency. Analysis decrease illustrations Businessman presents cost reduction and quality improvement concept. A businessman in a suit holds a digital display showing arrows and percentages, representing the concept of reducing costs while improving quality. The image portrays business strategy and efficiency
Free with trial Coins, Donation money and Decreasing graph line icons for web app. Glare of light effect. Message icon. Pack of Cashback card, Bitcoin, Salary pictogram icons. Vector. Analysis decrease vectors Coins, Donation money and Decreasing graph line icons for web app. Pictogram icon. Glare of light icons. Vector. Coins, Donation money and Decreasing graph line icons for web app. Glare of light effect. Message icon. Pack of Cashback card, Bitcoin, Salary pictogram icons. Vector
Free with trial This image features a bold 2. 29% percentage symbol in metallic blue on a black background, ideal for financial presentations and business reports. Analysis decrease illustrations Metallic Blue Percentage Symbol 229 on Black Background for Financial and Business Concepts. This image features a bold 2.29% percentage symbol in metallic blue on a black background, ideal for financial presentations and business reports
Free with trial A modern smartphone displays a dynamic Bitcoin trading chart with candlestick patterns and growth percentages. A fingerprint scanner icon emphasizes secure mobile crypto investment and finance technology. Analysis decrease illustrations Smartphone with Bitcoin Cryptocurrency Trading Chart and Fingerprint Security. A modern smartphone displays a dynamic Bitcoin trading chart with candlestick patterns and growth percentages. A fingerprint scanner icon emphasizes secure mobile crypto investment and finance technology
Free with trial A black silhouette of a financial graph with bars and jagged lines is shown on white. Analysis decrease illustrations Black silhouette of a financial graph with bars and jagged lines on white chart business. A black silhouette of a financial graph with bars and jagged lines is shown on white
Free with trial Displaying jagged red line chart declining on trading screen, with numeric labels and lens-flare. Financial, technology, analytics, investment, data visualization, digital, modern. Analysis decrease illustrations Displaying jagged red line chart declining on trading screen, with numeric labels and lens-flare
Free with trial A hand holds a glowing blue bar graph with a downward trending arrow and the word COST above. Analysis decrease illustrations Man holding glowing cost reduction graph with downward arrow chart financial. A hand holds a glowing blue bar graph with a downward trending arrow and the word COST above
Free with trial A hand drawn line graph on crumpled graph paper depicts fluctuating market trends. Analysis decrease illustrations Hand drawn financial graph on crumpled paper with red and blue lines. A hand drawn line graph on crumpled graph paper depicts fluctuating market trends