Free with trial Currency exchange rate is fluctuating showing dollar gaining value while euro is decreasing. Arrow showing decrease vectors Dollar growing while euro is decreasing showing currency exchange rate. Currency exchange rate is fluctuating showing dollar gaining value while euro is decreasing
Free with trial Downward trend graphic table. Graphic table. Sketch-like table showing a downward trend or decrease or reduction. Linear sketch like graphictable. Vectorised digitally handdrawn illustration. Black and White illustration. Arrow showing decrease illustrations High to Low graphic table. Downward trend graphic table. Graphic table. Sketch-like table showing a downward trend or decrease or reduction. Linear sketch like graphictable. Vectorised digitally handdrawn illustration. Black and White illustration.
Free with trial This image depicts two contrasting scenarios of the housing market, one showing a positive upward trend and the other a negative downward trend. Arrow showing decrease illustrations Visual representation of real estate market trends showing both upward and downward fluctuations in housing prices and investment. This image depicts two contrasting scenarios of the housing market, one showing a positive upward trend and the other a negative downward trend
Free with trial Handmade origami style 3d chart showing falling trend. sharp pointed white paper sculpture casting shadows on flat surface. minimalist conceptual photography. economic crisis representation. business failure metaphor. clean architectural paper design. Arrow showing decrease illustrations Creative paper art representing white downward arrow graph on light blue background symbolizing financial decline or recession. Handmade origami style 3d chart. Handmade origami style 3d chart showing falling trend. sharp pointed white paper sculpture casting shadows on flat surface. minimalist conceptual photography. economic crisis representation. business failure metaphor. clean architectural paper design
Free with trial Arrows Background Showing Pointing Up Or Growth. Arrow showing decrease vectors Arrows Background Shows Pointing Up Or Growth
Free with trial Arrows Background Showing Pointing Up Or Growth. Arrow showing decrease vectors Arrows Background Shows Pointing Up Or Growth
Free with trial Businessman showing graph falling down, geometric pattern. Arrow showing decrease illustrations Falling down of economic activity, geometric pattern. Businessman showing graph falling down, geometric pattern
Free with trial Decreasing red arrows showing the deterioration of the economy or the fall of stocks on the stock exchange in Russia. Arrow showing decrease illustrations Decreasing red arrows showing the deterioration of the economy in Russia. Decreasing red arrows showing the deterioration of the economy or the fall of stocks on the stock exchange in Russia.
Free with trial Businessman showing empty pocket because crisis, geometric pattern. Arrow showing decrease illustrations Falling down of economic activity, geometric pattern. Businessman showing empty pocket because crisis, geometric pattern
Free with trial The chart showing financial crisis - 3d rendering. Arrow showing decrease illustrations Chart showing financial crisis - 3d rendering
Free with trial The chart showing financial crisis - 3d rendering. Arrow showing decrease illustrations The chart showing financial crisis - 3d rendering
Free with trial Infographic graph showing lowering of price in simple colors on white backdrop. Business concept. Arrow showing decrease vectors Infographic graph showing lowering of price in simple colors on white backdrop
Free with trial Economic crisis isometric vector illustration - business analysis graphic with falling trend on mobile phone. Broken red arrow and coin showing fall of economy, financial and banking indicators. Arrow showing decrease vectors Economic crisis isometric vector illustration - business analysis graphic with falling trend on mobile phone.
Free with trial The chart showing financial crisis - 3d rendering. Arrow showing decrease illustrations Chart showing financial crisis - 3d rendering
Free with trial Illustration of falling arrow hitting businessman showing financial crisis, Financial crisis vector concept. Arrow showing decrease vectors Financial crisis vector concept
Free with trial Concept of currency devaluation. Electric board showing euro currency depreciation wirg red line going down. Arrow showing decrease illustrations Electric board showing euro currency depreciation wirg red line going down.
Free with trial Set of graphs of growth and fall on a blue background. line business graphs showing performance and sale. Arrow showing decrease illustrations Line business graphs showing performance and sales. Set of graphs of growth and fall on a blue background. line business graphs showing performance and sale
Free with trial Business Failure. Graph with an arrow pointed down. Disappointed, sad businessman. Vector, flat style, clip art. Arrow showing decrease vectors Young African American is standing near flip chart pointing at the decreasing graph. Negative trend concept. Business Failure. Graph with an arrow pointed down. Disappointed, sad businessman. Vector, flat style, clip art
Free with trial Conceptual financial illustration of a falling stock market index. Red line graph showing sharp decline, volatility, and economic crisis point with a target circle on a dark grid background. Arrow showing decrease illustrations Red stock market graph showing economic crash and financial crisis on dark background. Conceptual financial illustration of a falling stock market index. Red line graph showing sharp decline, volatility, and economic crisis point with a target circle on a dark grid background.
Free with trial Puzzle Button showing Coronavirus Symbol: Arrows up and down. Arrow showing decrease illustrations Puzzle Button with Covid-19 Icon - Increase or Decrease. Puzzle Button showing Coronavirus Symbol: Arrows up and down
Free with trial Writing note showing Low Cost Loans. Business concept for loan that has an interest rate below twelve percent Woman Looking Trough Magnifying Glass Big Eye Blank Round Speech Bubble. Arrow showing decrease illustrations Writing note showing Low Cost Loans. Business photo showcasing loan that has an interest rate below twelve percent Woman. Writing note showing Low Cost Loans. Business concept for loan that has an interest rate below twelve percent Woman Looking Trough Magnifying Glass Big Eye Blank Round Speech Bubble
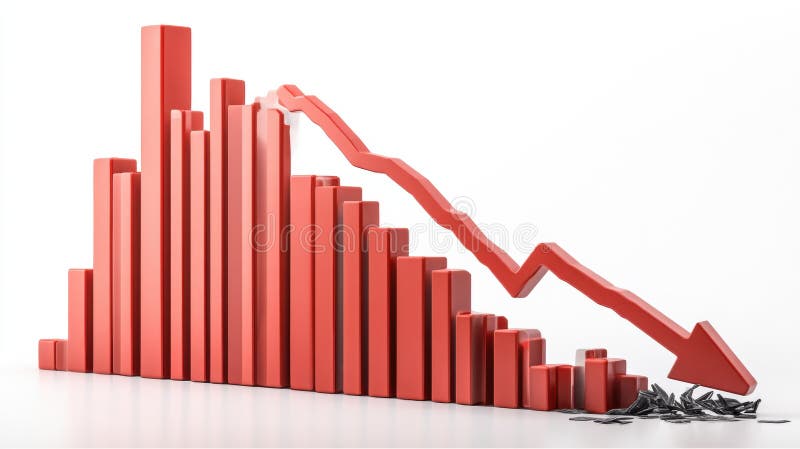
Free with trial A 3D rendering of a bar graph depicting a sharp decline in values. The red bars decrease in size, culminating in a large downward red arrow, symbolizing a significant economic downturn or market crash. The broken pieces at the bottom represent the loss or damage incurred. Arrow showing decrease illustrations Red Bar Graph Showing Decline. A 3D rendering of a bar graph depicting a sharp decline in values. The red bars decrease in size, culminating in a large downward red arrow, symbolizing a significant economic downturn or market crash. The broken pieces at the bottom represent the loss or damage incurred.
Free with trial Graph with a downward trend shows a decrease in profits. Arrow showing decrease vectors Money downward trend graph showing economic crisis. Graph with a downward trend shows a decrease in profits
Free with trial A conceptual illustration showing a financial bar chart in a steep decline. Arrow showing decrease vectors Declining Green Growth Bar Chart. A conceptual illustration showing a financial bar chart in a steep decline
Free with trial Crypto currency market plunge. Graph showing bitcoin price falling down. Vector illustration. Arrow showing decrease vectors Cryptocurrency market plunge. Vector illustration. Crypto currency market plunge. Graph showing bitcoin price falling down. Vector illustration.
Free with trial Concept image showing the appreciation and depreciation of the British pound. Arrow showing decrease vectors Concept image showing the appreciation and depreciation of the British pound
Free with trial Illustration showing in LED type graphic with words corona written in green and a increase arrow to show increase in corona cases. Arrow showing decrease illustrations Illustration showing LED type graphic to depict increase in corona cases. Illustration showing in LED type graphic with words corona written in green and a increase arrow to show increase in corona cases
Free with trial Stacks of gold coins decreasing with a red down arrow, representing economic crisis. Arrow showing decrease vectors Stacks of gold coins decreasing showing economic crisis. Stacks of gold coins decreasing with a red down arrow, representing economic crisis
Free with trial Oil barrel with candlestick chart showing downtrend oil market, concept. 3D rendering isolated on white background. Arrow showing decrease illustrations Oil barrel with candlestick chart showing downtrend oil market, concept. 3D rendering
Free with trial A modern flat design icon representing financial data analysis and market trends. This vector illustration features a combination of a green bar chart and a dark grey line graph, showing fluctuations in performance. An upward arrow indicates initial growth, followed by a volatile trend line symbolizing concepts like market instability, economic changes, profit and loss, or business analytics. This versatile graphic is perfect for infographics, financial reports, presentations, websites, and applications related to business, finance, statistics, and economics. Isolated on a white background for easy use. Arrow showing decrease vectors Financial Market Fluctuation Graph Icon. A modern flat design icon representing financial data analysis and market trends. This vector illustration features a combination of a green bar chart and a dark grey line graph, showing fluctuations in performance. An upward arrow indicates initial growth, followed by a volatile trend line symbolizing concepts like market instability, economic changes, profit and loss, or business analytics. This versatile graphic is perfect for infographics, financial reports, presentations, websites, and applications related to business, finance, statistics, and economics. Isolated on a white background for easy use.
Free with trial Gold coin with a dollar sign is next to a red arrow pointing down, representing economic decline. Arrow showing decrease illustrations Dollar coin value decreasing showing financial crisis. Gold coin with a dollar sign is next to a red arrow pointing down, representing economic decline
Free with trial This icon of a portfolio with three downward arrows represents the concept of investment losses. Arrow showing decrease vectors Portfolio money loss icon showing investment decrease. This icon of a portfolio with three downward arrows represents the concept of investment losses
Free with trial Laptop displaying a graph with a red arrow pointing down, illustrating a financial crisis. Arrow showing decrease vectors Laptop showing graph going down representing financial crisis. Laptop displaying a graph with a red arrow pointing down, illustrating a financial crisis
Free with trial Coupon with discount showing graph going down, simple black line vector icon. Arrow showing decrease illustrations Coupon with discount showing graph going down line icon. Coupon with discount showing graph going down, simple black line vector icon
Free with trial An isometric illustration depicting a blue bar chart showing growth, with a red arrow forming a slide that goes downwards, symbolizing a business decline or setback. Arrow showing decrease illustrations Business growth chart with a downward slide. An isometric illustration depicting a blue bar chart showing growth, with a red arrow forming a slide that goes downwards, symbolizing a business decline or setback
Free with trial Red arrow pointing down and the word down illuminated on a digital stock ticker display, indicating a market downturn. Arrow showing decrease illustrations Stock market crash showing downward trend on digital display. Red arrow pointing down and the word down illuminated on a digital stock ticker display, indicating a market downturn
Free with trial Line chart going down on a website, showing a negative trend in statistics. Arrow showing decrease illustrations Website showing a graph representing decreasing statistics. Line chart going down on a website, showing a negative trend in statistics
Free with trial Interactive touchscreen is showing a graph declining, which can be used for business or financial presentations. Arrow showing decrease vectors Interactive touchscreen showing graph declining icon cartoon vector. Interactive touchscreen is showing a graph declining, which can be used for business or financial presentations
Free with trial A clean, flat design illustration featuring a collection of icons related to social media engagement and data analysis. The set includes a pie chart, bar graphs showing upward trends, a line graph with a heart icon and an upward arrow, another line graph with data points, a speech bubble with the word 'LIKE' and abstract shapes, and a thumbs-up icon with a notification count. These graphics are ideal for representing concepts like growth, popularity, analytics, and user feedback in digital marketing, business reports, and web design. Arrow showing decrease illustrations Social Media Metrics and Data Visualization Icons. A clean, flat design illustration featuring a collection of icons related to social media engagement and data analysis. The set includes a pie chart, bar graphs showing upward trends, a line graph with a heart icon and an upward arrow, another line graph with data points, a speech bubble with the word 'LIKE' and abstract shapes, and a thumbs-up icon with a notification count. These graphics are ideal for representing concepts like growth, popularity, analytics, and user feedback in digital marketing, business reports, and web design.
Free with trial Red graph overlayed on cityscape background showing market downturn. Arrow showing decrease illustrations Red graph overlayed on cityscape background showing market downturn.
Free with trial Concept of business crisis with a flip chart showing a negative trend line graph. Arrow showing decrease illustrations Flip chart showing negative trend line graph on pink background. Concept of business crisis with a flip chart showing a negative trend line graph
Free with trial Directional Arrows Up and Down Showing Contrast and Balance. Arrow showing decrease vectors Directional Arrows Up and Down Showing Contrast and Balance
Free with trial Abstract graphic showing currency symbols and arrows to visually represent financial market changes and exchange rate fluctuations Ideal for illustrating finance topics. Arrow showing decrease illustrations Currency Exchange Rate Fluctuations Abstract Graphic. Abstract graphic showing currency symbols and arrows to visually represent financial market changes and exchange rate fluctuations Ideal for illustrating finance topics
Free with trial Writing note showing Low Cost Loans. Business concept for loan that has an interest rate below twelve percent Seamless Diagonal Violet Stripe Paint Slanting Line Repeat Pattern. Arrow showing decrease illustrations Writing note showing Low Cost Loans. Business photo showcasing loan that has an interest rate below twelve percent. Writing note showing Low Cost Loans. Business concept for loan that has an interest rate below twelve percent Seamless Diagonal Violet Stripe Paint Slanting Line Repeat Pattern
Free with trial A black and white icon depicting a bar chart with bars decreasing in height, indicating a significant downward trend. Arrow showing decrease illustrations Bar chart showing a sharp decline with downward arrow. A black and white icon depicting a bar chart with bars decreasing in height, indicating a significant downward trend
Free with trial Negative trend concept. Graph with an arrow pointed down. Vector, flat style, clip art. Arrow showing decrease vectors Young man is standing near flip chart pointing at the decreasing graph. Disappointed, unhappy, sad businessman. Business Failure. Negative trend concept. Graph with an arrow pointed down. Vector, flat style, clip art
Free with trial A 3D rendering depicts a sharp downturn in a stock market graph, visually representing a significant financial crash. The red arrow emphasizes the dramatic fall in value. Arrow showing decrease illustrations 3D Stock Market Crash Graph Showing Significant Decline. A 3D rendering depicts a sharp downturn in a stock market graph, visually representing a significant financial crash. The red arrow emphasizes the dramatic fall in value.
Free with trial Simple line art illustration of a bar graph with a downward trend, symbolizing negative growth. Arrow showing decrease illustrations Declining bar graph showing negative trend with arrow pointing down. Simple line art illustration of a bar graph with a downward trend, symbolizing negative growth
Free with trial Descending analytic graph showing loss and business downfall. Data analytics descendant icon on white background. Loss bar chart logo concept. chart with bars declining icon for your web site design. Arrow showing decrease vectors Descending analytic graph showing loss and business downfall
Free with trial White jigsaw puzzle with missing piece showing the word 'DEPRECIATION' on a black leather textured background. Arrow showing decrease illustrations White jigsaw puzzle with missing piece showing the word \'DEPRECIATION\'. White jigsaw puzzle with missing piece showing the word 'DEPRECIATION' on a black leather textured background.
Free with trial The chart showing financial crisis - 3d rendering. Arrow showing decrease illustrations The chart showing financial crisis - 3d rendering
Free with trial A simple black and white illustration of a downward trend graph, showing a decline. The graph is hand-drawn. Arrow showing decrease illustrations Hand-drawn Black Downward Trend Graph on White Background. A simple black and white illustration of a downward trend graph, showing a decline. The graph is hand-drawn
Free with trial The chart showing financial crisis - 3d rendering. Arrow showing decrease illustrations The chart showing financial crisis - 3d rendering
Free with trial Two bar charts are displayed side by side. One shows a clear upward trend with a green arrow, while the other shows a downward trend with a red arrow. Arrow showing decrease illustrations Bar charts showing contrasting upward and downward trends. Two bar charts are displayed side by side. One shows a clear upward trend with a green arrow, while the other shows a downward trend with a red arrow
Free with trial Two bar charts, one green showing growth and one red showing decline, with trend lines and arrows. Arrow showing decrease illustrations Bar charts showing upward and downward trends. Two bar charts, one green showing growth and one red showing decline, with trend lines and arrows
Free with trial Businessman showing graph falling down, geometric pattern. Arrow showing decrease illustrations Falling down of economic activity, geometric pattern. Businessman showing graph falling down, geometric pattern
Free with trial A 3D bar graph with a red line graph indicating a significant decrease, isolated on a clean white background. Arrow showing decrease illustrations Bar graph showing downward trend isolated on white background. A 3D bar graph with a red line graph indicating a significant decrease, isolated on a clean white background
Free with trial The chart showing financial crisis - 3d rendering. Arrow showing decrease illustrations Chart showing financial crisis - 3d rendering
Free with trial Falling red arrows intersect with a black digital display board showing financial information, creating a dramatic and concerning mood ideal for illustrating market decline or economic downturn. Arrow showing decrease illustrations Red Arrows Indicating Falling Prices on Digital Display Board. Falling red arrows intersect with a black digital display board showing financial information, creating a dramatic and concerning mood ideal for illustrating market decline or economic downturn
Free with trial A visual representation of negative financial performance, illustrating a declining trend in business or market data with a prominent red arrow indicating a downward movement. Arrow showing decrease illustrations Bar chart showing a downward trend with a red arrow. A visual representation of negative financial performance, illustrating a declining trend in business or market data with a prominent red arrow indicating a downward movement
Free with trial The chart showing financial crisis - 3d rendering. Arrow showing decrease illustrations The chart showing financial crisis - 3d rendering
Free with trial The chart showing financial crisis - 3d rendering. Arrow showing decrease illustrations The chart showing financial crisis - 3d rendering
Free with trial Conceptual illustration of a document showing market volatility with up and down arrows, and a dollar symbol for currency. Arrow showing decrease illustrations Document with up and down arrows showing market volatility and dollar currency sign. Conceptual illustration of a document showing market volatility with up and down arrows, and a dollar symbol for currency
Free with trial Worried businessman with financial graph showing sharp decline. Suitable for themes of crisis, loss, economic downturn, investment failure, and recession. Arrow showing decrease vectors Worried businessman with financial graph showing sharp decline. Suitable for themes of crisis, loss, economic downturn, investment
Free with trial A falling graph displayed on an easel, isolated on a white background. The image represents a negative trend, indicating decline in business or finance. Arrow showing decrease vectors Illustration of falling graph on easel isolated on transparent background, showing negative trend. A falling graph displayed on an easel, isolated on a white background. The image represents a negative trend, indicating decline in business or finance
Free with trial A man in a dark suit and tie holds out his hands, with glowing white graphics showing an upward arrow and the word QUALITY above a percentage sign, and a downward arrow and the word COST above his other hand. A laptop is visible on the left. Created Ai. Arrow showing decrease illustrations Businessman presenting quality increase and cost decrease suit hands. A man in a dark suit and tie holds out his hands, with glowing white graphics showing an upward arrow and the word QUALITY above a percentage sign, and a downward arrow and the word COST above his other hand. A laptop is visible on the left. Created Ai
Free with trial Laptop showing downward stock chart on screen, realistic graphic style, on white office desk background, concept of financial crisis. 3D Rendering. Arrow showing decrease illustrations Laptop displaying falling stock market chart on office desk showing financial crisis and global market crash in business. Laptop showing downward stock chart on screen, realistic graphic style, on white office desk background, concept of financial crisis. 3D Rendering
Free with trial A bold red graph showing a sharp and persistent decline in financial performance, suggesting potential losses and instability in the market. Arrow showing decrease illustrations A bold red graph showing a sharp and persistent decline in financial performance
Free with trial Gold coins with bitcoin and dollar signs showing contrasting financial trends with long shadows on a blue background. Arrow showing decrease illustrations Bitcoin increasing while dollar decreasing showing cryptocurrency investment success. Gold coins with bitcoin and dollar signs showing contrasting financial trends with long shadows on a blue background
Free with trial Concept of currency devaluation. Electric board showing dollar currency depreciation wirg red line going down. Arrow showing decrease illustrations Electric board showing dollar currency depreciation wirg red line going down.
Free with trial Vector illustration concept of businessman character holding light bulb and showing sales bar graph moving down. Black outline. Arrow showing decrease vectors Vector illustration of businessman character holding light bulb and showing sales bar graph moving down. Black outline
Free with trial Decreasing red arrows showing the deterioration of the economy or the fall of stocks on the stock exchange. Arrow showing decrease illustrations Decreasing red arrows showing the deterioration of the economy or the fall of stocks on the stock exchange
Free with trial Vector illustration of the chart showing falling dollar oil prices with oilwell mining machinery in the background. Arrow showing decrease vectors Vector illustration of chart showing falling dollar oil prices with oilwell mining machinery in background
Free with trial Financial chart with red and yellow candlesticks and a downward yellow arrow, on a dark background, concept of market crash and recession. 3D Rendering. Arrow showing decrease illustrations Abstract financial chart with red and yellow candlesticks showing a downward trend and falling market data on dark background. 3D. Financial chart with red and yellow candlesticks and a downward yellow arrow, on a dark background, concept of market crash and recession. 3D Rendering
Free with trial A man in a blue suit holds a glowing blue bar graph showing increasing quality and decreasing cost with arrows and text. Arrow showing decrease illustrations Businessman holding glowing bar graph showing cost reduction and quality increase. A man in a blue suit holds a glowing blue bar graph showing increasing quality and decreasing cost with arrows and text
Free with trial Text sign showing Low Cost Loans. Business photo text loan that has an interest rate below twelve percent Isolated Megaphone Pointing Upward to Empty Text Box in Quotation Marks. Arrow showing decrease illustrations Text sign showing Low Cost Loans. Conceptual photo loan that has an interest rate below twelve percent Isolated. Text sign showing Low Cost Loans. Business photo text loan that has an interest rate below twelve percent Isolated Megaphone Pointing Upward to Empty Text Box in Quotation Marks
Free with trial Red Stock Market Chart Showing Loss, Downward Trend, and Bear Market, Financial Crisis Concept. , Generated by AI. Arrow showing decrease illustrations Red Stock Market Chart Showing Loss, Downward Trend, and Bear Market, Financial Crisis Concept.
Free with trial Illustration shows a stock market decline with candlestick charts and downward trending arrow. The design features a light blue background and a simple layout. Useful for financial articles, reports, or any material illustrating loss, recession, or negative trends in commercial sector. Arrow showing decrease illustrations Falling stock market chart showing economic downturn and financial loss. Illustration shows a stock market decline with candlestick charts and downward trending arrow. The design features a light blue background and a simple layout. Useful for financial articles, reports, or any material illustrating loss, recession, or negative trends in commercial sector
Free with trial A red graph showing a downward trend with an arrow pointing down, isolated against a white area. It represents decline, loss, or a negative trend in business, finance, or the economy. Symbolizes market risk. Arrow showing decrease illustrations Red graph with downward trend isolated on white background. use cases: business, finance. A red graph showing a downward trend with an arrow pointing down, isolated against a white area. It represents decline, loss, or a negative trend in business, finance, or the economy. Symbolizes market risk
Free with trial Vertical collage picture of mini black white colors guy clueless showing huge negative balance calculator arrows down isolated on creative background. Arrow showing decrease illustrations Vertical collage picture of mini black white colors guy clueless showing huge negative balance calculator arrows down