Free with trial Text sign showing Low Cost Loans. Business photo showcasing loan that has an interest rate below twelve percent Colorful Clustered 3D Bar Chart Graph Diagram in Perspective with Two Arrows. Arrow showing decrease illustrations Text sign showing Low Cost Loans. Conceptual photo loan that has an interest rate below twelve percent Colorful. Text sign showing Low Cost Loans. Business photo showcasing loan that has an interest rate below twelve percent Colorful Clustered 3D Bar Chart Graph Diagram in Perspective with Two Arrows
Free with trial Text sign showing Low Cost Loans. Business photo text loan that has an interest rate below twelve percent Two White Businessmen Colleagues with Brief Cases Sharing Idea Solution. Arrow showing decrease illustrations Text sign showing Low Cost Loans. Conceptual photo loan that has an interest rate below twelve percent Two White. Text sign showing Low Cost Loans. Business photo text loan that has an interest rate below twelve percent Two White Businessmen Colleagues with Brief Cases Sharing Idea Solution
Free with trial Conceptual hand writing showing Interest Rate. Concept meaning percentage of principal charged by the lender to borrower Businessman with Eyeglasses Riding Crooked Arrow Pointing Up. Arrow showing decrease illustrations Conceptual hand writing showing Interest Rate. Business photo text percentage of principal charged by the lender to. Conceptual hand writing showing Interest Rate. Concept meaning percentage of principal charged by the lender to borrower Businessman with Eyeglasses Riding Crooked Arrow Pointing Up
Free with trial A detailed financial chart showing business data analysis and market trend with upward arrow sign. Arrow showing decrease illustrations Financial chart business data analysis and market trend view isolated on transparent background. a detailed financial chart showing business data analysis and market trend with upward arrow sign
Free with trial A stylized illustration showing a man painting a downward trending stock market chart symbolizing financial loss and market decline in bright colors. Arrow showing decrease illustrations Man paints declining stock market graph with green showing the downturn in a stylized illustration. A stylized illustration showing a man painting a downward trending stock market chart symbolizing financial loss and market decline in bright colors.
Free with trial Writing note showing Low Cost Loans. Business concept for loan that has an interest rate below twelve percent Hand Holding Megaphone with Wide Beam Extending the Volume. Arrow showing decrease illustrations Writing note showing Low Cost Loans. Business photo showcasing loan that has an interest rate below twelve percent Hand. Writing note showing Low Cost Loans. Business concept for loan that has an interest rate below twelve percent Hand Holding Megaphone with Wide Beam Extending the Volume
Free with trial Text sign showing Low Cost Loans, Business approach loan that has an interest rate below twelve percent. Arrow showing decrease illustrations Text sign showing Low Cost Loans. Conceptual photo loan that has an interest rate below twelve percent. Text sign showing Low Cost Loans, Business approach loan that has an interest rate below twelve percent
Free with trial Domino effect concept icon showing a declining bar chart representing financial crisis and recession. Arrow showing decrease vectors Domino effect concept icon showing a declining bar chart representing financial crisis and recession
Free with trial Vector illustration concept of businessman character holding light bulb and showing sales bar graph moving down. Color and black outlines. Arrow showing decrease vectors Vector illustration of businessman character holding light bulb and showing sales bar graph moving down. Color and black outlines
Free with trial This image features six black bar chart icons with red and green arrows showing increase, decrease, and uncertainty trends. It is a clear, simple vector for business or data visuals, informative and clean. Generative AI. Arrow showing decrease vectors Set of six vector bar chart icons with arrows indicating trends and question mark in black and colored design elements. This image features six black bar chart icons with red and green arrows showing increase, decrease, and uncertainty trends. It is a clear, simple vector for business or data visuals, informative and clean. Generative AI
Free with trial Illustrating a financial downturn with descending blocks. The image conveys a sense of economic decline, investment risk, and potential market instability. A visual representation of financial loss. Arrow showing decrease illustrations Stock market decline concept showing decrease in value and investment risk with downward trend diagram. Illustrating a financial downturn with descending blocks. The image conveys a sense of economic decline, investment risk, and potential market instability. A visual representation of financial loss.
Free with trial An image showing a downward trending chart with a hand pointing to the decline, symbolizing financial loss, economic downturn, and a stock market crash. It represents business recession and investment risk. Arrow showing decrease illustrations Stock market crash financial crisis business recession economic downturn investment loss chart analysis. an image showing a downward trending chart with a hand pointing to the decline, symbolizing financial loss, economic downturn, and a stock market crash. It represents business recession and investment risk.
Free with trial Generative ai, The image shows a blue grid with a red arrow pointing downward, indicating a decline, against a blue background, highlighting the concept of a downward trend. Arrow showing decrease illustrations The image is a stock market chart showing a red arrow pointing down on a blue grid background with blue bar graphs. The arrow is. generative ai, The image shows a blue grid with a red arrow pointing downward, indicating a decline, against a blue background, highlighting the concept of a downward trend
Free with trial A red themed illustration showing a stock market crash with a downtrend graph and arrows pointing downwards. it represents financial crisis, recession, and business failure. investment loss is shown. Arrow showing decrease illustrations Red stock market crash graph downtrend financial crisis recession loss investment chart business failure. a red themed illustration showing a stock market crash with a downtrend graph and arrows pointing downwards. it represents financial crisis, recession, and business failure. investment loss is shown
Free with trial Writing note showing Low Cost Loans. Business concept for loan that has an interest rate below twelve percent Asymmetrical format pattern object outline multicolor design. Arrow showing decrease illustrations Writing note showing Low Cost Loans. Business photo showcasing loan that has an interest rate below twelve percent Asymmetrical. Writing note showing Low Cost Loans. Business concept for loan that has an interest rate below twelve percent Asymmetrical format pattern object outline multicolor design
Free with trial Computer display showing a downward trending graph depicting loss or decline in business or finance hand drawn. Arrow showing decrease vectors Computer display showing a downward trending graph depicting loss or decline in business or finance hand drawn
Free with trial Text showing inspiration Low Cost Loans, Concept meaning loan that has an interest rate below twelve percent. Arrow showing decrease illustrations Inspiration showing sign Low Cost Loans. Business showcase loan that has an interest rate below twelve percent. Text showing inspiration Low Cost Loans, Concept meaning loan that has an interest rate below twelve percent
Free with trial Icon showing 3d rendered blue downward arrow icon with subtle shadow on white background. Arrow showing decrease illustrations 3D Rendered Blue Downward Arrow Icon with Subtle Shadow on White Background Keywords: arrow, down, direction, symbol, icon, blue. Icon showing 3d rendered blue downward arrow icon with subtle shadow on white background
Free with trial Text sign showing Low Cost Loans. Business photo showcasing loan that has an interest rate below twelve percent Whiteboard rectangle frame empty space attached surface chain blank panel. Arrow showing decrease illustrations Text sign showing Low Cost Loans. Conceptual photo loan that has an interest rate below twelve percent Whiteboard rectangle frame. Text sign showing Low Cost Loans. Business photo showcasing loan that has an interest rate below twelve percent Whiteboard rectangle frame empty space attached surface chain blank panel
Free with trial Hand drawn bar graph showing a downward trend with a sale tag for discounts price reductions and market decline. Arrow showing decrease vectors Hand drawn bar graph showing a downward trend with a sale tag for discounts price reductions and market decline
Free with trial This black and white illustration features various battery icons, a lightning bolt, and a clock, conveying themes of energy, time, and alerts in a clean, modern design. Arrow showing decrease vectors Illustration of battery icons showing different levels of charge and a lightning bolt, , in black and white color scheme. This black and white illustration features various battery icons, a lightning bolt, and a clock, conveying themes of energy, time, and alerts in a clean, modern design
Free with trial Writing note showing Trends. Business concept for General projected directions of something according to time Hand Holding Tablet under the Progressive Arrow Going Upward. Arrow showing decrease illustrations Writing note showing Trends. Business photo showcasing General projected directions of something according to time Hand. Writing note showing Trends. Business concept for General projected directions of something according to time Hand Holding Tablet under the Progressive Arrow Going Upward
Free with trial Up and Down sign with green and red arrows vector. Design vector illustration concept of sales bar chart symbol icon with arrow moving down and sales bar chart with arrow moving up. Arrow showing decrease illustrations Up and Down sign with green and red arrows vector. Design vector illustration concept of sales bar chart icon. Up and Down sign with green and red arrows vector. Design vector illustration concept of sales bar chart symbol icon with arrow moving down and sales bar chart with arrow moving up.
Free with trial Conceptual display Sanitizer, Internet Concept liquid or gel generally used to decrease infectious agents Lady Walking Towards Mountains With An Arrow Marking Success. Arrow showing decrease illustrations Inspiration showing sign Sanitizer. Business overview liquid or gel generally used to decrease infectious agents Lady. Conceptual display Sanitizer, Internet Concept liquid or gel generally used to decrease infectious agents Lady Walking Towards Mountains With An Arrow Marking Success
Free with trial Data funnel filtering process showing percentage drop in prices or conversion rate on isolated black and white design. Arrow showing decrease vectors Data funnel filtering process showing percentage drop in prices or conversion rate on isolated black and white design
Free with trial This image illustrates a financial chart showing a downward trend with a dollar sign, symbolizing economic decline, investment losses, and market instability. Arrow showing decrease vectors Vector art of financial chart with downward trend and dollar sign, indicating economic decline and investment loss in the market. This image illustrates a financial chart showing a downward trend with a dollar sign, symbolizing economic decline, investment losses, and market instability
Free with trial Conceptual hand writing showing Trends. Concept meaning General projected directions of something according to time Direction to Press or Click Command Key with Arrow Cursor. Arrow showing decrease illustrations Conceptual hand writing showing Trends. Business photo text General projected directions of something according to time. Conceptual hand writing showing Trends. Concept meaning General projected directions of something according to time Direction to Press or Click Command Key with Arrow Cursor
Free with trial Writing note showing Low Cost Loans. Business concept for loan that has an interest rate below twelve percent Businessmen Coworker Conference Call Discussion Mobile Phone. Arrow showing decrease illustrations Writing note showing Low Cost Loans. Business photo showcasing loan that has an interest rate below twelve percent. Writing note showing Low Cost Loans. Business concept for loan that has an interest rate below twelve percent Businessmen Coworker Conference Call Discussion Mobile Phone
Free with trial Writing note showing Oil Consumption. Business concept for This entry is the total oil consumed in barrels per day Investment Icons of Pie and Line Chart with Arrow Going Up. Arrow showing decrease illustrations Writing note showing Oil Consumption. Business photo showcasing This entry is the total oil consumed in barrels per day. Writing note showing Oil Consumption. Business concept for This entry is the total oil consumed in barrels per day Investment Icons of Pie and Line Chart with Arrow Going Up
Free with trial Dropping arrows showing decreasing trend in economy in global crisis or downtrend of stocks on the stock exchange in USA. Arrow showing decrease illustrations Dropping arrows showing decreasing trend in economy or downtrend on the stock exchange in USA. Dropping arrows showing decreasing trend in economy in global crisis or downtrend of stocks on the stock exchange in USA.
Free with trial Colorful line graph showing growth and decline of different data from 2018, 2019 and 2020, providing a visual representation of performance trends over time. Arrow showing decrease vectors Colorful line graph showing growth and decline of different data from 2018, 2019 and 2020, providing a visual
Free with trial The image depicts a 3D bar graph showing a decreasing trend over a period of years. The y-axis represents values ranging from 0 to 100,000, while the x-axis represents years from 2000 to 2025. The bars start high in 2000 and gradually decrease, indicating a downward trend. An arrow at the end of the curve suggests a continuing decline. Arrow showing decrease illustrations Decreasing trend over time. The image depicts a 3D bar graph showing a decreasing trend over a period of years. The y-axis represents values ranging from 0 to. The image depicts a 3D bar graph showing a decreasing trend over a period of years. The y-axis represents values ranging from 0 to 100,000, while the x-axis represents years from 2000 to 2025. The bars start high in 2000 and gradually decrease, indicating a downward trend. An arrow at the end of the curve suggests a continuing decline
Free with trial A businessman is shown with a downward trending graph, indicating financial loss. The image conveys a sense of economic downturn, recession, or market failure. It highlights business challenges and financial risks. Arrow showing decrease illustrations Business man showing financial graph with downward trend and arrow indicating loss in market 2024. A businessman is shown with a downward trending graph, indicating financial loss. The image conveys a sense of economic downturn, recession, or market failure. It highlights business challenges and financial risks.
Free with trial Dropping arrows showing decreasing trend in economy in global crisis or downtrend of stocks on the stock exchange in Syria. Arrow showing decrease illustrations Dropping arrows showing decreasing trend in economy or downtrend on the stock exchange in Syria. Dropping arrows showing decreasing trend in economy in global crisis or downtrend of stocks on the stock exchange in Syria.
Free with trial Dropping arrows showing decreasing trend in economy in global crisis or downtrend of stocks on the stock exchange in Japan. Arrow showing decrease illustrations Dropping arrows showing decreasing trend in economy or downtrend on the stock exchange in Japan. Dropping arrows showing decreasing trend in economy in global crisis or downtrend of stocks on the stock exchange in Japan.
Free with trial Dropping arrows showing decreasing trend in economy in global crisis or downtrend of stocks on the stock exchange in Litva. Arrow showing decrease illustrations Dropping arrows showing decreasing trend in economy or downtrend on the stock exchange in Litva. Dropping arrows showing decreasing trend in economy in global crisis or downtrend of stocks on the stock exchange in Litva
Free with trial Dropping arrows showing decreasing trend in economy in global crisis or downtrend of stocks on the stock exchange in Italy. Arrow showing decrease illustrations Dropping arrows showing decreasing trend in economy or downtrend on the stock exchange in Italy. Dropping arrows showing decreasing trend in economy in global crisis or downtrend of stocks on the stock exchange in Italy.
Free with trial Dropping arrows showing decreasing trend in economy in global crisis or downtrend of stocks on the stock exchange in Sweden. Arrow showing decrease illustrations Dropping arrows showing decreasing trend in economy or downtrend on the stock exchange in Sweden. Dropping arrows showing decreasing trend in economy in global crisis or downtrend of stocks on the stock exchange in Sweden
Free with trial Dropping arrows showing decreasing trend in economy in global crisis or downtrend of stocks on the stock exchange in Island. Arrow showing decrease illustrations Dropping arrows showing decreasing trend in economy or downtrend on the stock exchange in Island. Dropping arrows showing decreasing trend in economy in global crisis or downtrend of stocks on the stock exchange in Island
Free with trial Dropping arrows showing decreasing trend in economy in global crisis or downtrend of stocks on the stock exchange in Belgie. Arrow showing decrease illustrations Dropping arrows showing decreasing trend in economy or downtrend on the stock exchange in Belgie. Dropping arrows showing decreasing trend in economy in global crisis or downtrend of stocks on the stock exchange in Belgie.
Free with trial Dropping arrows showing decreasing trend in economy in global crisis or downtrend of stocks on the stock exchange in England. Arrow showing decrease illustrations Dropping arrows showing decreasing trend in economy or downtrend on the stock exchange in England. Dropping arrows showing decreasing trend in economy in global crisis or downtrend of stocks on the stock exchange in England.
Free with trial Dropping arrows showing decreasing trend in economy in global crisis or downtrend of stocks on the stock exchange in Bulgary. Arrow showing decrease illustrations Dropping arrows showing decreasing trend in economy or downtrend on the stock exchange in Bulgary. Dropping arrows showing decreasing trend in economy in global crisis or downtrend of stocks on the stock exchange in Bulgary.
Free with trial Dropping arrows showing decreasing trend in economy in global crisis or downtrend of stocks on the stock exchange in Tunisia. Arrow showing decrease illustrations Dropping arrows showing decreasing trend in economy or downtrend on the stock exchange in Tunisia. Dropping arrows showing decreasing trend in economy in global crisis or downtrend of stocks on the stock exchange in Tunisia
Free with trial Dropping arrows showing decreasing trend in economy in global crisis or downtrend of stocks on the stock exchange in Switzerland. Arrow showing decrease illustrations Dropping arrows showing decreasing trend in economy or downtrend on stock exchange in Switzerland. Dropping arrows showing decreasing trend in economy in global crisis or downtrend of stocks on the stock exchange in Switzerland
Free with trial Dropping arrows showing decreasing trend in economy in global crisis or downtrend of stocks on the stock exchange in North Korea. Arrow showing decrease illustrations Dropping arrows showing decreasing trend in economy or downtrend on stock exchange in North Korea. Dropping arrows showing decreasing trend in economy in global crisis or downtrend of stocks on the stock exchange in North Korea
Free with trial Dropping arrows showing decreasing trend in economy in global crisis or downtrend of stocks on the stock exchange in Ukraine. Arrow showing decrease illustrations Dropping arrows showing decreasing trend in economy or downtrend on the stock exchange in Ukraine. Dropping arrows showing decreasing trend in economy in global crisis or downtrend of stocks on the stock exchange in Ukraine.
Free with trial Dropping arrows showing decreasing trend in economy in global crisis or downtrend of stocks on the stock exchange in Germany. Arrow showing decrease illustrations Dropping arrows showing decreasing trend in economy or downtrend on the stock exchange in Germany. Dropping arrows showing decreasing trend in economy in global crisis or downtrend of stocks on the stock exchange in Germany.
Free with trial Dropping arrows showing decreasing trend in economy in global crisis or downtrend of stocks on the stock exchange in Austria. Arrow showing decrease illustrations Dropping arrows showing decreasing trend in economy or downtrend on the stock exchange in Austria. Dropping arrows showing decreasing trend in economy in global crisis or downtrend of stocks on the stock exchange in Austria
Free with trial Dropping arrows showing decreasing trend in economy in global crisis or downtrend of stocks on the stock exchange in Belarus. Arrow showing decrease illustrations Dropping arrows showing decreasing trend in economy or downtrend on the stock exchange in Belarus. Dropping arrows showing decreasing trend in economy in global crisis or downtrend of stocks on the stock exchange in Belarus.
Free with trial Dropping arrows showing decreasing trend in economy in global crisis or downtrend of stocks on the stock exchange in Singapore. Arrow showing decrease illustrations Dropping arrows showing decreasing trend in economy or downtrend on the stock exchange in Singapore. Dropping arrows showing decreasing trend in economy in global crisis or downtrend of stocks on the stock exchange in Singapore
Free with trial Dropping arrows showing decreasing trend in economy in global crisis or downtrend of stocks on the stock exchange in Uzbekistan. Arrow showing decrease illustrations Dropping arrows showing decreasing trend in economy or downtrend on the stock exchange in Uzbekistan. Dropping arrows showing decreasing trend in economy in global crisis or downtrend of stocks on the stock exchange in Uzbekistan
Free with trial Dropping arrows showing decreasing trend in economy in global crisis or downtrend of stocks on the stock exchange in Czech Republic. Arrow showing decrease illustrations Dropping arrows showing decreasing trend in economy or downtrend on stock exchange in Czech Republic. Dropping arrows showing decreasing trend in economy in global crisis or downtrend of stocks on the stock exchange in Czech Republic.
Free with trial Dropping arrows showing decreasing trend in economy in global crisis or downtrend of stocks on the stock exchange in New Zealand. Arrow showing decrease illustrations Dropping arrows showing decreasing trend in economy or downtrend on the stock exchange in New Zealand. Dropping arrows showing decreasing trend in economy in global crisis or downtrend of stocks on the stock exchange in New Zealand.
Free with trial Dropping arrows showing decreasing trend in economy in global crisis or downtrend of stocks on the stock exchange in USA. Arrow showing decrease illustrations Dropping arrows showing decreasing trend in economy or downtrend on the stock exchange in USA. Dropping arrows showing decreasing trend in economy in global crisis or downtrend of stocks on the stock exchange in USA.
Free with trial Dropping arrows showing decreasing trend in economy or downtrend on the stock exchange in Yemen. Arrow showing decrease illustrations Dropping arrows showing decreasing trend in economy or downtrend on the stock exchange in Yemen
Free with trial Dropping arrows showing decreasing trend in economy or downtrend on the stock exchange in Azerbaijan. Arrow showing decrease illustrations Dropping arrows showing decreasing trend in economy or downtrend on the stock exchange in Azerbaijan
Free with trial Coronavirus economic crisis isometric vector illustration - business analysis graphic with falling trend on mobile phone. Broken red arrow and coin showing fall of economy and financial indicators. Arrow showing decrease vectors Coronavirus economic crisis isometric vector illustration - business analysis graphic with falling trend. Coronavirus economic crisis isometric vector illustration - business analysis graphic with falling trend on mobile phone. Broken red arrow and coin showing fall of economy and financial indicators.
Free with trial Coronavirus economic and financial crisis isometric vector illustration. Falling graph with red arrow breaking hole - business chart showing fall and crisis of economy, finance because of corona virus. Arrow showing decrease vectors Coronavirus economic and financial crisis isometric vector illustration.
Free with trial Dropping arrows showing decreasing trend in economy in global crisis or downtrend of stocks on the stock exchange in Spain. March 2022, San Francisco, USA. Arrow showing decrease illustrations Dropping arrows showing decreasing trend in economy or downtrend on the stock exchange in Spain. Dropping arrows showing decreasing trend in economy in global crisis or downtrend of stocks on the stock exchange in Spain. March 2022, San Francisco, USA
Free with trial Dropping arrows showing decreasing trend in economy in global crisis or downtrend of stocks on the stock exchange in Mexico, April 2022, San Francisco, USA. Arrow showing decrease illustrations Dropping arrows showing decreasing trend in economy or downtrend on the stock exchange in Mexico. Dropping arrows showing decreasing trend in economy in global crisis or downtrend of stocks on the stock exchange in Mexico, April 2022, San Francisco, USA
Free with trial Dropping arrows showing decreasing trend in economy in global crisis or downtrend of stocks on the stock exchange in Taiwan, April 2022, San Francisco, USA. Arrow showing decrease illustrations Dropping arrows showing decreasing trend in economy or downtrend on the stock exchange in Taiwan. Dropping arrows showing decreasing trend in economy in global crisis or downtrend of stocks on the stock exchange in Taiwan, April 2022, San Francisco, USA
Free with trial Downtrend of red arrows showing decreasing in economy in Kazakhstan, March 2022, San Francisco, USA. Arrow showing decrease illustrations Downtrend of red arrows showing decreasing in economy in Kazakhstan, March 2022, San Francisco, USA
Free with trial Dropping arrows showing decreasing trend in economy in global crisis or downtrend of stocks on the stock exchange in Israel. March 2022, San Francisco, USA. Arrow showing decrease illustrations Dropping arrows showing decreasing trend in economy or downtrend on the stock exchange in Israel. Dropping arrows showing decreasing trend in economy in global crisis or downtrend of stocks on the stock exchange in Israel. March 2022, San Francisco, USA
Free with trial Dropping arrows showing decreasing trend in economy in global crisis or downtrend of stocks on the stock exchange in Slovakia, March 2022, San Francisco, USA. Arrow showing decrease illustrations Dropping arrows showing decreasing trend in economy or downtrend on the stock exchange in Slovakia. Dropping arrows showing decreasing trend in economy in global crisis or downtrend of stocks on the stock exchange in Slovakia, March 2022, San Francisco, USA
Free with trial Dropping arrows showing decreasing trend in economy in global crisis or downtrend of stocks on the stock exchange in Saudi Arabia, March 2022, San Francisco, USA. Arrow showing decrease illustrations Dropping arrows showing decreasing trend in economy or downtrend on stock exchange in Saudi Arabia. Dropping arrows showing decreasing trend in economy in global crisis or downtrend of stocks on the stock exchange in Saudi Arabia, March 2022, San Francisco, USA
Free with trial PRAGUE, CZECH REPUBLIC - MARCH 30 2022: Dropping arrows showing decreasing trend in economy in global crisis or downtrend of stocks on the stock exchange in Netherlands. Arrow showing decrease illustrations Dropping arrows showing decreasing trend in economy or downtrend on the stock exchange in Netherlands. PRAGUE, CZECH REPUBLIC - MARCH 30 2022: Dropping arrows showing decreasing trend in economy in global crisis or downtrend of stocks on the stock exchange in Netherlands
Free with trial Dropping arrows showing decreasing trend in economy in global crisis or downtrend of stocks on the stock exchange in Afghanistan. March 2022, San Francisco, USA. Arrow showing decrease illustrations Dropping arrows showing decreasing trend in economy or downtrend on the stock exchange in Afghanistan. Dropping arrows showing decreasing trend in economy in global crisis or downtrend of stocks on the stock exchange in Afghanistan. March 2022, San Francisco, USA
Free with trial Dropping arrows showing decreasing trend in economy in global crisis or downtrend of stocks on the stock exchange in Turkmenistan, March 2022, San Francisco, USA. Arrow showing decrease illustrations Dropping arrows showing decreasing trend in economy or downtrend on the stock exchange in Turkmenistan. Dropping arrows showing decreasing trend in economy in global crisis or downtrend of stocks on the stock exchange in Turkmenistan, March 2022, San Francisco, USA
Free with trial PRAGUE, CZECH REPUBLIC - MARCH 30 2022: Dropping arrows showing decreasing trend in economy in global crisis or downtrend of stocks on the stock exchange in Turkey. Arrow showing decrease illustrations Dropping arrows showing decreasing trend in economy or downtrend on the stock exchange in Turkey. PRAGUE, CZECH REPUBLIC - MARCH 30 2022: Dropping arrows showing decreasing trend in economy in global crisis or downtrend of stocks on the stock exchange in Turkey
Free with trial Dropping arrows showing decreasing trend in economy in global crisis or downtrend of stocks on the stock exchange in Canada. March 2022, San Francisco, USA. Arrow showing decrease illustrations Dropping arrows showing decreasing trend in economy or downtrend on the stock exchange in Canada. Dropping arrows showing decreasing trend in economy in global crisis or downtrend of stocks on the stock exchange in Canada. March 2022, San Francisco, USA
Free with trial Dropping arrows showing decreasing trend in economy in global crisis or downtrend of stocks on the stock exchange in Canada. March 2022, San Francisco, USA. Arrow showing decrease illustrations Dropping arrows showing decreasing trend in economy or downtrend on the stock exchange in Canada. Dropping arrows showing decreasing trend in economy in global crisis or downtrend of stocks on the stock exchange in Canada. March 2022, San Francisco, USA
Free with trial Graph showing decrease in profits or earnings in 3D. Arrow showing decrease illustrations Column graph 3d. Graph showing decrease in profits or earnings in 3D
Free with trial Cute bird businessman showing different graph stats from success to failure. Arrow showing decrease vectors Bird Business Concept. Cute bird businessman showing different graph stats from success to failure
Free with trial Think different, stand out from crowd,business concepts. illustration. Arrow showing decrease vectors Think different
Free with trial Graph showing decrease in profits or earnings in 3D. Arrow showing decrease illustrations Column graph 3d. Graph showing decrease in profits or earnings in 3D
Free with trial A 3d illustration showing arrows indicating the increasing or decreasing value of a Dollar, isolated on a white background. Arrow showing decrease vectors Dollar Value Indicators. A 3d illustration showing arrows indicating the increasing or decreasing value of a Dollar, isolated on a white background.
Free with trial A 3d illustration showing arrows indicating the increasing or decreasing value of a Euro, isolated on a white background. Arrow showing decrease vectors Euro Value Indicators. A 3d illustration showing arrows indicating the increasing or decreasing value of a Euro, isolated on a white background.
Free with trial A Colourful 3d Rendered Concept Illustration showing the housing market decline on a Blackboard. Arrow showing decrease illustrations Blackboard Housing Market Decline. A Colourful 3d Rendered Concept Illustration showing the housing market decline on a Blackboard
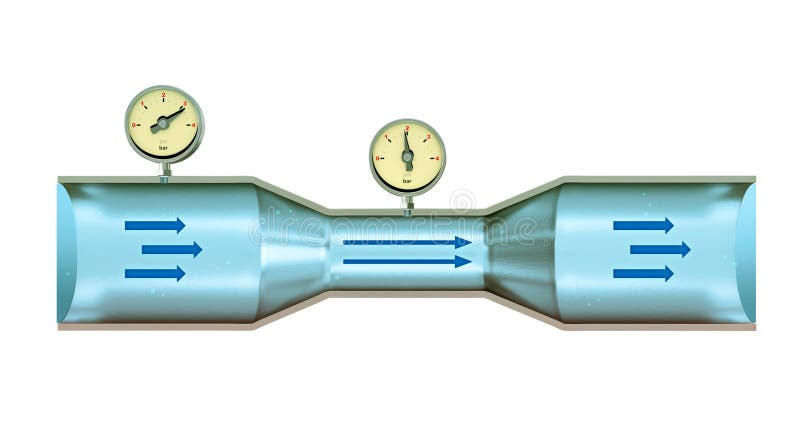
Free with trial Fluid dynamics diagram showing a cross-section of a Venturi tube with varying diameter and internal pressure. Digital illustration. Arrow showing decrease illustrations Venturi effect tube. Fluid dynamics diagram showing a cross-section of a Venturi tube with varying diameter and internal pressure. Digital illustration
Free with trial A chart painted with light showing an increase. Arrow showing decrease illustrations Chart with increases. A chart painted with light showing an increase.