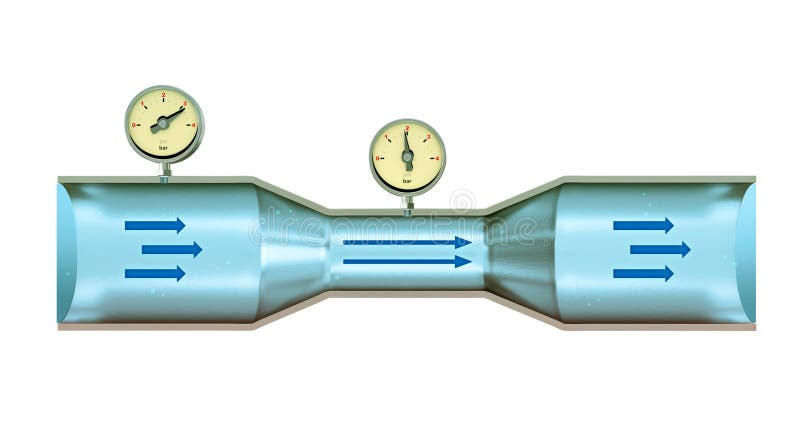
Free with trial Fluid dynamics diagram showing a cross-section of a Venturi tube with varying diameter and internal pressure. Digital illustration. Arrow showing decrease illustrations Venturi effect tube. Fluid dynamics diagram showing a cross-section of a Venturi tube with varying diameter and internal pressure. Digital illustration
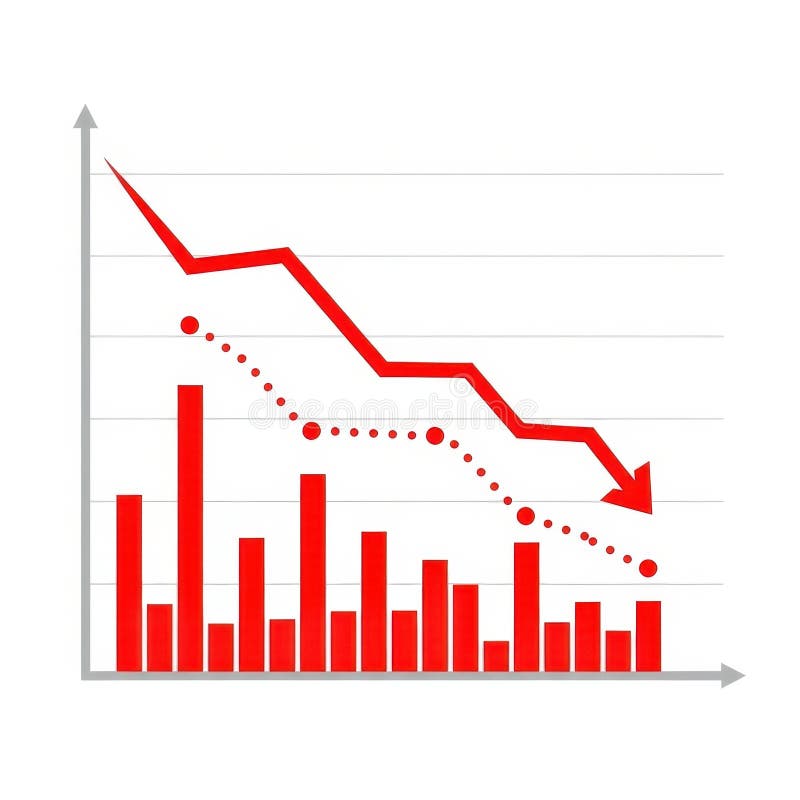
Free with trial A chart painted with light showing an increase. Arrow showing decrease illustrations Chart with increases. A chart painted with light showing an increase.
Free with trial 3D Isometric Flat Vector Illustration of Increase Interest Rates, Percent Up. Arrow showing decrease vectors 3D Isometric Flat Vector Illustration of Increase Interest Rates
Free with trial A professional vector set of business chart icons showing both growth and decline trends. Includes bar charts and line graphs with upward and downward arrows, representing profit, loss, performance rise, and financial downfall. Perfect for business presentations, reports, websites, infographics, and more. Fully editable EPS file for scalable design use. Arrow showing decrease vectors . A professional vector set of business chart icons showing both growth and decline trends. Includes bar charts and line graphs with upward and downward arrows, representing profit, loss, performance rise, and financial downfall. Perfect for business presentations, reports, websites, infographics, and more. Fully editable EPS file for scalable design use.
Free with trial Bitcoin Price Falling. Financial Crisis, BTC Fall Down. Crypto Inflation. Falling Currency Symbol With Neon Arrows Showing Economic Decline And Market Drop In Futuristic Style. Vector Illustration. Arrow showing decrease vectors Bitcoin Price Falling. Financial Crisis, BTC Fall Down. Crypto Inflation. Falling Currency Symbol With Neon Arrows
Free with trial Businessman with thumb down over graph showing crisis, geometric pattern. Arrow showing decrease illustrations Falling down of economic activity, geometric pattern. Businessman with thumb down over graph showing crisis, geometric pattern
Free with trial Graphs showing different scenarios on blue background. Arrow showing decrease vectors Graphs on blue background. Graphs showing different scenarios on blue background.
Free with trial Breaking the partnership - Business Men's hands grabbing over money and arrow pointing down showing bad financial condition. Arrow showing decrease illustrations Business Men's hands grabbing over money
Free with trial Icon set depicting financial growth and decline with upward and downward arrows over bar charts, perfect for business analytics and presentations. Arrow showing decrease vectors Bar charts with curved arrows showing trends. Icon set depicting financial growth and decline with upward and downward arrows over bar charts, perfect for business analytics and presentations
Free with trial A professional collection of 16 business and financial icons featuring various bar charts and line graphs. Perfect for UI dashboards, corporate presentations, and data-heavy infographics showing market growth or decline. Arrow showing decrease vectors Business Growth Bar Charts and Financial Trend Line Graph Vector Icons Set. A professional collection of 16 business and financial icons featuring various bar charts and line graphs. Perfect for UI dashboards, corporate presentations, and data-heavy infographics showing market growth or decline.
Free with trial A professional collection of 16 business and financial icons featuring various bar charts and line graphs. Perfect for UI dashboards, corporate presentations, and data-heavy infographics showing market growth or decline. Arrow showing decrease vectors Business Growth Bar Charts and Financial Trend Line Graph Vector Icons Set. A professional collection of 16 business and financial icons featuring various bar charts and line graphs. Perfect for UI dashboards, corporate presentations, and data-heavy infographics showing market growth or decline.
Free with trial Bar chart icon showing three declining bars within a circular interface, symbolizing decreasing data, analytical trends, and financial performance concepts. Arrow showing decrease vectors Decreasing bar chart data analysis statistics icon. Bar chart icon showing three declining bars within a circular interface, symbolizing decreasing data, analytical trends, and financial performance concepts
Free with trial A simple flat design graphic illustrates stock market growth and decline using green upward and red downward arrows with bar charts. Ideal for finance and business concepts. Arrow showing decrease vectors Bar chart showing financial growth and decline. A simple flat design graphic illustrates stock market growth and decline using green upward and red downward arrows with bar charts. Ideal for finance and business concepts
Free with trial Stack of bitcoin coins. in background a graph showing decrease in value. Falling of cryptocurrency. Arrow showing decrease vectors Bitcoin, cryptocurrency falling graph, risk, crash, collapse of BTC. Stack of bitcoin coins. in background a graph showing decrease in value. Falling of cryptocurrency.
Free with trial Vector graphic showing business profit and loss statement with green upward trends, red declines, percentages, calculator, and money icons. Arrow showing decrease illustrations Illustrated Profit and Loss Financial Report with Charts and Graphs. Vector graphic showing business profit and loss statement with green upward trends, red declines, percentages, calculator, and money icons
Free with trial Bar graph showing decreasing values alongside arrows moving toward a minimal cloud. Ideal for data analysis, statistics, regression, performance tracking, economy, analytics, simple flat metaphor. Arrow showing decrease vectors Declining Bar Chart with Arrows and Cloud Representing Regression or Data Flow. Bar graph showing decreasing values alongside arrows moving toward a minimal cloud. Ideal for data analysis, statistics, regression, performance tracking, economy, analytics, simple flat metaphor
Free with trial A clean black and white set of nine vector icons showing growth, decline, stability, and financial trends for business presentations and reports. Arrow showing decrease vectors Economic trend icons set flat design vector illustration. A clean black and white set of nine vector icons showing growth, decline, stability, and financial trends for business presentations and reports.
Free with trial Candlestick chart icons on a digital trading screen showing market movements, price trends and investment data for finance, stock analysis, trading strategy and economic growth. Arrow showing decrease illustrations Candlestick chart displaying financial market data analysis. Candlestick chart icons on a digital trading screen showing market movements, price trends and investment data for finance, stock analysis, trading strategy and economic growth
Free with trial Modern black and white vector icons showing financial trends, growth, decline, and exchange for business presentations or reports. Arrow showing decrease vectors Financial trend icons set vector illustration flat design. Modern black and white vector icons showing financial trends, growth, decline, and exchange for business presentations or reports
Free with trial Minimalist style gradient blue diagram showing downward trend line graph on black background representing economic decline or loss. Arrow showing decrease vectors Downward trend line graph on black background for infographic. Minimalist style gradient blue diagram showing downward trend line graph on black background representing economic decline or loss.
Free with trial Stock loss crisis crash illustration in red color. Online trade on computer screen. Arrow showing decrease illustrations Stock loss crisis crash in red color. Stock loss crisis crash illustration in red color. Online trade on computer screen.
Free with trial A line graph showing a downward trend with two colored lines on a grid background. The graph represents data analysis and statistics. Arrow showing decrease illustrations Downward Trend Line Graph. A line graph showing a downward trend with two colored lines on a grid background. The graph represents data analysis and statistics.
Free with trial A simple and clean line art icon of a graph, isolated on a white background. This vector illustration features a line chart with axes, showing a fluctuating trend with distinct data points. The minimalist design makes it perfect for various applications related to business, finance, and data analysis. Ideal for use in presentations, infographics, websites, mobile apps, and user interfaces to represent concepts like statistics, growth, market trends, performance reports, and financial analytics. A versatile symbol for progress and data visualization. Arrow showing decrease illustrations Analytics Line Graph Vector Icon. A simple and clean line art icon of a graph, isolated on a white background. This vector illustration features a line chart with axes, showing a fluctuating trend with distinct data points. The minimalist design makes it perfect for various applications related to business, finance, and data analysis. Ideal for use in presentations, infographics, websites, mobile apps, and user interfaces to represent concepts like statistics, growth, market trends, performance reports, and financial analytics. A versatile symbol for progress and data visualization.
Free with trial Set of sketched icons showing mutual fund nav increases and decreases with indian rupee signs on an alpha transparent base. Arrow showing decrease vectors Mutual fund nav trend sketch icons with rupee symbol alpha transparent. Set of sketched icons showing mutual fund nav increases and decreases with indian rupee signs on an alpha transparent base.
Free with trial Business finance and growth icons illustrating statistics charts trends progress and success. Arrow showing decrease vectors Finance and growth icons showing progress and business performance blue navy. Business finance and growth icons illustrating statistics charts trends progress and success
Free with trial A collection of five distinct black and white graphic representations of data. From left to right, the first is a line graph with dots, showing fluctuations. The second is a zig-zag line graph with dots and an upward arrow. The third is a series of ascending vertical bars. The fourth is a bar chart with a single dot above one of the bars. The fifth is a pie chart divided into four sections, with. Arrow showing decrease vectors Collection of black and white business and data charts and graphs statistics analytics. A collection of five distinct black and white graphic representations of data. From left to right, the first is a line graph with dots, showing fluctuations. The second is a zig-zag line graph with dots and an upward arrow. The third is a series of ascending vertical bars. The fourth is a bar chart with a single dot above one of the bars. The fifth is a pie chart divided into four sections, with
Free with trial This 3D render depicts a stark red downward trend line superimposed over a grid background, with a bar chart showing declining values. The composition visually represents financial loss, economic downturn, market crash, or negative performance. The bold red color and sharp angles convey urgency and a sense of crisis, making it ideal for illustrating concepts related to business failure, stock market decline, or any situation involving a significant negative trajectory. Arrow showing decrease illustrations Red Downward Trend Graph with Bar Chart. This 3D render depicts a stark red downward trend line superimposed over a grid background, with a bar chart showing declining values. The composition visually represents financial loss, economic downturn, market crash, or negative performance. The bold red color and sharp angles convey urgency and a sense of crisis, making it ideal for illustrating concepts related to business failure, stock market decline, or any situation involving a significant negative trajectory.
Free with trial A detailed red financial graph illustrates a sharp downward trend in stock prices. Candlestick bars and a wavy line graph show a significant decline, with red arrows reinforcing the negative movement. The dark background features a grid, and a bright light emanates from the left side of the image. Arrow showing decrease illustrations Red Financial Graph with Falling Stock Prices stock market. A detailed red financial graph illustrates a sharp downward trend in stock prices. Candlestick bars and a wavy line graph show a significant decline, with red arrows reinforcing the negative movement. The dark background features a grid, and a bright light emanates from the left side of the image
Free with trial Colorful vector icons showing graphs charts arrows lightbulb target briefcase for analytics strategy and success. Arrow showing decrease illustrations Illustrated Business Data Analysis and Growth Concepts. Colorful vector icons showing graphs charts arrows lightbulb target briefcase for analytics strategy and success
Free with trial 3D rendering of a business infographic chart showing a progressive decline over four periods. Red color on the 3D bar graph chart with an arrow on it. Arrow showing decrease illustrations 3D render of a business data in decline. 3D rendering of a business infographic chart showing a progressive decline over four periods. Red color on the 3D bar graph chart with an arrow on it.
Free with trial A collection of colorful cartoon-style icons representing climate change and temperature variations. The icons include thermometers showing different temperature levels, a sun, a flame, a snowflake, a green leaf, the Earth, up and down arrows, a warning sign, a temperature scale, and a recycling symbol. These icons can be used to illustrate concepts related to global warming, weather conditions, environmental issues, and temperature fluctuations. Arrow showing decrease illustrations Climate Change and Temperature Icons. A collection of colorful cartoon-style icons representing climate change and temperature variations. The icons include thermometers showing different temperature levels, a sun, a flame, a snowflake, a green leaf, the Earth, up and down arrows, a warning sign, a temperature scale, and a recycling symbol. These icons can be used to illustrate concepts related to global warming, weather conditions, environmental issues, and temperature fluctuations.
Free with trial An empty corporate conference room featuring a large wooden table, office chairs, and a whiteboard displaying a hand-drawn graph indicating a downward trend in performance. Arrow showing decrease illustrations Modern Office Conference Room Showing Financial Loss Chart. An empty corporate conference room featuring a large wooden table, office chairs, and a whiteboard displaying a hand-drawn graph indicating a downward trend in performance
Free with trial Modern black and white vector icons depicting financial trends like rising, falling, and stable graphs, dollar signs, and investment arrows for business presentations and reports. Arrow showing decrease vectors Financial trend icons vector illustration showing profit loss growth and investment flat design. Modern black and white vector icons depicting financial trends like rising, falling, and stable graphs, dollar signs, and investment arrows for business presentations and reports.
Free with trial This illustration depicts a financial concept with a bar graph showing a downward trend, alternating between green (profit) and red (loss) bars. A red line graph with an arrow indicates a significant decline. To the right, a stack of documents represents a profit and loss statement, with 'Profit' and 'Loss' clearly labeled. This visual is ideal for representing financial performance, business challenges, economic downturns, or the need for strategic adjustments. Arrow showing decrease vectors Declining Profit and Loss Statement with Downward Trend Graph. This illustration depicts a financial concept with a bar graph showing a downward trend, alternating between green (profit) and red (loss) bars. A red line graph with an arrow indicates a significant decline. To the right, a stack of documents represents a profit and loss statement, with 'Profit' and 'Loss' clearly labeled. This visual is ideal for representing financial performance, business challenges, economic downturns, or the need for strategic adjustments.
Free with trial People and currency trading, white collar workers vector art. Arrow showing decrease vectors Business Man Showing Rising and Falling Sales Graphs. People and currency trading, white collar workers vector art
Free with trial Four colorful 3D arrows in red, orange, cyan, and green are pointing down, representing a decline, loss, or downward trend in a business or financial chart. Arrow showing decrease vectors Set of Four Glossy 3D Arrows Showing a Downward Trend. Four colorful 3D arrows in red, orange, cyan, and green are pointing down, representing a decline, loss, or downward trend in a business or financial chart
Free with trial Stylized data illustrates financial increase using dollar signs, bar graphs, and arrows. Some data trends down while other data trends up, showing potential profits and losses. Arrow showing decrease illustrations Stock Market Data Shows Economic Growth and Potential Loss in the Future. Stylized data illustrates financial increase using dollar signs, bar graphs, and arrows. Some data trends down while other data trends up, showing potential profits and losses.
Free with trial A set of two hand-drawn black line art icons representing a spiral vortex and concentric circles featuring integrated downward arrows. Arrow showing decrease vectors Hand-drawn minimalist black line icons showing a spiral vortex and concentric circles with downward illustration. A set of two hand-drawn black line art icons representing a spiral vortex and concentric circles featuring integrated downward arrows
Free with trial Business Meeting on Real Estate Market Analysis with Charts, Graphs, and Digital House Icon Showing Trends in Property Value Changes Sigmoid. Arrow showing decrease illustrations Professionals discuss real estate market trends using data and analytics. A digital house icon symbolizes value changes. Business Meeting on Real Estate Market Analysis with Charts, Graphs, and Digital House Icon Showing Trends in Property Value Changes Sigmoid
Free with trial Set of six black business charts icons showing growth and decline trends with arrows and bars in vector style clear and simple design calm. Generative AI. Arrow showing decrease vectors Business growth and decline charts arrows statistics bar graph icons vector illustration. Set of six black business charts icons showing growth and decline trends with arrows and bars in vector style clear and simple design calm. Generative AI
Free with trial A visual representation of negative financial performance. It features red bars and a red line graph showing a downward trend, accompanied by a dotted line indicating a similar pattern. Arrow showing decrease illustrations Red downward trending graph with bars and dotted line. A visual representation of negative financial performance. It features red bars and a red line graph showing a downward trend, accompanied by a dotted line indicating a similar pattern
Free with trial 3D rendered graphic showing the word Finance in bold black letters with a green upward trending arrow above and a red downward trending arrow below, flanked by blue opposing arrows on a grid background. Arrow showing decrease illustrations Finance growth upward trend with opposing arrows image. 3D rendered graphic showing the word Finance in bold black letters with a green upward trending arrow above and a red downward trending arrow below, flanked by blue opposing arrows on a grid background
Free with trial A silver laptop sits on a light brown wooden surface. Its screen displays a dark background with a grid pattern and a prominent red line graph sharply declining from left to right. The red line is brightly lit, creating a strong visual contrast against the dark background. The overall mood is one of concern or warning, suggesting a negative trend or decline. The image is clean and simple, focusing, generated by AI. Arrow showing decrease illustrations Laptop Screen Showing Red Downward Trend Graph computer. A silver laptop sits on a light brown wooden surface. Its screen displays a dark background with a grid pattern and a prominent red line graph sharply declining from left to right. The red line is brightly lit, creating a strong visual contrast against the dark background. The overall mood is one of concern or warning, suggesting a negative trend or decline. The image is clean and simple, focusing, generated by AI.
Free with trial This vector illustration shows a set of black graph icons with rising and falling charts indicated by arrows showing trends in data with clear simple design and sharp edges calm. Generative AI. Arrow showing decrease vectors Black graph icons set rising and falling charts with arrows vector illustration simple design. This vector illustration shows a set of black graph icons with rising and falling charts indicated by arrows showing trends in data with clear simple design and sharp edges calm. Generative AI
Free with trial Dollar Currency Up Down Icons. Redus and high costs line with dollar icons.. eps. Arrow showing decrease vectors Circular dollar icons showing rising and falling currency values. Dollar Currency Up Down Icons. Redus and high costs line with dollar icons..eps
Free with trial Illustration showing financial data analysis with charts, idea lightbulb, and location pins, perfect for finance and business concepts. Arrow showing decrease illustrations Analyzing Financial Data and Performance Charts Illustration. Illustration showing financial data analysis with charts, idea lightbulb, and location pins, perfect for finance and business concepts
Free with trial Two bar graphs, one green showing upward growth and one red showing downward decline, against a white background. Arrow showing decrease illustrations Rising and falling bar graphs illustrating financial trends. Two bar graphs, one green showing upward growth and one red showing downward decline, against a white background
Free with trial A medium shot shows a person's hands cupped together, palms up. Hovering above the hands are two glowing neon outlines of arrows, one pointing down and the other pointing up. Both arrows contain a percentage symbol. A blurred background features faint digital data and bar graphs, suggesting a financial or economic context. The overall mood is abstract and conceptual. Arrow showing decrease illustrations Hands holding glowing up and down percentage arrows. A medium shot shows a person's hands cupped together, palms up. Hovering above the hands are two glowing neon outlines of arrows, one pointing down and the other pointing up. Both arrows contain a percentage symbol. A blurred background features faint digital data and bar graphs, suggesting a financial or economic context. The overall mood is abstract and conceptual
Free with trial A businessman in a suit holds a digital display showing arrows and percentages, representing the concept of reducing costs while improving quality. The image portrays business strategy and efficiency. Arrow showing decrease illustrations Businessman presents cost reduction and quality improvement concept. A businessman in a suit holds a digital display showing arrows and percentages, representing the concept of reducing costs while improving quality. The image portrays business strategy and efficiency
Free with trial A conceptual image featuring wooden blocks spelling the word "TRUST" alongside a stacked block showing a downward trend graph and a sad face emoji. This composition symbolizes the loss of consumer confidence, economic recession, reputation damage, and the negative impact of poor service or financial decline in a professional business environment. Arrow showing decrease illustrations Declining Trust and Business Failure Concept with Wooden Blocks and Sad Face Icon. A conceptual image featuring wooden blocks spelling the word "TRUST" alongside a stacked block showing a downward trend graph and a sad face emoji. This composition symbolizes the loss of consumer confidence, economic recession, reputation damage, and the negative impact of poor service or financial decline in a professional business environment.
Free with trial The image displays a financial trend chart superimposed on a modern office setting. the chart depicts a declining trend, indicated by a downward-sloping line with an arrow pointing downwards. the background features a blurred office environment with windows, a plant, and furniture, creating a sense of realism and context for the financial data. the overall composition suggests a reflection or projection of financial performance within a contemporary workspace. Arrow showing decrease illustrations Financial decline chart in modern office space. the image displays a financial trend chart superimposed on a modern office setting. the chart depicts a declining trend, indicated by a downward-sloping line with an arrow pointing downwards. the background features a blurred office environment with windows, a plant, and furniture, creating a sense of realism and context for the financial data. the overall composition suggests a reflection or projection of financial performance within a contemporary workspace.
Free with trial The image shows a neon pink graph descending sharply against a dark blue, grid-patterned background. the graph starts high on the left, then plummets downwards with some zigzags before leveling out near the bottom. an arrow at the end of the line points downwards, emphasizing the decline. the overall effect is a visual representation of a significant drop or loss. Arrow showing decrease illustrations Descending neon graph on a dark blue background. the image shows a neon pink graph descending sharply against a dark blue, grid-patterned background. the graph starts high on the left, then plummets downwards with some zigzags before leveling out near the bottom. an arrow at the end of the line points downwards, emphasizing the decline. the overall effect is a visual representation of a significant drop or loss.
Free with trial This image features two prominent arrows pointing upwards one green and one red symbolizing contrasting financial performance or progress in different areas. Arrow showing decrease illustrations Two upward arrows green and red showing growth progress and contrasting trends. This image features two prominent arrows pointing upwards one green and one red symbolizing contrasting financial performance or progress in different areas
Free with trial People are stressed by a financial chart with falling indicators, showing a loss of money and investments due to a market downturn. Arrow showing decrease vectors People stressed by a financial chart with falling indicators. people are stressed by a financial chart with falling indicators, showing a loss of money and investments due to a market downturn.
Free with trial This image features two minimalist icons representing financial or data trends. The left icon is a white line graph with circular data points and directional arrows, set against a solid black shield shape. The right icon presents the same line graph and data points within a black outline of a shield, on a white background. Both icons depict fluctuating data, with one showing a downward trend and the other an upward trend, symbolizing market volatility, analysis, and security. Arrow showing decrease illustrations Line Graph Icon with Shield Symbol - Upward and Downward Trends. This image features two minimalist icons representing financial or data trends. The left icon is a white line graph with circular data points and directional arrows, set against a solid black shield shape. The right icon presents the same line graph and data points within a black outline of a shield, on a white background. Both icons depict fluctuating data, with one showing a downward trend and the other an upward trend, symbolizing market volatility, analysis, and security.
Free with trial Visual representation of financial trends with euro symbols, depicting both upward and downward movements in bar graph format, suitable for economic analysis. Arrow showing decrease vectors Bar charts showing euro currency growth and decline isolated on transparent background. Visual representation of financial trends with euro symbols, depicting both upward and downward movements in bar graph format, suitable for economic analysis
Free with trial Three wooden blocks show upward trending growth with arrows. The blocks decrease in size, set against a wood surface, symbolizing progress. Arrow showing decrease illustrations Wooden blocks with upward arrows showing growth on wood surface. Three wooden blocks show upward trending growth with arrows. The blocks decrease in size, set against a wood surface, symbolizing progress
Free with trial Hand presents a declining bar graph illustrating cost reduction, creating a compelling business visual Perfect for presentations and financial analysis. Arrow showing decrease illustrations Presenting Cost Reduction with Graph and Hand. Hand presents a declining bar graph illustrating cost reduction, creating a compelling business visual Perfect for presentations and financial analysis
Free with trial A line graph showing a declining stock market trend over time, with a downward sloping orange line and multiple blue and. Arrow showing decrease illustrations Stock Market Decline Graph. A line graph showing a declining stock market trend over time, with a downward sloping orange line and multiple blue and.
Free with trial Digital red graph with falling stock price on large screen in bright corporate office, concept of financial crisis and economic collapse, 3D Rendering. Arrow showing decrease illustrations Red downward financial chart on screen in modern office showing market crash, economic recession, and global investment crisis. Digital red graph with falling stock price on large screen in bright corporate office, concept of financial crisis and economic collapse, 3D Rendering
Free with trial Digital red graph with falling stock price on large screen in bright corporate office, concept of financial crisis and economic collapse, 3D Rendering. Arrow showing decrease illustrations Red downward financial chart on screen in modern office showing market crash, economic recession, and global investment crisis. Digital red graph with falling stock price on large screen in bright corporate office, concept of financial crisis and economic collapse, 3D Rendering
Free with trial Businessman looking at a stock market chart showing financial crisis and falling profits. Arrow showing decrease illustrations Businessman thinking about business decline and financial loss. Businessman looking at a stock market chart showing financial crisis and falling profits
Free with trial A flat design illustration of a bar chart with bars decreasing in height, accompanied by a red arrow pointing downwards, symbolizing a negative trend or financial loss. Arrow showing decrease illustrations Bar chart showing a downward trend. A flat design illustration of a bar chart with bars decreasing in height, accompanied by a red arrow pointing downwards, symbolizing a negative trend or financial loss
Free with trial A visual representation of financial data showing a decline in performance, with red bars and arrows indicating a downward trend in the market. Arrow showing decrease illustrations Bar chart with downward trend isolated on white background. A visual representation of financial data showing a decline in performance, with red bars and arrows indicating a downward trend in the market
Free with trial A man in a suit holds a phone and a stylus, interacting with a projected bar graph showing a downward trend in profits and an upward trend in costs. Arrow showing decrease illustrations Businessman analyzes declining profits and rising costs using digital graph on a dark background. A man in a suit holds a phone and a stylus, interacting with a projected bar graph showing a downward trend in profits and an upward trend in costs
Free with trial Black and white vector logo of a simple house outline with stylized upward arrow and a small dollar sign icon, simple design, on a solid background, simple shapes, flat illustration style, simple lines, no shadows or gradients, symmetrical composition, centered, no text, high contrast, no color, high resolution, very detailed, high definition --chaos 30 --ar 16:9 --v 7 Job ID: cfd6ce0d-9e1a-412b-. Arrow showing decrease illustrations Dollar Sign with Arrows Showing Income and Expenses Under a Roof. black and white vector logo of a simple house outline with stylized upward arrow and a small dollar sign icon, simple design, on a solid background, simple shapes, flat illustration style, simple lines, no shadows or gradients, symmetrical composition, centered, no text, high contrast, no color, high resolution, very detailed, high definition --chaos 30 --ar 16:9 --v 7 Job ID: cfd6ce0d-9e1a-412b-
Free with trial Flat vector illustration of a chart depicting a negative trend, accompanied by a sad face icon, suggesting business decline or failure. Arrow showing decrease vectors A chart showing a negative trend with a sad face icon, indicating a decline in business. Flat vector illustration of a chart depicting a negative trend, accompanied by a sad face icon, suggesting business decline or failure.
Free with trial Icon showing two green downward arrows of different sizes on a white background. Arrow showing decrease illustrations Two Green Downward Arrows of Different Sizes on a White Background
Free with trial Financial success and loss, currency value change, stock market fluctuation, investment profit risk, economic business analysis. Arrow showing decrease vectors Gold coins with dollar sign showing market trend up and down arrows. Financial success and loss, currency value change, stock market fluctuation, investment profit risk, economic business analysis
Free with trial This is an detailed line art illustration of a professional dog showing market decrease. Arrow showing decrease vectors German Shepherd in bow tie with down arrow. This is an detailed line art illustration of a professional dog showing market decrease
Free with trial Four blue square icons with arrows indicating percentage changes, two with upward green arrows and two with downward red arrows. Arrow showing decrease illustrations Set of four icons showing percentage changes. Four blue square icons with arrows indicating percentage changes, two with upward green arrows and two with downward red arrows
Free with trial Financial graph showing growth of investment coins followed by sharp downward red arrow indicating economic loss and bankruptcy crisis. Arrow showing decrease vectors Rising stacks of gold coins illustrating profit decline and market crash. Financial graph showing growth of investment coins followed by sharp downward red arrow indicating economic loss and bankruptcy crisis
Free with trial Hand is pointing towards a descending bar chart with bars in shades of red, orange, and yellow on a white background. Arrow showing decrease illustrations The hand points to the bar chart showing a downtrend. Hand is pointing towards a descending bar chart with bars in shades of red, orange, and yellow on a white. hand is pointing towards a descending bar chart with bars in shades of red, orange, and yellow on a white background.
Free with trial Financial decision and interest rate change concept, wooden blocks showing percentage symbol with green upward and red downward arrows. Arrow showing decrease illustrations Financial decision and interest rate change concept
Free with trial Financial decision and interest rate change concept, wooden blocks showing percentage symbol with green upward and red downward arrows. Arrow showing decrease illustrations Financial decision and interest rate change concept
Free with trial Financial decision and interest rate change concept, wooden blocks showing percentage symbol with green upward and red downward arrows. Arrow showing decrease illustrations Financial decision and interest rate change concept
Free with trial Financial decision and interest rate change concept, wooden blocks showing percentage symbol with green upward and red downward arrows. Arrow showing decrease illustrations Financial decision and interest rate change concept
Free with trial Set of black icons showing a digital clock, triangular shape within a square, bar chart with line graph overlay, atomic model, upward arrows, and a ruler with a downward arrow. Generative AI. Arrow showing decrease vectors Black digital clock triangle chart atom arrows and ruler icons. Set of black icons showing a digital clock, triangular shape within a square, bar chart with line graph overlay, atomic model, upward arrows, and a ruler with a downward arrow. Generative AI
Free with trial A businessman holds wooden blocks showing upward quality and downward cost, symbolizing effective management and business strategy. Arrow showing decrease illustrations Balancing Quality Up and Cost Down with Wooden Blocks. A businessman holds wooden blocks showing upward quality and downward cost, symbolizing effective management and business strategy
Free with trial A graphic showing a downward trend with a Bitcoin symbol inside a prohibition sign. Arrow showing decrease illustrations Declining bitcoin symbol isolated on white background. A graphic showing a downward trend with a Bitcoin symbol inside a prohibition sign