Free with trial Strategic Decisions: Integrating Business Analytics with Strategic Thinking. This visual portrays the dynamic interaction between business analytics and strategic thinking, showcasing how analytical insights drive strategic planning and decision-making. It emphasizes the synergy between data analysis and strategic foresight in achieving business goals. --chaos 10 --ar 16:9 --style raw --stylize, aesthetic wallpaper background. Bar chart decrease illustrations Colorful Pie Charts and Bar Graphs on a White Paper. Strategic Decisions: Integrating Business Analytics with Strategic Thinking. This visual portrays the dynamic interaction between business analytics and strategic thinking, showcasing how analytical insights drive strategic planning and decision-making. It emphasizes the synergy between data analysis and strategic foresight in achieving business goals. --chaos 10 --ar 16:9 --style raw --stylize, aesthetic wallpaper background
Free with trial A red bar graph with a descending arrow on a white plane. The graph shows a downward trend, visually representing loss or decline in areas such as finance, business, the economy, or the market. It is isolated on white. Bar chart decrease illustrations Red bar graph with arrow isolated on white background. use cases: finance, business, economy. A red bar graph with a descending arrow on a white plane. The graph shows a downward trend, visually representing loss or decline in areas such as finance, business, the economy, or the market. It is isolated on white
Free with trial Colorful bar graph showing data and trends, perfect for business, finance, or analytics presentations. EPS 10. Bar chart decrease vectors Colorful bar graph showing data and trends, perfect for business, finance, or analytics presentations.
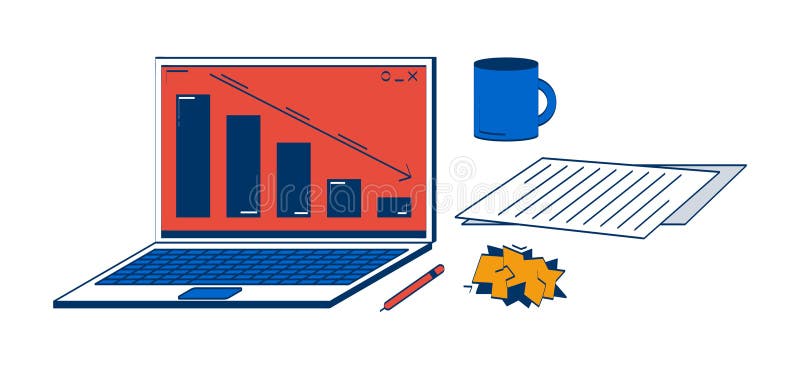
Free with trial Laptop with declining graph and office supplies 2D doodle objects set. Downward bar chart, mug cartoon elements flat vector cliparts isolated on white background. Hand drawn illustrations collection. Bar chart decrease vectors Laptop with declining graph and office supplies 2D doodle objects set
Free with trial A 3D icon featuring a dark square base with a gold border. On the base are four vertical bars of varying heights, colored in shades of beige and gold. A red zigzag line representing a downward trend is positioned above the bars, with its peak resting on the tallest bar and its subsequent segments descending. The icon is isolated on a clean white background. Bar chart decrease illustrations Downward financial trend graph icon chart business. A 3D icon featuring a dark square base with a gold border. On the base are four vertical bars of varying heights, colored in shades of beige and gold. A red zigzag line representing a downward trend is positioned above the bars, with its peak resting on the tallest bar and its subsequent segments descending. The icon is isolated on a clean white background
Free with trial Business Bar Graph Downturn Arrow Icon Trend Falling. Bar chart decrease vectors Business Bar Graph Downturn Arrow Icon Trend Falling
Free with trial This vector icon set features graph diagrams with arrows indicating growth and decline. The icons represent business metrics and financial performance, with arrows pointing upward for growth and downward for decline. These symbols are ideal for visualizing trends, success, and changes in finance reports or business charts. The clean, simple design ensures clarity, making these icons suitable for use in presentations, reports, or dashboards to effectively communicate financial or business performance. Bar chart decrease vectors Growing up and down vector icon set. Graph diagram with arrow. Business growth success chart. Finance report symbol. This vector icon set features graph diagrams with arrows indicating growth and decline. The icons represent business metrics and financial performance, with arrows pointing upward for growth and downward for decline. These symbols are ideal for visualizing trends, success, and changes in finance reports or business charts. The clean, simple design ensures clarity, making these icons suitable for use in presentations, reports, or dashboards to effectively communicate financial or business performance.
Free with trial This image showcases a striking 3D rendering featuring two sets of colorful bar graphs, one in shades of pink and the other in orange. These graphs are artfully embedded within wave-like, layered forms, creating a visually interesting contrast between the rigid geometry of the bars and the fluidity of the surrounding shapes. The graphs are positioned on separate, circular platforms, and a small, idyllic island with several evergreen trees sits between them, adding a touch of nature to the otherwise abstract composition. The overall aesthetic is minimalist and modern, suggesting a conceptual representation of financial growth within a natural context. Bar chart decrease illustrations Abstract 3D Render of Financial Growth Represented by Colorful Bar Graphs Nestled in Stylized Landscapes. This image showcases a striking 3D rendering featuring two sets of colorful bar graphs, one in shades of pink and the other in orange. These graphs are artfully embedded within wave-like, layered forms, creating a visually interesting contrast between the rigid geometry of the bars and the fluidity of the surrounding shapes. The graphs are positioned on separate, circular platforms, and a small, idyllic island with several evergreen trees sits between them, adding a touch of nature to the otherwise abstract composition. The overall aesthetic is minimalist and modern, suggesting a conceptual representation of financial growth within a natural context.
Free with trial A futuristic concept of financial trading and data analysis. A glowing holographic stock market chart, with candlesticks and graphs, is projected onto a modern office desk. The scene includes a laptop and coffee, set against a large window with a blurry night city skyline. This image represents concepts like fintech, investment, big data, economic growth, and innovative business technology. Ideal for illustrating topics on digital finance, stock exchange, forex trading, and corporate strategy in a high-tech world. Bar chart decrease illustrations Futuristic Financial Trading Hologram on Office Desk. A futuristic concept of financial trading and data analysis. A glowing holographic stock market chart, with candlesticks and graphs, is projected onto a modern office desk. The scene includes a laptop and coffee, set against a large window with a blurry night city skyline. This image represents concepts like fintech, investment, big data, economic growth, and innovative business technology. Ideal for illustrating topics on digital finance, stock exchange, forex trading, and corporate strategy in a high-tech world.
Free with trial A cheerful cartoon businessman in a suit stands proudly beside a rising bar graph, illustrating positive financial growth and business success. Bar chart decrease illustrations Smiling Businessman Presenting Financial Growth Chart. A cheerful cartoon businessman in a suit stands proudly beside a rising bar graph, illustrating positive financial growth and business success.
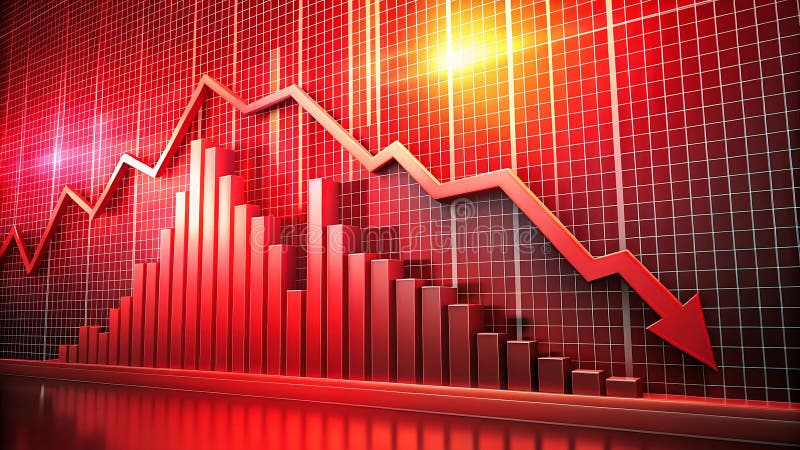
Free with trial This 3D graphic depicts a sharp market downturn, visualized with a red arrow plummeting downwards along a gridded bar chart. The image is generated by AI, offering a compelling visual representation of economic decline and financial loss. It showcases the potential for significant drops in various. Bar chart decrease illustrations AI-Generated Market Decline Visualization. This 3D graphic depicts a sharp market downturn, visualized with a red arrow plummeting downwards along a gridded bar chart. The image is generated by AI, offering a compelling visual representation of economic decline and financial loss. It showcases the potential for significant drops in various
Free with trial A blackboard with a graph on it and a potted plant next to it. The graph shows a downward trend, which could represent a decrease in sales or a decline in a particular stock. Bar chart decrease illustrations A blackboard with a graph on it and a potted plant next to it
Free with trial This image showcases a vibrant 3D rendering of various financial charts, including bar graphs, pie charts, and a rising arrow, symbolizing growth and profitability. Ideal for presentations, reports, and financial articles. Bar chart decrease illustrations Colorful 3D Financial Charts Showing Growth and Profit. This image showcases a vibrant 3D rendering of various financial charts, including bar graphs, pie charts, and a rising arrow, symbolizing growth and profitability. Ideal for presentations, reports, and financial articles.
Free with trial A stylized digital graph depicts fluctuating market trends using bar columns and a connected line with bright orange data points. Bar chart decrease illustrations Abstract digital graph showing financial market trends. A stylized digital graph depicts fluctuating market trends using bar columns and a connected line with bright orange data points
Free with trial A businessman in a suit draws a red downward trend line over a bar graph, illustrating cost reduction and financial decline. Bar chart decrease illustrations Businessman Drawing a Downward Trend Line on a Cost Graph. A businessman in a suit draws a red downward trend line over a bar graph, illustrating cost reduction and financial decline
Free with trial A collection of twelve black and white vector icons representing various financial concepts. The set includes bar charts and line graphs illustrating growth and trends, a piggy bank for savings, bank buildings symbolizing financial institutions, a safe for security, currency symbols (dollar, euro, yen), and credit debit cards for payments. These icons are ideal for websites, presentations, and applications related to finance, economics, business, and personal money management. Bar chart decrease vectors Financial Icons Set: Growth, Savings, Banking, and Payments. A collection of twelve black and white vector icons representing various financial concepts. The set includes bar charts and line graphs illustrating growth and trends, a piggy bank for savings, bank buildings symbolizing financial institutions, a safe for security, currency symbols (dollar, euro, yen), and credit debit cards for payments. These icons are ideal for websites, presentations, and applications related to finance, economics, business, and personal money management.
Free with trial Visual representation of growth forecast and risk projection using colorful 3D bar graphs, emphasizing trends and metrics in business and finance analysis. Bar chart decrease illustrations Growth Forecast with Risk Projection Using Colorful 3D Bar Graph Visualization. Visual representation of growth forecast and risk projection using colorful 3D bar graphs, emphasizing trends and metrics in business and finance analysis
Free with trial Report timer line icon. Halftone dotted pattern. Gradient icon with grain shadow. Column graph sign. Growth diagram chart symbol. Line report timer icon. Various designs. Vector. Bar chart decrease vectors Report timer line icon. Column graph sign. Halftone dotted pattern. Vector. Report timer line icon. Halftone dotted pattern. Gradient icon with grain shadow. Column graph sign. Growth diagram chart symbol. Line report timer icon. Various designs. Vector
Free with trial Report document line icon. Continuous line big heart. Column graph sign. Growth diagram, pie chart symbol. 3d hearts in heart shaped loop. Report document single line ribbon. Vector. Bar chart decrease vectors Report document line icon. Column graph sign. Continuous line big heart. Vector. Report document line icon. Continuous line big heart. Column graph sign. Growth diagram, pie chart symbol. 3d hearts in heart shaped loop. Report document single line ribbon. Vector
Free with trial A close-up, angled perspective of several printed business reports displaying a variety of financial data. The documents feature colorful pie charts, blue bar graphs, and line graphs tracking performance and statistics. This image is perfect for illustrating concepts such as data analysis, market research, financial planning, investment strategy, and corporate performance review. The detailed charts and figures represent the core of business analytics, accounting, and economic forecasting, making it a versatile background for financial presentations and articles. Bar chart decrease illustrations Business Analytics Report with Financial Charts and Graphs. A close-up, angled perspective of several printed business reports displaying a variety of financial data. The documents feature colorful pie charts, blue bar graphs, and line graphs tracking performance and statistics. This image is perfect for illustrating concepts such as data analysis, market research, financial planning, investment strategy, and corporate performance review. The detailed charts and figures represent the core of business analytics, accounting, and economic forecasting, making it a versatile background for financial presentations and articles.
Free with trial Declining fuel prices are visually represented by a downward red arrow intersecting a falling bar graph and a red dispenser suggesting financial relief and market trends Use for economic reports. Bar chart decrease illustrations Fuel Price Decreasing Concept with Red Arrow and Dispenser. Declining fuel prices are visually represented by a downward red arrow intersecting a falling bar graph and a red dispenser suggesting financial relief and market trends Use for economic reports
Free with trial A 3D figure sits on a platform reviewing financial data, using a laptop to analyze bar graphs, pie charts and line graphs representing business performance and growth. Bar chart decrease illustrations 3D Character Analyzing Business Charts and Graphs on Laptop. A 3D figure sits on a platform reviewing financial data, using a laptop to analyze bar graphs, pie charts and line graphs representing business performance and growth.
Free with trial An abstract and futuristic digital visualization of financial data, featuring glowing blue bar charts and candlestick patterns reflecting on a sleek, dark surface. The dynamic composition, set against a deep blue background with subtle grid lines, evokes concepts of technology, business growth, and market analysis. Ideal for illustrating topics related to stock market trends, investment strategies, economic reports, big data analytics, and the future of finance in a modern, high-tech context. Bar chart decrease illustrations Futuristic Digital Finance Chart with Glowing Blue Data Bars. An abstract and futuristic digital visualization of financial data, featuring glowing blue bar charts and candlestick patterns reflecting on a sleek, dark surface. The dynamic composition, set against a deep blue background with subtle grid lines, evokes concepts of technology, business growth, and market analysis. Ideal for illustrating topics related to stock market trends, investment strategies, economic reports, big data analytics, and the future of finance in a modern, high-tech context.
Free with trial Set of twelve colorful line icons representing various types of data visualization methods, including bar charts, line graphs, pie charts, and more. Perfect for presentations, reports, or websites. Bar chart decrease illustrations Data Visualization Icons. Set of twelve colorful line icons representing various types of data visualization methods, including bar charts, line graphs, pie charts, and more. Perfect for presentations, reports, or websites.
Free with trial Doodle style bar and line graph icon representing growth and analytics. Bar chart decrease vectors Doodle style bar and line graph icon representing growth and analytics
Free with trial Hourglass with sand flowing, a lightning bolt, and bar chart aligned as decreasing bars. Ideal for time management, efficiency, productivity, energy flow, deadlines, data analysis simple flat. Bar chart decrease vectors Hourglass with Lightning Bolt and Graph Bars Representing Time, Energy, and Productivity. Hourglass with sand flowing, a lightning bolt, and bar chart aligned as decreasing bars. Ideal for time management, efficiency, productivity, energy flow, deadlines, data analysis simple flat
Free with trial Presentation board with decreasing bar graph for business statistics. Bar chart decrease vectors Presentation board with decreasing bar graph for business statistics
Free with trial Hand drawn downward trending bar graph with arrow indicating decline. Bar chart decrease vectors Hand drawn downward trending bar graph with arrow indicating decline
Free with trial Stress level meter, progress bar gauge isolated over white background, stress meter vector medical illustration. vector. Bar chart decrease vectors Stress level meter, progress bar gauge isolated over white background, stress meter vector medical illustration
Free with trial Declining bar graph illustration, business, financial, and economic data. Bar chart decrease vectors Declining bar graph illustration, business, financial, and economic data
Free with trial This 3D rendering showcases stacks of coins alongside a positive growth chart, generated by AI. It visually represents financial success and investment growth, ideal for illustrating financial concepts. Bar chart decrease illustrations AI-Generated Financial Growth. This 3D rendering showcases stacks of coins alongside a positive growth chart, generated by AI. It visually represents financial success and investment growth, ideal for illustrating financial concepts.
Free with trial Report document line icon. Neumorphic, Purple gradient, 3d pin buttons. Column graph sign. Growth diagram, pie chart symbol. Line icons. Neumorphic buttons with outline signs. Vector. Bar chart decrease vectors Report document line icon. Column graph sign. Line icons. Vector. Report document line icon. Neumorphic, Purple gradient, 3d pin buttons. Column graph sign. Growth diagram, pie chart symbol. Line icons. Neumorphic buttons with outline signs. Vector
Free with trial This image shows a calculator next to colorful 3D bar charts and pie charts illustrating business growth and financial success. The vibrant colors and upward-trending graph create a visually appealing representation of positive financial results. Bar chart decrease illustrations Colorful Calculator and 3D Charts Showing Business Growth. This image shows a calculator next to colorful 3D bar charts and pie charts illustrating business growth and financial success. The vibrant colors and upward-trending graph create a visually appealing representation of positive financial results.
Free with trial This image depicts a descending graph and bar chart, symbolizing a stock market downturn, or bear market, and financial crisis. The illustration represents financial loss and market volatility. Bar chart decrease illustrations Stock Market Downturn Bear Market, Financial Crisis, Falling Graph Illustration. This image depicts a descending graph and bar chart, symbolizing a stock market downturn, or bear market, and financial crisis. The illustration represents financial loss and market volatility.
Free with trial Detailed 3D rendering of colorful bar charts, pie charts, line graphs, and calculator showcasing financial data analysis and business growth. Bar chart decrease illustrations Colorful 3D Business Charts, Graphs, and Calculator for Financial Success. Detailed 3D rendering of colorful bar charts, pie charts, line graphs, and calculator showcasing financial data analysis and business growth.
Free with trial A close-up view of a financial bar and line graph with a pen resting on it, indicating analysis and financial data. Bar chart decrease illustrations Close-up of a financial graph with bars and line chart and a pen business data. A close-up view of a financial bar and line graph with a pen resting on it, indicating analysis and financial data
Free with trial Report document line icon. Halftone dotted pattern. Gradient icon with grain shadow. Column graph sign. Growth diagram, pie chart symbol. Line report document icon. Various designs. Vector. Bar chart decrease vectors Report document line icon. Column graph sign. Halftone dotted pattern. Vector. Report document line icon. Halftone dotted pattern. Gradient icon with grain shadow. Column graph sign. Growth diagram, pie chart symbol. Line report document icon. Various designs. Vector
Free with trial Report document line icon. Halftone dotted pattern. Gradient icon with grain shadow. Column graph sign. Growth diagram, pie chart symbol. Line report document icon. Various designs. Vector. Bar chart decrease vectors Report document line icon. Column graph sign. Halftone dotted pattern. Vector. Report document line icon. Halftone dotted pattern. Gradient icon with grain shadow. Column graph sign. Growth diagram, pie chart symbol. Line report document icon. Various designs. Vector
Free with trial Hand drawn bar graph shows decreasing trend with downward arrow illustration. Bar chart decrease vectors Hand drawn bar graph shows decreasing trend with downward arrow illustration
Free with trial Declining Bar Graph with Autumn Leaves Wreath Representing Economic Downturn. Bar chart decrease vectors Declining Bar Graph with Autumn Leaves Wreath Representing Economic Downturn
Free with trial A close-up shot depicts a businessman's hands interacting with a holographic projection of a declining bar graph displayed on his laptop screen. The graph illustrates a significant downward trend, suggesting a negative financial performance or market downturn. The scene is set in a modern office environment, highlighted by a blurred potted plant in the background, adding a touch of natural. Bar chart decrease illustrations Businessman Analyzing Decreasing Stock Market Trend on Laptop, Financial Loss. A close-up shot depicts a businessman's hands interacting with a holographic projection of a declining bar graph displayed on his laptop screen. The graph illustrates a significant downward trend, suggesting a negative financial performance or market downturn. The scene is set in a modern office environment, highlighted by a blurred potted plant in the background, adding a touch of natural
Free with trial Elevate your everyday style with Abu Taher's collection of Typography T-Shirt Designs, where words meet artistry. Bar chart decrease vectors Collection of 32 icons representing increase and decrease in business and finance. Elevate your everyday style with Abu Taher's collection of Typography T-Shirt Designs, where words meet artistry
Free with trial Computer-generated world map, white continents, dark background, overlaid with red line and bar graphs showing downward trends, stylized global data visualization. Bar chart decrease illustrations Realistic White World Map Data Visualization Dark Background Red Graphs Trend. Computer-generated world map, white continents, dark background, overlaid with red line and bar graphs showing downward trends, stylized global data visualization
Free with trial This 3D rendering showcases colorful bar graphs, pie charts, and a calculator, vividly illustrating concepts of business growth, financial success, and data analysis. The upward-trending arrow emphasizes positive progress. Bar chart decrease illustrations Colorful 3D Charts and Calculator Illustrating Business Growth and Financial Success. This 3D rendering showcases colorful bar graphs, pie charts, and a calculator, vividly illustrating concepts of business growth, financial success, and data analysis. The upward-trending arrow emphasizes positive progress.
Free with trial A small easel holds a drawing of a bar graph depicting a downward trend, symbolizing financial loss, economic recession, or a business downturn and market decrease. Bar chart decrease illustrations Miniature easel displays downturn graph showing financial decline trend business downturn. A small easel holds a drawing of a bar graph depicting a downward trend, symbolizing financial loss, economic recession, or a business downturn and market decrease
Free with trial Smartphone displaying decreasing bar graph with down arrow hand drawn illustration. Bar chart decrease vectors Smartphone displaying decreasing bar graph with down arrow hand drawn illustration
Free with trial A woman contemplates a declining bar graph, symbolizing business challenges and financial analysis. Bar chart decrease vectors Woman Analyzing Declining Bar Graph - Business and Finance Visualization Illustration. A woman contemplates a declining bar graph, symbolizing business challenges and financial analysis.
Free with trial A man in a blue suit holds a glowing blue bar graph showing increasing quality and decreasing cost with arrows and text. Bar chart decrease illustrations Businessman holding glowing bar graph showing cost reduction and quality increase. A man in a blue suit holds a glowing blue bar graph showing increasing quality. A man in a blue suit holds a glowing blue bar graph showing increasing quality and decreasing cost with arrows and text
Free with trial A comprehensive set of black and white icons for graphs and charts, illustrating various data visualization types and business-related concepts for digital and print media. Bar chart decrease vectors Diverse collection of graph and chart icons representing data analysis and business growth. A comprehensive set of black and white icons for graphs and charts, illustrating various data visualization types and business-related concepts for digital and print media
Free with trial Generative ai, The image is of a red bar graph and a red line graph. The line graph is going down, and the bar graph is going down. The image is set against a red background. The image is most likely representing a financial decline. It is a striki. Bar chart decrease illustrations A red bar graph and line graph displays a downward trend, with the bar graph decreasing in height and the line graph going down. generative ai, The image is of a red bar graph and a red line graph. The line graph is going down, and the bar graph is going down. The image is set against a red background. The image is most likely representing a financial decline. It is a striki
Free with trial This vibrant image showcases a collection of colorful 3D charts and graphs, including bar graphs, pie charts, and a line graph, all illustrating positive growth. A calculator and pencil are included, emphasizing the analytical and planning aspects of business success. Perfect for illustrating finan. Bar chart decrease illustrations Colorful 3D Financial Charts and Graphs with Calculator for Business Growth Presentation. This vibrant image showcases a collection of colorful 3D charts and graphs, including bar graphs, pie charts, and a line graph, all illustrating positive growth. A calculator and pencil are included, emphasizing the analytical and planning aspects of business success. Perfect for illustrating finan
Free with trial A red bar graph with a downward-pointing arrow illustrates a decline. The graph, isolated on a white surface, suggests financial loss or economic downturn. It represents negative trends. Bar chart decrease illustrations Red bar graph with downward arrow isolated on white background. use cases: finance, economy. A red bar graph with a downward-pointing arrow illustrates a decline. The graph, isolated on a white surface, suggests financial loss or economic downturn. It represents negative trends
Free with trial Declining bar graph with a downward arrow symbolizing economic recession and financial loss. Bar chart decrease vectors Declining bar graph with a downward arrow symbolizing economic recession and financial loss
Free with trial Economic recession, business owner seated on a falling down bar graph and a red arrow. Bar chart decrease vectors Economic recession, business owner seated on a falling down bar graph and a red arrow
Free with trial Abstract digital illustration featuring blue and red bar charts and line graphs on a dark blue background. Orange and light blue points highlight data trends. The style is clean and modern. Bar chart decrease illustrations Abstract Financial Data Visualization Blue Red Charts Graphs Lines Points finance business. Abstract digital illustration featuring blue and red bar charts and line graphs on a dark blue background. Orange and light blue points highlight data trends. The style is clean and modern
Free with trial A 3D bar graph with light blue bars of decreasing height, indicating a downward trend. A bright yellow arrow points downwards, crossing over the bars, symbolizing financial decline or economic recession. The background is a soft, muted pink. Bar chart decrease illustrations Downward Trend Graph with Falling Arrow Illustrating Financial Decline or Economic Recession. A 3D bar graph with light blue bars of decreasing height, indicating a downward trend. A bright yellow arrow points downwards, crossing over the bars, symbolizing financial decline or economic recession. The background is a soft, muted pink
Free with trial Bar graph with circles and lines darker flat icons on color round background. Bar chart decrease vectors Bar graph with circles and lines color darker flat icons. Bar graph with circles and lines darker flat icons on color round background
Free with trial Red glossy 3d arrow going down stock icon on white background. Bankruptcy, financial market crash icon for your web site design, logo, app, UI. graph chart downtrend symbol. chart going down sign. Bar chart decrease vectors Red glossy 3d arrow going down stock icon on white background. Bankruptcy, financial market crash icon for your web site design
Free with trial Red arrow pointing downward represents a financial downturn and economic loss against a backdrop of bar graphs indicating market decline and potential investment risks suggesting a challenging econom. Bar chart decrease illustrations Red downward trend arrow illustrates financial loss and market decline on a bar graph background. Red arrow pointing downward represents a financial downturn and economic loss against a backdrop of bar graphs indicating market decline and potential investment risks suggesting a challenging econom
Free with trial A vibrant bar graph illustrates a market downturn, symbolizing economic trends, financial instability, risk assessment, and potential recovery. It uses a rainbow color scheme for visual impact. Ideal for promoting your services or creating eye-catching visuals. Open area for featuring your products, copy space, banner, advertisement. . Generative AI. Bar chart decrease illustrations Colorful Bar Graph Showing Market Decline A vibrant bar graph illustrates a market downturn symbolizing economic trends. A vibrant bar graph illustrates a market downturn, symbolizing economic trends, financial instability, risk assessment, and potential recovery. It uses a rainbow color scheme for visual impact. Ideal for promoting your services or creating eye-catching visuals. Open area for featuring your products, copy space, banner, advertisement. . Generative AI
Free with trial Business bar graph with decreasing bars and a downward arrow representing economic loss and market fall. Bar chart decrease vectors Business bar graph with decreasing bars and a downward arrow representing economic loss and market fall
Free with trial Magnifying glass over bar graph, symbolizes research, analysis, insights, growth, and strategy. Can be used for display or montage your products. Empty Space for display your products, copy space ,banner, advertising. Generative AI. Bar chart decrease illustrations Data Analysis and Market Research Magnifying glass over bar graph symbolizes research analysis insights growth and strategy. Magnifying glass over bar graph, symbolizes research, analysis, insights, growth, and strategy. Can be used for display or montage your products. Empty Space for display your products, copy space ,banner, advertising. Generative AI
Free with trial Declining red arrow and bar graph against a matching backdrop visually represent a significant economic downturn and financial market losses indicating potential business risks and investment failure. Bar chart decrease illustrations Red downward trend line and bar graph illustrate economic decline and financial market downturn effect. Declining red arrow and bar graph against a matching backdrop visually represent a significant economic downturn and financial market losses indicating potential business risks and investment failure
Free with trial Monochrome chart representing big data analysis with peaks and valleys, stock market theme for investment strategy and economic forecast using modern digital infographic. Bar chart decrease illustrations Abstract 3d graph with data blocks on white grid background, business analytics concept for financial report and corporate. Monochrome chart representing big data analysis with peaks and valleys, stock market theme for investment strategy and economic forecast using modern digital infographic
Free with trial Hand drawing a downward trend graph with a yellow marker on a dark blackboard representing financial decline and economic downturn concepts. Bar chart visualization. Bar chart decrease illustrations Hand Drawing Downward Trend Graph With Yellow Marker On Dark Blackboard Representing Financial Decline. Hand drawing a downward trend graph with a yellow marker on a dark blackboard representing financial decline and economic downturn concepts. Bar chart visualization
Free with trial Sketch of a decreasing bar graph showing negative business trend with a downward arrow, decline illustration. Bar chart decrease vectors Sketch of a decreasing bar graph showing negative business trend with a downward arrow, decline illustration
Free with trial Decreasing bar graph with downward arrow icon representing financial loss, recession, and business failure. Bar chart decrease vectors Decreasing bar graph with downward arrow icon representing financial loss, recession, and business failure
Free with trial Generative ai, The image shows a blue grid with a red arrow pointing downward, indicating a decline, against a blue background, highlighting the concept of a downward trend. Bar chart decrease illustrations The image is a stock market chart showing a red arrow pointing down on a blue grid background with blue bar graphs. The arrow is. generative ai, The image shows a blue grid with a red arrow pointing downward, indicating a decline, against a blue background, highlighting the concept of a downward trend
Free with trial A stark red arrow points downwards, dramatically descending across a series of stacked white bars that resemble coins or financial data points. The bars decrease in height from left to right, visually representing a significant decline or loss. The composition is clean and isolated on a white background, emphasizing the concept of financial downturn or economic recession. Bar chart decrease illustrations Red Downward Arrow Graph with Stacked White Coin- Like Bars Illustrating Financial Decline on White Background. A stark red arrow points downwards, dramatically descending across a series of stacked white bars that resemble coins or financial data points. The bars decrease in height from left to right, visually representing a significant decline or loss. The composition is clean and isolated on a white background, emphasizing the concept of financial downturn or economic recession
Free with trial A red fuel pump nozzle points downward like a falling arrow, superimposed over a colorful bar graph and a declining line graph, symbolizing decreasing fuel prices isolated on a white surface. Bar chart decrease illustrations Fuel price decrease concept isolated on white background. for economy and finance use cases. A red fuel pump nozzle points downward like a falling arrow, superimposed over a colorful bar graph and a declining line graph, symbolizing decreasing fuel prices isolated on a white surface
Free with trial A grid of 28 simple black line art icons on a white background depicting various financial charts graphs and business related symbols including bar charts pie charts computers and money. Bar chart decrease vectors Collection of 28 minimalist line art icons representing financial data charts and business concepts graph. A grid of 28 simple black line art icons on a white background depicting various financial charts graphs and business related symbols including bar charts pie charts computers and money
Free with trial Hand drawn declining bar graph with a downward arrow illustrating a financial recession and business failure. Bar chart decrease vectors Hand drawn declining bar graph with a downward arrow illustrating a financial recession and business failure
Free with trial Hand drawn bar graph showing a downward trend with a sale tag for discounts price reductions and market decline. Bar chart decrease vectors Hand drawn bar graph showing a downward trend with a sale tag for discounts price reductions and market decline
Free with trial Generative ai, The image shows a bar chart with a red arrow pointing down, indicating a downward trend in a financial market. The glowing blue bars represent rising values, while the red arrow signifies a drop in value,. Bar chart decrease illustrations The image shows a blue and red graph with a red arrow pointing downwards, illustrating a decline in a company stock price. generative ai, The image shows a bar chart with a red arrow pointing down, indicating a downward trend in a financial market. The glowing blue bars represent rising values, while the red arrow signifies a drop in value,
Free with trial A bar graph showing a downward trend, with red and blue bars against a dark background. it represents a financial downturn, economic recession, or stock market crash. data analysis is key to understanding the trends. Bar chart decrease illustrations Stock market crash graph downtrend chart financial crisis economic recession business failure investment loss. a bar graph showing a downward trend, with red and blue bars against a dark background. it represents a financial downturn, economic recession, or stock market crash. data analysis is key to understanding the trends
Free with trial Generative ai, The image is of a red arrow pointing down, superimposed on a blue and red bar graph, symbolizing a downward trend, potentially indicating a financial or economic decline. Bar chart decrease illustrations A large red arrow points downwards over a gridded financial chart showing a sharp decline in value, with the bars of the chart. generative ai, The image is of a red arrow pointing down, superimposed on a blue and red bar graph, symbolizing a downward trend, potentially indicating a financial or economic decline
Free with trial Real estate market analysis. Graphical representation of property value trends, growth patterns. Small house model with increasing bar chart in front of financial data diagram. Bar chart decrease illustrations Real estate market analysis. Graphical representation of property value trends, growth patterns. Small house model with
Free with trial Businessman faces red bar graph wall. Economic challenges, financial crisis, market downturn concept. Man in suit, business, finance, data, investment, business strategy risk. Bar chart decrease illustrations Businessman faces red bar graph wall. Economic challenges, financial crisis, market downturn concept. Man in suit, business