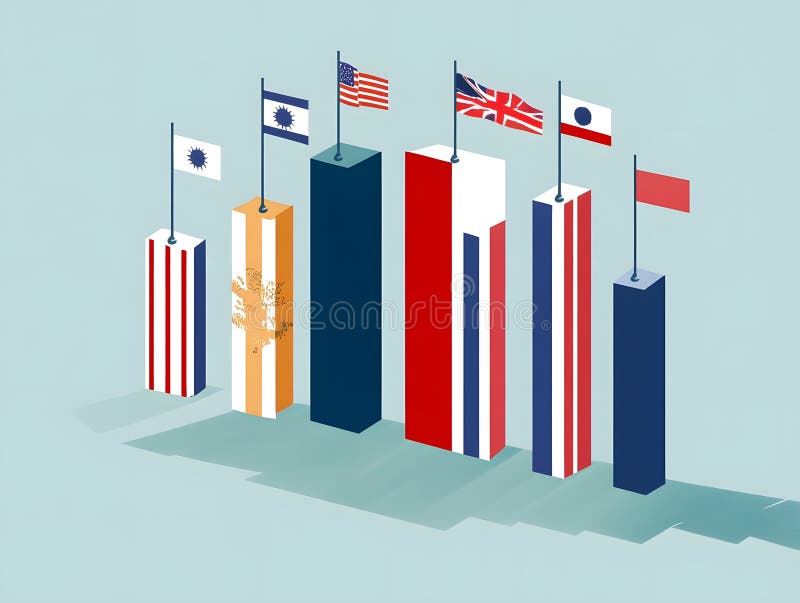
Free with trial Bar graph showing GDP growth and decline, with flag icons representing countries. Generative Ai. Bar chart decrease illustrations Bar graph showing GDP growth and decline, with flag icons representing countries
Free with trial Report statistics line icon. Continuous line with share plane. Column graph sign. Growth diagram symbol. Five star rate review in speech bubble. Report statistics single line ribbon. Vector. Bar chart decrease illustrations Report statistics line icon. Column graph sign. Continuous line with plane. Vector. Report statistics line icon. Continuous line with share plane. Column graph sign. Growth diagram symbol. Five star rate review in speech bubble. Report statistics single line ribbon. Vector
Free with trial Futuristic Declining Bar Graph with Downward Arrow on Dark Blue Background, Business Loss and Negative Growth Concept. Bar chart decrease vectors Business Loss and Negative Growth Concept
Free with trial Bar graph illustrates GDP growth and decline, marked by country flags for comparison. Generative Ai. Bar chart decrease illustrations Bar graph illustrates GDP growth and decline, marked by country flags for comparison
Free with trial Reduction chart icon vector icon on white background. EPS10. Bar chart decrease vectors Reduction chartline in Thin line black color. flat simple vector symbols illustration. Reduction chart icon vector icon on white background. EPS10
Free with trial Reduction chart icon vector icon on white background. EPS10. Bar chart decrease vectors Reduction chartline in Thin line black color. flat simple vector symbols illustration. Reduction chart icon vector icon on white background. EPS10
Free with trial Reduction chart icon vector icon on white background. EPS10. Bar chart decrease vectors Reduction chartline in Thin line black color. flat simple vector symbols illustration. Reduction chart icon vector icon on white background. EPS10
Free with trial Reduction chart icon vector icon on white background. EPS10. Bar chart decrease vectors Reduction chartline in Thin line black color. flat simple vector symbols illustration. Reduction chart icon vector icon on white background. EPS10
Free with trial Reduction chart icon vector icon on white background. EPS10. Bar chart decrease vectors Reduction chartline in Thin line black color. flat simple vector symbols illustration. Reduction chart icon vector icon on white background. EPS10
Free with trial Reduction chart icon vector icon on white background. EPS10. Bar chart decrease vectors Reduction chartline in Thin line black color. flat simple vector symbols illustration. Reduction chart icon vector icon on white background. EPS10
Free with trial Reduction chart icon vector icon on white background. EPS10. Bar chart decrease vectors Reduction chartline in Thin line black color. flat simple vector symbols illustration. Reduction chart icon vector icon on white background. EPS10
Free with trial A fuel pump nozzle is positioned over a declining bar graph with a red arrow indicating a downward trend. This symbolizes decreasing gas prices and the impact on the economy and financial markets. Isolated on white. Bar chart decrease illustrations Fuel pump over graph isolated on white background. concept for gas price decrease, economy, finance, and business use cases. A fuel pump nozzle is positioned over a declining bar graph with a red arrow indicating a downward trend. This symbolizes decreasing gas prices and the impact on the economy and financial markets. Isolated on white
Free with trial Reduction chart icon vector icon on white background. EPS10. Bar chart decrease vectors Reduction chartline in Thin line black color. flat simple vector symbols illustration. Reduction chart icon vector icon on white background. EPS10
Free with trial Reduction chart icon vector icon on white background. EPS10. Bar chart decrease vectors Reduction chartline in Thin line black color. flat simple vector symbols illustration. Reduction chart icon vector icon on white background. EPS10
Free with trial Watercolor illustration of business growth. Orange bar, pie charts on aged paper show data analysis, market trends, financial progress. Visuals represent success, planning strategic. Bar chart decrease illustrations Watercolor illustration of business growth. Orange bar, pie charts on aged paper show data analysis, market trends, financial
Free with trial Red arrow going down stock icon on white background. Bankruptcy, financial market crash icon for your web site design, logo, app, UI. graph chart down trend symbol. chart going down sign. Bar chart decrease vectors Red arrow going down stock icon on white background. Bankruptcy, financial market crash icon for your web site design
Free with trial Red arrow going down stock icon on white background. Bankruptcy, financial market crash icon for your web site design, logo, app, UI. graph chart down trend symbol. chart going down sign. Bar chart decrease vectors Red arrow going down stock icon on white background. Bankruptcy, financial market crash icon for your web site design
Free with trial Red 3d arrow going down stock icon on white background. Bankruptcy, financial market crash icon for your web site design, logo, app, UI. graph chart downtrend symbol. chart going down sign. Bar chart decrease vectors Red 3d arrow going down stock icon on white background. Bankruptcy, financial market crash icon for your web site design. Red 3d arrow going down stock icon on white background. Bankruptcy, financial market crash icon for your web site design, logo, app, UI. graph chart downtrend symbol.chart going down sign.
Free with trial Red 3d arrow going down stock icon on white background. Bankruptcy, financial market crash icon for your web site design, logo, app, UI. graph chart downtrend symbol. chart going down sign. Bar chart decrease vectors Red 3d arrow going down stock icon on white background. Bankruptcy, financial market crash icon for your web site design. Red 3d arrow going down stock icon on white background. Bankruptcy, financial market crash icon for your web site design, logo, app, UI. graph chart downtrend symbol.chart going down sign.
Free with trial Red 3d arrow going down stock icon on white background. Bankruptcy, financial market crash icon for your web site design, logo, app, UI. graph chart downtrend symbol. chart going down sign. Bar chart decrease vectors Red 3d arrow going down stock icon on white background. Bankruptcy, financial market crash icon for your web site design
Free with trial Red 3d arrow going down stock icon on white background. Bankruptcy, financial market crash icon for your web site design, logo, app, UI. graph chart downtrend symbol. chart going down sign. Bar chart decrease vectors Red 3d arrow going down stock icon on white background. Bankruptcy, financial market crash icon for your web site design. Red 3d arrow going down stock icon on white background. Bankruptcy, financial market crash icon for your web site design, logo, app, UI. graph chart downtrend symbol.chart going down sign.
Free with trial Red 3d arrow going down stock icon on white background. Bankruptcy, financial market crash icon for your web site design, logo, app, UI. graph chart downtrend symbol. chart going down sign. Bar chart decrease vectors Red 3d arrow going down stock icon on white background. Bankruptcy, financial market crash icon for your web site design. Red 3d arrow going down stock icon on white background. Bankruptcy, financial market crash icon for your web site design, logo, app, UI. graph chart downtrend symbol.chart going down sign.
Free with trial Illustrates a stock market crash with declining graphs and red arrows. Represents economic downturn, financial crisis, and recession. Symbolizes loss, risk, and negative trends in business. Bar chart decrease illustrations Stock market crash financial crisis recession economic downturn red arrow graph chart diagram decline 2024. Illustrates a stock market crash with declining graphs and red arrows. Represents economic downturn, financial crisis, and recession. Symbolizes loss, risk, and negative trends in business.
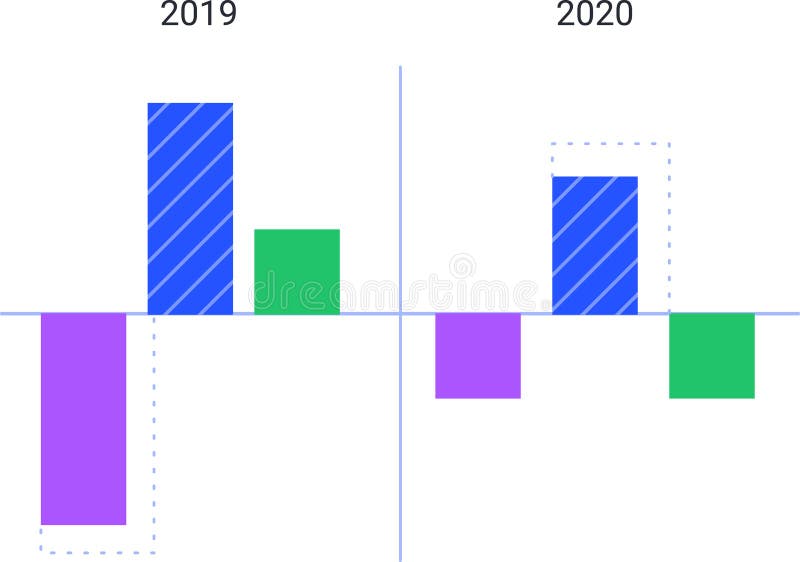
Free with trial Colorful bar charts are comparing data from 2019 and 2020, visualizing trends and statistics with positive and negative values represented by upward and downward bars. Bar chart decrease vectors Colorful bar charts are comparing data from 2019 and 2020, visualizing trends and statistics with positive and negative
Free with trial Colorful bar charts are comparing data from 2019 and 2020, visualizing trends and statistics with positive and negative values represented by upward and downward bars. Bar chart decrease illustrations Colorful bar charts are comparing data from 2019 and 2020, visualizing trends and statistics with positive and negative
Free with trial Bar graph showing GDP growth and decline, with flag icons representing countries. Generative Ai. Bar chart decrease illustrations Bar graph showing GDP growth and decline, with flag icons representing countries
Free with trial Bar graph illustrates GDP growth and decline, marked by country flags for comparison. Generative Ai. Bar chart decrease illustrations Bar graph illustrates GDP growth and decline, marked by country flags for comparison
Free with trial Global financial investment, Financial data Information for Trading and business investment, Stock market with candlestick on background. Business stock market visualization? Pie chart and graphs? Growth graph business inves background. Generative AI. Bar chart decrease illustrations Business graph of income growth, timeline, arrows indicate the direction of the graph. Global financial investment, Financial data Information for Trading and business investment, Stock market with candlestick on background. Business stock market visualization ? Pie chart and graphs ? Growth graph business inves background. Generative AI
Free with trial Gold bars with red downward financial graph. Concept of falling gold market price, economic crisis, and investment loss, vector illustration eps10. Bar chart decrease vectors Gold bars with red downward financial graph. Concept of falling gold market price, economic crisis, and investment loss
Free with trial Gold bars with red downward financial graph and arrows. Concept of falling gold market price, economic crisis, and investment loss, vector illustration eps10. Bar chart decrease vectors Gold bars with red downward financial graph and arrows. Concept of falling gold market price, economic crisis, and investment loss
Free with trial Business recession diagram with falling bars and downward arrow indicating economic decline and bankruptcy. Bar chart decrease vectors Economic crisis concept illustration with negative trend graph and bankruptcy symbol. Business recession diagram with falling bars and downward arrow indicating economic decline and bankruptcy
Free with trial A clean, minimalist icon representing an analytics graph. It features a series of vertical bars of varying heights, symbolizing data or trends. A line graph with circular data points connects the tops of some of the bars, illustrating growth, progress, or fluctuations over time. This graphic is ideal for representing business intelligence, financial data, research, or any concept related to data analysis and performance. Bar chart decrease vectors Analytics Graph Icon with Data Points. A clean, minimalist icon representing an analytics graph. It features a series of vertical bars of varying heights, symbolizing data or trends. A line graph with circular data points connects the tops of some of the bars, illustrating growth, progress, or fluctuations over time. This graphic is ideal for representing business intelligence, financial data, research, or any concept related to data analysis and performance.
Free with trial Business Icons Set isolated on black background. Simple vector logo. Bar chart decrease vectors Business Icons Set isolated on black background
Free with trial A striking 3D representation of the Bitcoin symbol in red, superimposed against a background of dynamic financial charts, including bar graphs and a red interconnected network structure. This visualization captures the volatility and global connectivity inherent in cryptocurrency markets and trading. The high-contrast design emphasizes digital finance and blockchain concepts. Rendered by Ai. Bar chart decrease illustrations Bitcoin Symbol and Abstract Trading Market Data. A striking 3D representation of the Bitcoin symbol in red, superimposed against a background of dynamic financial charts, including bar graphs and a red interconnected network structure. This visualization captures the volatility and global connectivity inherent in cryptocurrency markets and trading. The high-contrast design emphasizes digital finance and blockchain concepts. Rendered by Ai
Free with trial An adorable, plump orange tabby cat dressed in a blue collar and tie stands beside a presentation screen. The screen displays a bar graph and a line graph indicating a downward financial trend, with a prominent '-25%' marker. To the left, an office desk with a laptop and an ergonomic chair suggest a business or work environment. This whimsical illustration is perfect for conveying concepts related to financial performance, business analysis, or even humorous takes on economic downturns. Bar chart decrease illustrations Cartoon Cat Presenting Financial Report with Downward Trend. An adorable, plump orange tabby cat dressed in a blue collar and tie stands beside a presentation screen. The screen displays a bar graph and a line graph indicating a downward financial trend, with a prominent '-25%' marker. To the left, an office desk with a laptop and an ergonomic chair suggest a business or work environment. This whimsical illustration is perfect for conveying concepts related to financial performance, business analysis, or even humorous takes on economic downturns.
Free with trial Illustration of a business activities. Bar chart decrease vectors Illustration of a business activities
Free with trial Funny pizza slice cartoon character presenting a sales report bar graph. This vector illustration is perfect for business analysis, food industry, and creative presentations about market trends. Bar chart decrease illustrations Pizza Sales Report Cartoon Icon, Business Analysis Concept. Funny pizza slice cartoon character presenting a sales report bar graph. This vector illustration is perfect for business analysis, food industry, and creative presentations about market trends.
Free with trial A simple line drawing of a hand with two speech bubbles, one containing a downward trending bar graph and the other a. Bar chart decrease illustrations Hand discussing financial decline with money. A simple line drawing of a hand with two speech bubbles, one containing a downward trending bar graph and the other a.
Free with trial Vector graphic showing business profit and loss statement with green upward trends, red declines, percentages, calculator, and money icons. Bar chart decrease illustrations Illustrated Profit and Loss Financial Report with Charts and Graphs. Vector graphic showing business profit and loss statement with green upward trends, red declines, percentages, calculator, and money icons
Free with trial Web report line icon. Neumorphic, Flat shadow, 3d buttons. Column graph sign. Growth diagram symbol. Line web report icon. Social media icons. Vector. Bar chart decrease illustrations Web report line icon. Column graph sign. Neumorphic buttons. Vector. Web report line icon. Neumorphic, Flat shadow, 3d buttons. Column graph sign. Growth diagram symbol. Line web report icon. Social media icons. Vector
Free with trial A contrasting vector graphic set showing rising green bars with an upward arrow and falling red bars with a downward arrow, representing financial growth and decline. Bar chart decrease vectors Business bar charts indicating growth and decline. A contrasting vector graphic set showing rising green bars with an upward arrow and falling red bars with a downward arrow, representing financial growth and decline
Free with trial Business performance, negative trends, data analysis, economic decline, search results, user concerns. Sad emoticon, graph with downward trend magnifying glass. Business and negative trends. Bar chart decrease vectors Declining Graph with Sad Face and Search Bar Negative Trends and Analysis. Business performance, negative trends, data analysis, economic decline, search results, user concerns. Sad emoticon, graph with downward trend magnifying glass. Business and negative trends
Free with trial Web report line icon. Halftone dotted pattern. Gradient icon with grain shadow. Column graph sign. Growth diagram symbol. Line web report icon. Various designs. Vector. Bar chart decrease illustrations Web report line icon. Column graph sign. Halftone dotted pattern. Vector. Web report line icon. Halftone dotted pattern. Gradient icon with grain shadow. Column graph sign. Growth diagram symbol. Line web report icon. Various designs. Vector
Free with trial A clean black and white set of nine vector icons showing growth, decline, stability, and financial trends for business presentations and reports. Bar chart decrease vectors Economic trend icons set flat design vector illustration. A clean black and white set of nine vector icons showing growth, decline, stability, and financial trends for business presentations and reports.
Free with trial Flat design illustration showing downward trend with graph, coins and descending arrow. Demonstrates financial loss and market decline. Bar chart decrease vectors Declining financial graph with downward trend and currency. Flat design illustration showing downward trend with graph, coins and descending arrow. Demonstrates financial loss and market decline.
Free with trial Presentation board line icon. Neumorphic, Flat shadow, 3d buttons. Column graph sign. Growth diagram symbol. Line presentation board icon. Social media icons. Vector. Bar chart decrease vectors Presentation board line icon. Column graph sign. Neumorphic buttons. Vector. Presentation board line icon. Neumorphic, Flat shadow, 3d buttons. Column graph sign. Growth diagram symbol. Line presentation board icon. Social media icons. Vector
Free with trial Web Browser sale graph down Tool flat icon design isolated on a white background. Bar chart decrease vectors Web Browser sale graph down Tool flat icon design
Free with trial A professional businessman analyzes private equity portfolio management data on a large screen, evaluating ebitda growth, revenue increase, and cost optimization charts while taking notes. Bar chart decrease vectors Man Analyzing Financial Charts for Private Equity Portfolio. A professional businessman analyzes private equity portfolio management data on a large screen, evaluating ebitda growth, revenue increase, and cost optimization charts while taking notes
Free with trial Icon style image shows magnifying glass over finance data. Clean aesthetic with a black background and light colors. Bar chart decrease vectors Financial analysis magnifying glass looking at data bar graph. Icon style image shows magnifying glass over finance data. Clean aesthetic with a black background and light colors.
Free with trial Economic recession or investment failure concept, depressed businessman sitting on downtrend graph. Bar chart decrease vectors Economic recession or investment failure concept
Free with trial Set of icons representing data decline and financial loss business charts graphs arrows isolated. Bar chart decrease vectors Modern data decline visualization icons with colorful gradient. Set of icons representing data decline and financial loss business charts graphs arrows isolated
Free with trial Presentation board line icon. Halftone dotted pattern. Gradient icon with grain shadow. Column graph sign. Growth diagram symbol. Line presentation board icon. Various designs. Vector. Bar chart decrease vectors Presentation board line icon. Column graph sign. Halftone dotted pattern. Vector. Presentation board line icon. Halftone dotted pattern. Gradient icon with grain shadow. Column graph sign. Growth diagram symbol. Line presentation board icon. Various designs. Vector
Free with trial Stylized gradient bar graph with downward arrow inside a square. Represents financial loss and economic decline with flat design. Bar chart decrease vectors Decreasing graph icon representing financial loss or economic decline. Stylized gradient bar graph with downward arrow inside a square. Represents financial loss and economic decline with flat design.
Free with trial Business finance and growth icons illustrating statistics charts trends progress and success. Bar chart decrease vectors Finance and growth icons showing progress and business performance blue navy. Business finance and growth icons illustrating statistics charts trends progress and success
Free with trial Stairway symbol to reach achievement. Staircase vector icon isolated on white background. The step up to be successful of business. Bar chart decrease vectors Stairway symbol to reach achievement. Staircase vector icon isolated on white background
Free with trial This image showcases a large collection of minimalist, line-style icons representing various charts and graphs. These icons depict data visualization elements commonly used in business, analytics, and reporting. high-quality professional. Bar chart decrease vectors Collection of diverse line style charts and graphs icons displayed neatly. This image showcases a large collection of minimalist, line-style icons representing various charts and graphs. These icons depict data visualization elements commonly used in business, analytics, and reporting. high-quality professional
Free with trial A versatile collection of flat vector icons representing key concepts in finance, economics, and security. This comprehensive set includes symbols for market growth, decline, and trends, various currency representations like the Euro and Korean Won, and essential security elements such as open and closed padlocks. Designed with a clean, modern aesthetic, these icons are perfect for enhancing business presentations, financial reports, websites, mobile applications, and infographics, effectively illustrating concepts like investment, market analysis, currency exchange, and data protection. Bar chart decrease vectors Financial and Security Vector Icon Set. A versatile collection of flat vector icons representing key concepts in finance, economics, and security. This comprehensive set includes symbols for market growth, decline, and trends, various currency representations like the Euro and Korean Won, and essential security elements such as open and closed padlocks. Designed with a clean, modern aesthetic, these icons are perfect for enhancing business presentations, financial reports, websites, mobile applications, and infographics, effectively illustrating concepts like investment, market analysis, currency exchange, and data protection.
Free with trial Business balance, opportunity and development concept. Young businessman cartoon character standing and balancing in bar charts vector illustration. Bar chart decrease vectors Business balance, opportunity and development concept
Free with trial Abstract polygonal arrow pointing downwards with accompanying text 'Arrow' on dark blue background. Representing concepts of direction, descent, and selection in digital and technological contexts. Bar chart decrease vectors Abstract polygonal arrow pointing down with text \'Arrow\' on dark blue background. Abstract polygonal arrow pointing downwards with accompanying text 'Arrow' on dark blue background. Representing concepts of direction, descent, and selection in digital and technological contexts
Free with trial Dollar Coins with Upward Arrows Representing Financial Growth in Minimalist Flat Style. Bar chart decrease vectors Dollar Coins with Upward Arrows Representing Financial Growth in Minimalist Flat Style.
Free with trial A comprehensive collection of flat line design icons representing key concepts in business, finance, and data analytics. The set includes various charts (bar, line, pie), a speedometer, a magnifying glass with a graph, financial documents with checkmarks, a target with an arrow, a dollar sign, a percentage symbol, and directional arrows for growth and decline. These versatile vector elements are ideal for presentations, reports, websites, and applications focused on statistics, performance, strategy, and financial insights. Bar chart decrease illustrations Business and Data Analytics Flat Line Icons Set. A comprehensive collection of flat line design icons representing key concepts in business, finance, and data analytics. The set includes various charts (bar, line, pie), a speedometer, a magnifying glass with a graph, financial documents with checkmarks, a target with an arrow, a dollar sign, a percentage symbol, and directional arrows for growth and decline. These versatile vector elements are ideal for presentations, reports, websites, and applications focused on statistics, performance, strategy, and financial insights.
Free with trial A comprehensive vector icon set depicting various aspects of online video content creation and social media analytics. This collection includes symbols for growth charts, play buttons, speech bubbles representing comments or chat, subscriber counts, watch time indicators, and percentage-based progress arrows. Ideal for illustrating concepts related to video platforms, digital marketing, content creator dashboards, performance reports, and online engagement strategies. The modern flat design makes it suitable for websites, mobile applications, and presentations. Bar chart decrease vectors Video Content and Social Media Analytics Icon Set. A comprehensive vector icon set depicting various aspects of online video content creation and social media analytics. This collection includes symbols for growth charts, play buttons, speech bubbles representing comments or chat, subscriber counts, watch time indicators, and percentage-based progress arrows. Ideal for illustrating concepts related to video platforms, digital marketing, content creator dashboards, performance reports, and online engagement strategies. The modern flat design makes it suitable for websites, mobile applications, and presentations.
Free with trial This comprehensive vector icon set illustrates various financial market trends, economic indicators, and potential crises. Featuring line graphs, bar charts, pie charts, dollar signs, piggy banks, and warning sirens, the collection uses a striking red and black color palette to depict both growth and decline. Concepts like stock market volatility, investment risks, economic downturns, and business analytics are visually represented. Ideal for financial reports, business presentations, economic news, investment platforms, and educational materials requiring clear and impactful visual communication of market dynamics. Bar chart decrease vectors Financial Market Trends and Crisis Vector Icons Set. This comprehensive vector icon set illustrates various financial market trends, economic indicators, and potential crises. Featuring line graphs, bar charts, pie charts, dollar signs, piggy banks, and warning sirens, the collection uses a striking red and black color palette to depict both growth and decline. Concepts like stock market volatility, investment risks, economic downturns, and business analytics are visually represented. Ideal for financial reports, business presentations, economic news, investment platforms, and educational materials requiring clear and impactful visual communication of market dynamics.