Free with trial A glowing neon red bar chart shows a significant downward trend, symbolizing financial loss or negative growth on a black backdrop. Bar chart decrease illustrations Neon red bar chart illustrating a steep decline in financial performance against a dark background. A glowing neon red bar chart shows a significant downward trend, symbolizing financial loss or negative growth on a black backdrop
Free with trial Downward arrow, dollar coin, and bar chart showing data. Ideal for finance, economy, loss, budget, analysis statistics and crisis. Flat simple metaphor. Bar chart decrease vectors Declining Financial Trends Represented by Down Arrow, Dollar Coin, and Bar Chart. Downward arrow, dollar coin, and bar chart showing data. Ideal for finance, economy, loss, budget, analysis statistics and crisis. Flat simple metaphor
Free with trial Graphic visual representation of bar chart data analysis for business growth and market trends ,Generative ai. Bar chart decrease illustrations Comprehensive data analysis, visualizing business growth and market trends through bar chart graphics. Graphic visual representation of bar chart data analysis for business growth and market trends ,Generative ai
Free with trial Orange bar chart showing progressive data decline paired with a sad face icon suggesting disappointment. Ideal for business loss, failure, negative feedback, underperformance, worry, challenges. Bar chart decrease vectors Bar Chart with Declining Data and Sad Face Icon Representing Negative Trends. Orange bar chart showing progressive data decline paired with a sad face icon suggesting disappointment. Ideal for business loss, failure, negative feedback, underperformance, worry, challenges
Free with trial A 3D render of a golden bar chart with bars decreasing in height from left to right, indicating a downward trend. The bars are metallic and shiny, casting subtle shadows on the white background. This visual represents financial decline, economic downturn, or negative performance. Bar chart decrease illustrations Golden Bar Chart Showing Downward Trend on White Background graph decline. A 3D render of a golden bar chart with bars decreasing in height from left to right, indicating a downward trend. The bars are metallic and shiny, casting subtle shadows on the white background. This visual represents financial decline, economic downturn, or negative performance
Free with trial A straightforward and clear vector graphic of a bar chart illustrating a negative trend. The solid black bars steadily decrease in height from left to right. A thick diagonal arrow points downward, connecting the top of the first bar to the end of the chart, visually emphasizing the decline. This minimalist design is perfect for representing losses, financial downturns, or decreasing statistics. Bar chart decrease illustrations Declining Bar Chart Icon, AI Generated. A straightforward and clear vector graphic of a bar chart illustrating a negative trend. The solid black bars steadily decrease in height from left to right. A thick diagonal arrow points downward, connecting the top of the first bar to the end of the chart, visually emphasizing the decline. This minimalist design is perfect for representing losses, financial downturns, or decreasing statistics.
Free with trial A 3D rendered graphic depicts a simplified bar chart with pastel colored bars in pink, yellow, and blue. A line graph with white lines and orange and yellow nodes crosses diagonally above the bars. The elements are set against a light blue background with a light tan border, all isolated on a white background. Bar chart decrease vectors 3 D cartoon bar chart with line graph on blue background data. A 3D rendered graphic depicts a simplified bar chart with pastel colored bars in pink, yellow, and blue. A line graph with white lines and orange and yellow nodes crosses diagonally above the bars. The elements are set against a light blue background with a light tan border, all isolated on a white background
Free with trial Golden bar chart with downward arrow and dollar coin. Symbolizes economic decline, financial loss, market crash, recession, currency depreciation, business challenges. Bar chart decrease illustrations Economic downturn represented by golden bar chart and dollar. Golden bar chart with downward arrow and dollar coin. Symbolizes economic decline, financial loss, market crash, recession, currency depreciation, business challenges
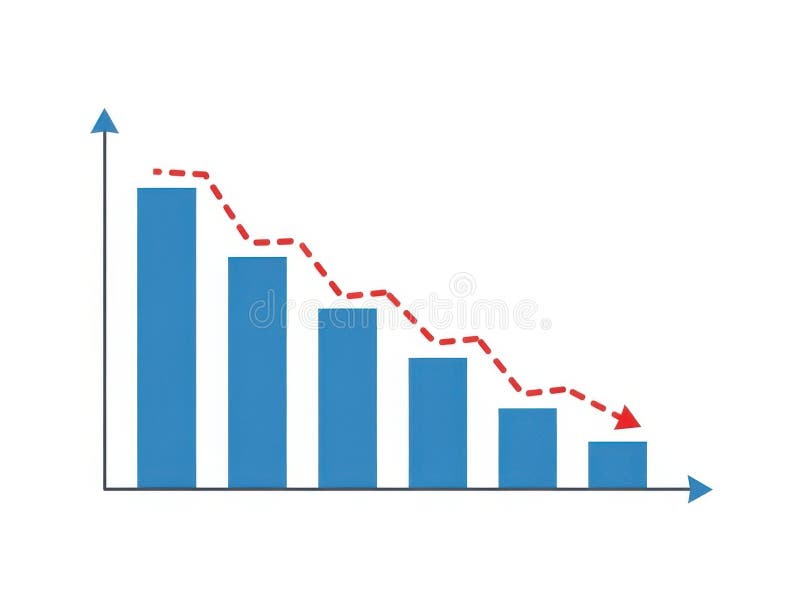
Free with trial This image features a bar chart with a decreasing trend isolated on a white background. The chart displays blue bars that progressively decrease in height from left to right, with a red dashed line indicating the downward trend. The horizontal axis represents different categories, while the vertical axis shows the corresponding values. The image is clear and SEO-friendly, highlighting data. Bar chart decrease illustrations Bar chart with decreasing trend isolated on white background. This image features a bar chart with a decreasing trend isolated on a white background. The chart displays blue bars that progressively decrease in height from left to right, with a red dashed line indicating the downward trend. The horizontal axis represents different categories, while the vertical axis shows the corresponding values. The image is clear and SEO-friendly, highlighting data
Free with trial A simple black and red bar chart displays data with varying heights on a white background. Bar chart decrease illustrations Simple Bar Chart with One Red Bar on White Background graph data. A simple black and red bar chart displays data with varying heights on a white background
Free with trial A 3D golden bar chart is arranged in a descending sequence, illustrating a downward trend. The bars are polished and reflective, casting subtle shadows on the pure white background. This visual represents a decline in data or financial performance. Bar chart decrease illustrations Golden Bar Chart Showing Downward Trend on White Background graph metallic. A 3D golden bar chart is arranged in a descending sequence, illustrating a downward trend. The bars are polished and reflective, casting subtle shadows on the pure white background. This visual represents a decline in data or financial performance
Free with trial Frozen icicle bar chart showing a downward trend and frosty arrow. Concept of economic recession or financial crisis. Bar chart decrease illustrations Frozen icicle bar chart showing a downward trend and frosty arrow
Free with trial A simple line art icon of a decreasing bar chart with a trend arrow, representing negative growth or loss in business. Bar chart decrease vectors Line Art Outline Decreasing Bar Chart Trend Arrow Business Icon. A simple line art icon of a decreasing bar chart with a trend arrow, representing negative growth or loss in business.
Free with trial Bar chart icon representing data visualization, financial growth, business analytics, and market trends, indicating increasing and decreasing values for decision making. Bar chart decrease vectors Bar chart icon showing data analysis and statistics. Bar chart icon representing data visualization, financial growth, business analytics, and market trends, indicating increasing and decreasing values for decision making
Free with trial A 3D cartoon illustration depicts a hand in a suit pointing a finger downwards towards a bar chart. The chart shows bars of varying heights in green, yellow, orange, and red, with the red bar being the shortest. A red arrow points downwards, indicating a decline. The chart sits on a red and black base, all against a white background. Bar chart decrease illustrations Cartoon Hand Pointing Downward Arrow on Declining Bar Chart with Red Base business finance. A 3D cartoon illustration depicts a hand in a suit pointing a finger downwards towards a bar chart. The chart shows bars of varying heights in green, yellow, orange, and red, with the red bar being the shortest. A red arrow points downwards, indicating a decline. The chart sits on a red and black base, all against a white background
Free with trial A 3D rendered red bar chart and line graph show a downward trend against a white grid background. The graph reflects a decline with a red arrow pointing down. Bar chart decrease illustrations Red downward trending bar chart and line graph on white grid image. A 3D rendered red bar chart and line graph show a downward trend against a white grid background. The graph reflects a decline with a red arrow pointing down
Free with trial Blue bar chart with a black arrow bouncing backward vector illustration. Economic recession, financial loss, market crash, business failure, negative growth, setback. Data graph with falling pointer. Bar chart decrease vectors Financial bar chart with a bouncing arrow pointing down economic recession and market loss vector illustration. Blue bar chart with a black arrow bouncing. Blue bar chart with a black arrow bouncing backward vector illustration. Economic recession, financial loss, market crash, business failure, negative growth, setback. Data graph with falling pointer
Free with trial A black icon representing a bar chart with bars decreasing in height Clear details and vibrant colors enhance. Bar chart decrease illustrations Black descending bar chart icon on white background graph decline. A black icon representing a bar chart with bars decreasing in height Clear details and vibrant colors enhance
Free with trial A bar chart displays four vertical bars in red, yellow, green, and blue, arranged in descending height from left to right. A thick, black arrow curves downwards from the top right, pointing towards the bars and indicating a downward trend or decline. The chart is presented on a plain white background. Bar chart decrease illustrations Downward Trending Bar Chart with Red Yellow Green Blue Bars and Black Arrow graph statistics. A bar chart displays four vertical bars in red, yellow, green, and blue, arranged in descending height from left to right. A thick, black arrow curves downwards from the top right, pointing towards the bars and indicating a downward trend or decline. The chart is presented on a plain white background
Free with trial Business Chart and Graph Set with Line, Bar, and Pie Icons for Data Analysis or Statistics in Reports and Research. Vector. Editable stroke. Bar chart decrease vectors Business Chart and Graph Set with Line, Bar, and Pie Icons for Data Analysis or Statistics in Reports and Research
Free with trial Bar chart representation of data increase growth and finance. Data analysis. Bar chart decrease vectors Bar chart representation of data increase growth and finance. Data analysis
Free with trial Four simple bar chart are displayed against a white background. Two are solid black, one showing an upward trend with an arrow, and the other a downward trend with an arrow. The remaining two. Bar chart decrease vectors Four bar chart showing upward and downward trends graph. Four simple bar chart are displayed against a white background. Two are solid black, one showing an upward trend with an arrow, and the other a downward trend with an arrow. The remaining two
Free with trial The image displays a simplified illustration of a candlestick chart pattern, commonly used in financial markets for analyzing price movements. it features a series of vertical bars, some green and some red, representing price fluctuations over a specific period. the green bars indicate an increase in price, while the red bars indicate a decrease. each bar has a body and wicks extending above and below, showing the high, low, open, and close prices. the background is plain white. Bar chart decrease illustrations Candlestick chart pattern simple illustration. the image displays a simplified illustration of a candlestick chart pattern, commonly used in financial markets for analyzing price movements. it features a series of vertical bars, some green and some red, representing price fluctuations over a specific period. the green bars indicate an increase in price, while the red bars indicate a decrease. each bar has a body and wicks extending above and below, showing the high, low, open, and close prices. the background is plain white.
Free with trial Line art icon featuring a magnifying glass positioned over a vertical bar chart. The design is simple and minimalistic, using grey lines. The bar chart consists of three bars of varying heights, and the magnifying glass is centered over the middle bar, suggesting examination or analysis of data. This icon is likely used to symbolize data analysis, inspection, or detailed observation in a graphical representation. Bar chart decrease vectors Line art icon of magnifying glass over bar chart. Line art icon featuring a magnifying glass positioned over a vertical bar chart. The design is simple and minimalistic, using grey lines. The bar chart consists of three bars of varying heights, and the magnifying glass is centered over the middle bar, suggesting examination or analysis of data. This icon is likely used to symbolize data analysis, inspection, or detailed observation in a graphical representation.
Free with trial A striking 3D render illustrating a significant financial or business decline. The image features a minimalist bar chart with three decreasing blue-grey bars, symbolizing a negative trend or falling performance. A prominent, jagged red arrow sharply points downwards across the chart, emphatically conveying concepts of loss, recession, crisis, or market downturn. Set against a vibrant yellow background, this clean and modern graphic is ideal for presentations, reports, articles, or educational materials discussing economic challenges, poor statistics, or business risks. Bar chart decrease illustrations Financial Decline Bar Chart with Red Down Arrow. A striking 3D render illustrating a significant financial or business decline. The image features a minimalist bar chart with three decreasing blue-grey bars, symbolizing a negative trend or falling performance. A prominent, jagged red arrow sharply points downwards across the chart, emphatically conveying concepts of loss, recession, crisis, or market downturn. Set against a vibrant yellow background, this clean and modern graphic is ideal for presentations, reports, articles, or educational materials discussing economic challenges, poor statistics, or business risks.
Free with trial A striking 3D rendered image featuring a bar chart with decreasing red bars and a prominent red downward-pointing arrow, set against a vibrant yellow background. This minimalist visual powerfully symbolizes financial decline, economic recession, business loss, or a negative trend in performance. The clean design effectively conveys concepts of decreasing profits, market downturns, or poor investment outcomes. Ideal for presentations, financial reports, economic analysis, infographics, and articles discussing challenges, risks, or market volatility in business and finance. Bar chart decrease illustrations Economic Downturn Bar Chart with Downward Arrow. A striking 3D rendered image featuring a bar chart with decreasing red bars and a prominent red downward-pointing arrow, set against a vibrant yellow background. This minimalist visual powerfully symbolizes financial decline, economic recession, business loss, or a negative trend in performance. The clean design effectively conveys concepts of decreasing profits, market downturns, or poor investment outcomes. Ideal for presentations, financial reports, economic analysis, infographics, and articles discussing challenges, risks, or market volatility in business and finance.
Free with trial An isometric 3D bar chart with four descending bars, made of a clear glass with a modern, holographic, and iridescent finish in pink and blue. Concept of financial decline or decreasing data trends. Bar chart decrease vectors Isometric Bar Chart Showing Decline with Iridescent Bars. An isometric 3D bar chart with four descending bars, made of a clear glass with a modern, holographic, and iridescent finish in pink and blue. Concept of financial decline or decreasing data trends
Free with trial Black and white icon of a bar graph with short bars and a downward pointing arrow. Bar chart decrease illustrations Bar graph with short bars and a downward pointing arrow bar chart decrease. Black and white icon of a bar graph with short bars and a downward pointing arrow
Free with trial A 3D rendered bar chart with bars in red, yellow, green, and blue, arranged in descending order of height. A thick black arrow curves downwards from the top left, crossing over the bars and pointing towards the bottom right, indicating a downward trend or decline. The image is set against a clean, white background. Bar chart decrease illustrations Colorful Bar Chart Showing Downward Trend with Black Arrow on White Background graph. A 3D rendered bar chart with bars in red, yellow, green, and blue, arranged in descending order of height. A thick black arrow curves downwards from the top left, crossing over the bars and pointing towards the bottom right, indicating a downward trend or decline. The image is set against a clean, white background
Free with trial Black and white icon of a bar graph showing a downward trend with an arrow pointing down. Bar chart decrease illustrations Downward trending bar graph with arrow indicating decrease bar chart decline. Black and white icon of a bar graph showing a downward trend with an arrow pointing down
Free with trial A black and white line illustration depicts a bar chart with bars of decreasing height from left to right. A thick, angular arrow points downwards across the chart, indicating a negative trend. To the upper right of the arrow, a circle contains a dollar sign, representing currency. The overall composition suggests a financial downturn or loss. Bar chart decrease vectors Bar chart with downward trend arrow and dollar coin. A black and white line illustration depicts a bar chart with bars of decreasing height from left to right. A thick, angular arrow points downwards across the chart, indicating a negative trend. To the upper right of the arrow, a circle contains a dollar sign, representing currency. The overall composition suggests a financial downturn or loss
Free with trial Blue bar chart with decreasing values beside a soft cloud shape and horizontal lines. Ideal for data analytics, cloud computing, business growth, technology, forecasts, trends, and innovation. Simple. Bar chart decrease illustrations Minimalist Bar Chart with Cloud Element Representing Data Analysis and Cloud Computing Concepts. Blue bar chart with decreasing values beside a soft cloud shape and horizontal lines. Ideal for data analytics, cloud computing, business growth, technology, forecasts, trends, and innovation. Simple
Free with trial A white line graph with connected points and a bar chart are shown within a dark gray circle icon, representing data analysis. Bar chart decrease illustrations White line graph and bar chart in a dark gray circle icon data statistics. A white line graph with connected points and a bar chart are shown within a dark gray circle icon, representing data analysis
Free with trial A 3D blue bar chart and a dark blue line graph illustrate a significant downward trend, indicating a decline in data over time. Bar chart decrease illustrations Blue bar chart and line graph showing downward trend. A 3D blue bar chart and a dark blue line graph illustrate a significant downward trend, indicating a decline in data over time.
Free with trial Down graph chart arrow drop icon. Decrease downward vector market decrease down trend. Bar chart decrease vectors Down graph chart arrow drop icon. Decrease downward vector market decrease down trend.
Free with trial A blue bar chart shows a downward trend indicated by a sharp red arrow. Isolated on a transparent background. Bar chart decrease vectors Blue bar chart with red downward trending arrow isolated on a transparent background. A blue bar chart shows a downward trend indicated by a sharp red arrow. Isolated on a transparent background
Free with trial A series of seven golden, metallic bars are arranged in a descending order, forming a bar chart that illustrates a significant decline. The bars are highly reflective, catching the light and emphasizing their three-dimensional form. The chart is presented in isolation against a pure white background, making the visual representation of a downward trend clear and impactful. Bar chart decrease illustrations Golden Bar Chart Showing a Steep Decline on White Background graph statistics. A series of seven golden, metallic bars are arranged in a descending order, forming a bar chart that illustrates a significant decline. The bars are highly reflective, catching the light and emphasizing their three-dimensional form. The chart is presented in isolation against a pure white background, making the visual representation of a downward trend clear and impactful
Free with trial A bright blue easel holds a whiteboard displaying a bar chart with a clear downward trend. The bars transition in color from green to red, and a prominent red arrow points downwards, emphasizing the decline. The illustration is set against a clean white background. Bar chart decrease illustrations Blue Easel Displaying a Downward Trend Bar Chart with Red Arrow graph decline. A bright blue easel holds a whiteboard displaying a bar chart with a clear downward trend. The bars transition in color from green to red, and a prominent red arrow points downwards, emphasizing the decline. The illustration is set against a clean white background
Free with trial A simple black silhouette of a bar chart with varying heights on a white background. The icon represents data analysis and statistical representation. Bar chart decrease vectors Bar chart icon for data analysis and statistics graph. A simple black silhouette of a bar chart with varying heights on a white background. The icon represents data analysis and statistical representation
Free with trial A black silhouette of a bar chart with three bars of decreasing height, representing a downward trend on a white background. Bar chart decrease illustrations Black Bar Chart Icon Showing Decreasing Values on White Background graph data. A black silhouette of a bar chart with three bars of decreasing height, representing a downward trend on a white background
Free with trial A conceptual illustration of market analysis featuring a bar chart, magnifying glass, upward and downward arrows, and business icons on white. Bar chart decrease illustrations Market Analysis Concept with Bar Chart Magnifying Glass and Upward Arrow graph. A conceptual illustration of market analysis featuring a bar chart, magnifying glass, upward and downward arrows, and business icons on white
Free with trial Bar chart with six vertical blue bars of descending height, indicating a negative trend. A jagged red arrow slants downward from left to right across the bars, emphasizing the decrease. No specific location is provided. Bar chart decrease vectors Financial bar chart showing downward trend with red arrow. Bar chart with six vertical blue bars of descending height, indicating a negative trend. A jagged red arrow slants downward from left to right across the bars, emphasizing the decrease. No specific location is provided.
Free with trial A 3D bar chart with two red bars and one taller green bar, topped by a percentage symbol in a circle. Bar chart decrease illustrations 3d bar chart illustrating percentage growth and decline. A 3D bar chart with two red bars and one taller green bar, topped by a percentage symbol in a circle
Free with trial 3D bar chart with red arrows pointing upwards, reflecting off a shiny, blue surface. The clean, minimalist design symbolizes financial growth, business success, and positive market trends. Ideal for use in presentations, financial reports, and marketing materials related to investment, stock market, and economic progress. Bar chart decrease illustrations Financial Growth 3D Bar Chart with Red Arrows. 3D bar chart with red arrows pointing upwards, reflecting off a shiny, blue surface. The clean, minimalist design symbolizes financial growth, business success, and positive market trends. Ideal for use in presentations, financial reports, and marketing materials related to investment, stock market, and economic progress
Free with trial 3D bar chart with red arrows pointing upwards, reflecting off a shiny, blue surface. The clean, minimalist design symbolizes financial growth, business success, and positive market trends. Ideal for use in presentations, financial reports, and marketing materials related to investment, stock market, and economic progress. Bar chart decrease illustrations Financial Growth 3D Bar Chart with Red Arrows. 3D bar chart with red arrows pointing upwards, reflecting off a shiny, blue surface. The clean, minimalist design symbolizes financial growth, business success, and positive market trends. Ideal for use in presentations, financial reports, and marketing materials related to investment, stock market, and economic progress
Free with trial 3D bar chart with red arrows pointing upwards, reflecting off a shiny, blue surface. The clean, minimalist design symbolizes financial growth, business success, and positive market trends. Ideal for use in presentations, financial reports, and marketing materials related to investment, stock market, and economic progress. Bar chart decrease illustrations Financial Growth 3D Bar Chart with Red Arrows. 3D bar chart with red arrows pointing upwards, reflecting off a shiny, blue surface. The clean, minimalist design symbolizes financial growth, business success, and positive market trends. Ideal for use in presentations, financial reports, and marketing materials related to investment, stock market, and economic progress
Free with trial Declining graph with bar chart and down arrow, vector graphic. Bar chart decrease vectors Declining graph with bar chart and down arrow, vector graphic
Free with trial Bar chart with falling growth, sad face icon, and signed financial document. Ideal for business reports, financial loss, analytics, economy, decline, strategy simple flat metaphor. Bar chart decrease vectors Declining Business Performance Indicated by Bar Chart and Sad Face Symbol. Bar chart with falling growth, sad face icon, and signed financial document. Ideal for business reports, financial loss, analytics, economy, decline, strategy simple flat metaphor
Free with trial A set of twelve black icons representing business and data analysis concepts, presented on a white background. The icons include various types of charts and graphs such as bar charts, a pie chart, and line graphs showing trends and fluctuations. There are also icons for data visualization, progress indicators, and reports. The collection is organized in a 3x4 grid. Bar chart decrease vectors Business and data analytics icons bar chart pie chart AI-Generated. A set of twelve black icons representing business and data analysis concepts, presented on a white background. The icons include various types of charts and graphs such as bar charts, a pie chart, and line graphs showing trends and fluctuations. There are also icons for data visualization, progress indicators, and reports. The collection is organized in a 3x4 grid
Free with trial A 3D render of a white bar chart with a red arrow graph descending across it. The background is a white grid. The chart is isolated on a white surface with reflections. Bar chart decrease illustrations Red arrow graph chart showing downward trend on white grid background bar chart financial. A 3D render of a white bar chart with a red arrow graph descending across it. The background is a white grid. The chart is isolated on a white surface with reflections
Free with trial Gold bars on graph and arrow up, growth, chart gold with increase and decrease, gold profit and loss concept. Bar chart decrease vectors Gold bars on graph and arrow up, growth, chart gold with increase and decrease, gold profit and loss concept
Free with trial Line graph with plotted data points, bar chart, and triangular warning alert. Ideal for analytics, business, risk management, financial trends, forecasting, reporting performance tracking simple. Bar chart decrease vectors Data Analysis with Line Graph, Bar Chart, and Warning Sign for Risk Monitoring. Line graph with plotted data points, bar chart, and triangular warning alert. Ideal for analytics, business, risk management, financial trends, forecasting, reporting performance tracking simple
Free with trial A black silhouette of a bar chart with a vertical scale and grid lines, representing data analysis. Bar chart decrease illustrations Black bar chart icon with grid lines and scale on white background graph statistics. A black silhouette of a bar chart with a vertical scale and grid lines, representing data analysis
Free with trial A simple bar chart illustrating data trends with predominantly green bars indicating positive performance and one red bar suggesting a negative outcome, isolated on white. Bar chart decrease illustrations Bar chart with green and red bars isolated on white background. A simple bar chart illustrating data trends with predominantly green bars indicating positive performance and one red bar suggesting a negative outcome, isolated on white
Free with trial A bar chart showing a steady decline with a red downward arrow, symbolizing financial loss, economic downturn, business decline, or negative performance trends. Bar chart decrease illustrations Economic Downtrend Bar Chart for Business concept 3d Rendering. A bar chart showing a steady decline with a red downward arrow, symbolizing financial loss, economic downturn, business decline, or negative performance trends
Free with trial A 3D rendered bar chart illustrates a decreasing trend. The bars, colored in a gradient from yellow to purple, represent data points that are diminishing in value. Placed on a simple gray base, the chart is isolated against a white background. This image is suitable for illustrating concepts related to business, finance, statistics, and economic downturns. Bar chart decrease illustrations 3D Bar Chart Decreasing Trend. A 3D rendered bar chart illustrates a decreasing trend. The bars, colored in a gradient from yellow to purple, represent data points that are diminishing in value. Placed on a simple gray base, the chart is isolated against a white background. This image is suitable for illustrating concepts related to business, finance, statistics, and economic downturns.
Free with trial A minimalist dark gray bar chart on a white background displays varying heights, illustrating data fluctuations and trends. Bar chart decrease illustrations Simple bar chart showing increasing and decreasing data trends. A minimalist dark gray bar chart on a white background displays varying heights, illustrating data fluctuations and trends
Free with trial An isometric 3D bar chart composed of blue, gray, and orange blocks of varying heights is arranged on a white background. Bar chart decrease illustrations Isometric 3D bar chart with blue, gray, and orange blocks on a white background graph data. An isometric 3D bar chart composed of blue, gray, and orange blocks of varying heights is arranged on a white background
Free with trial Displaying dashboard on screen showing red arrow trending down over bar chart and colorful lines. Analytics, visualization, data, performance, digital, insight, metrics. Bar chart decrease illustrations Displaying dashboard on screen showing red arrow trending down over bar chart and colorful lines
Free with trial Blue flat visualization showing bar chart and downward arrow over data grid with world map overlay. Analytics, finance, data analysis, digital, infographic, corporate, trend. Bar chart decrease illustrations Blue flat visualization showing bar chart and downward arrow over data grid with world map overlay
Free with trial A visual representation of a financial downturn, depicted by a bar chart with bars decreasing in height and a prominent red arrow pointing downwards, signifying a negative trend. Bar chart decrease illustrations Bar chart with red arrow showing decline isolated on white background. A visual representation of a financial downturn, depicted by a bar chart with bars decreasing in height and a prominent red arrow pointing downwards, signifying a negative trend
Free with trial A simple black and white illustration of a bar chart and a line graph showing business growth trends, isolated on a white background. Bar chart decrease vectors Business growth bar chart and line graph isolated on white background. A simple black and white illustration of a bar chart and a line graph showing business growth trends, isolated on a white background
Free with trial Two flat design icons representing financial trends. One shows an upward bar chart with an arrow and percentage symbol, the other a downward bar chart with a percentage symbol. Bar chart decrease vectors Upward and Downward Bar Chart Icons with Percentage Symbols Ai-Generated. Two flat design icons representing financial trends. One shows an upward bar chart with an arrow and percentage symbol, the other a downward bar chart with a percentage symbol
Free with trial A visual representation of a declining financial trend, depicted by a bar chart with a red arrow indicating a downward movement, symbolizing loss or poor performance. Bar chart decrease illustrations Bar chart with downward trending red arrow isolated on white background. A visual representation of a declining financial trend, depicted by a bar chart with a red arrow indicating a downward movement, symbolizing loss or poor performance
Free with trial A financial graph depicting a downward trend with a red arrow, blue bar chart, and white line graph on a dark blue grid background. Ideal for illustrating market decline, revenue loss, or negative performance in business, finance, and economic presentations. Bar chart decrease illustrations Declining Financial Graph Red Arrow and Bar Chart on Dark Grid Background. A financial graph depicting a downward trend with a red arrow, blue bar chart, and white line graph on a dark blue grid background. Ideal for illustrating market decline, revenue loss, or negative performance in business, finance, and economic presentations.
Free with trial A bar chart illustrating a significant decline or failure, marked by a red cross, signifying negative business outcomes and economic setbacks. Bar chart decrease illustrations Bar chart with red cross indicating failure isolated on white background. A bar chart illustrating a significant decline or failure, marked by a red cross, signifying negative business outcomes and economic setbacks
Free with trial A 3D render shows a vibrant, pastel-colored bar chart displaying a decreasing trend with blue, yellow, and lavender bars on a transparent background. Bar chart decrease vectors Downward trendy pastel bar chart illustration on transparent background. A 3D render shows a vibrant, pastel-colored bar chart displaying a decreasing trend with blue, yellow, and lavender bars on a transparent background.
Free with trial Stock market graph loss icon graphic vector line stroke outline art, negative decrease down trend chart arrow sign symbol pictogram, economy crash indicator image clipart. Bar chart decrease vectors Stock market graph loss icon graphic vector line stroke outline art, negative decrease down trend chart arrow sign symbol
Free with trial A black bar chart showing a downward trend with an arrow on a white background. Clear details and vibrant colo. Bar chart decrease illustrations Black downward trending bar chart with arrow on white background graph. A black bar chart showing a downward trend with an arrow on a white background. Clear details and vibrant colo
Free with trial A bar chart showing a steady decline with a red downward arrow, symbolizing financial loss, economic downturn, business decline, or negative performance trends. Bar chart decrease illustrations Economic Downtrend Bar Chart for Business concept 3d Rendering. A bar chart showing a steady decline with a red downward arrow, symbolizing financial loss, economic downturn, business decline, or negative performance trends
Free with trial A bar chart showing a steady decline with a red downward arrow, symbolizing financial loss, economic downturn, business decline, or negative performance trends. Bar chart decrease illustrations Economic Downtrend Bar Chart for Business concept 3d Rendering. A bar chart showing a steady decline with a red downward arrow, symbolizing financial loss, economic downturn, business decline, or negative performance trends
Free with trial A bar chart showing a steady decline with a red downward arrow, symbolizing financial loss, economic downturn, business decline, or negative performance trends. Bar chart decrease illustrations Economic Downtrend Bar Chart for Business concept 3d Rendering. A bar chart showing a steady decline with a red downward arrow, symbolizing financial loss, economic downturn, business decline, or negative performance trends
Free with trial Abstract 3D Bar Chart Showing Data Growth. Bar chart decrease illustrations Abstract 3D Bar Chart Showing Data Growth
Free with trial 3d bar chart with orange and green bars on a blue grid background isolated on white. Bar chart decrease illustrations 3d bar chart with orange and green bars on blue grid background graph data. 3d bar chart with orange and green bars on a blue grid background isolated on white
Free with trial A 3D bar chart with a red arrow indicating a significant downward trend, symbolizing financial loss or economic decline. Isolated on a white background. Bar chart decrease illustrations Bar chart showing a downward trend isolated on white background. A 3D bar chart with a red arrow indicating a significant downward trend, symbolizing financial loss or economic decline. Isolated on a white background
Free with trial Visual representation of a financial downturn. A bar chart shows a sharp decline, accompanied by a warning sign and a gold dollar coin, symbolizing economic trouble and risk. Bar chart decrease illustrations Financial crisis alert decreasing bar chart with dollar coin and warning sign. Visual representation of a financial downturn. A bar chart shows a sharp decline, accompanied by a warning sign and a gold dollar coin, symbolizing economic trouble and risk.
Free with trial Doodle style bar chart with a downward trending arrow indicating financial loss. Bar chart decrease vectors Doodle style bar chart with a downward trending arrow indicating financial loss
Free with trial Sad face beside declining line graph and bar chart, symbolizing setbacks. Ideal for finance, business, economy, loss, analytics, crisis performance. Simple flat metaphor. Bar chart decrease vectors Negative Trend Line and Declining Bar Chart Representing Business Loss or Financial Downturn. Sad face beside declining line graph and bar chart, symbolizing setbacks. Ideal for finance, business, economy, loss, analytics, crisis performance. Simple flat metaphor
Free with trial An isometric view of a bar chart with five blue bars of decreasing height, representing a downward trend. A red arrow points downwards, indicating a negative trajectory. Bar chart decrease illustrations Bar chart showing a downward trend with a red arrow isolated on white background. An isometric view of a bar chart with five blue bars of decreasing height, representing a downward trend. A red arrow points downwards, indicating a negative trajectory
Free with trial Black outline of descending bar chart with downward arrow, isolated on white background. concept of economic decline, data analysis, financial crisis, statistics. Bar chart decrease vectors Black outline of descending bar chart with downward arrow, isolated on white background. concept of economic decline, data